Downloaded 135 times


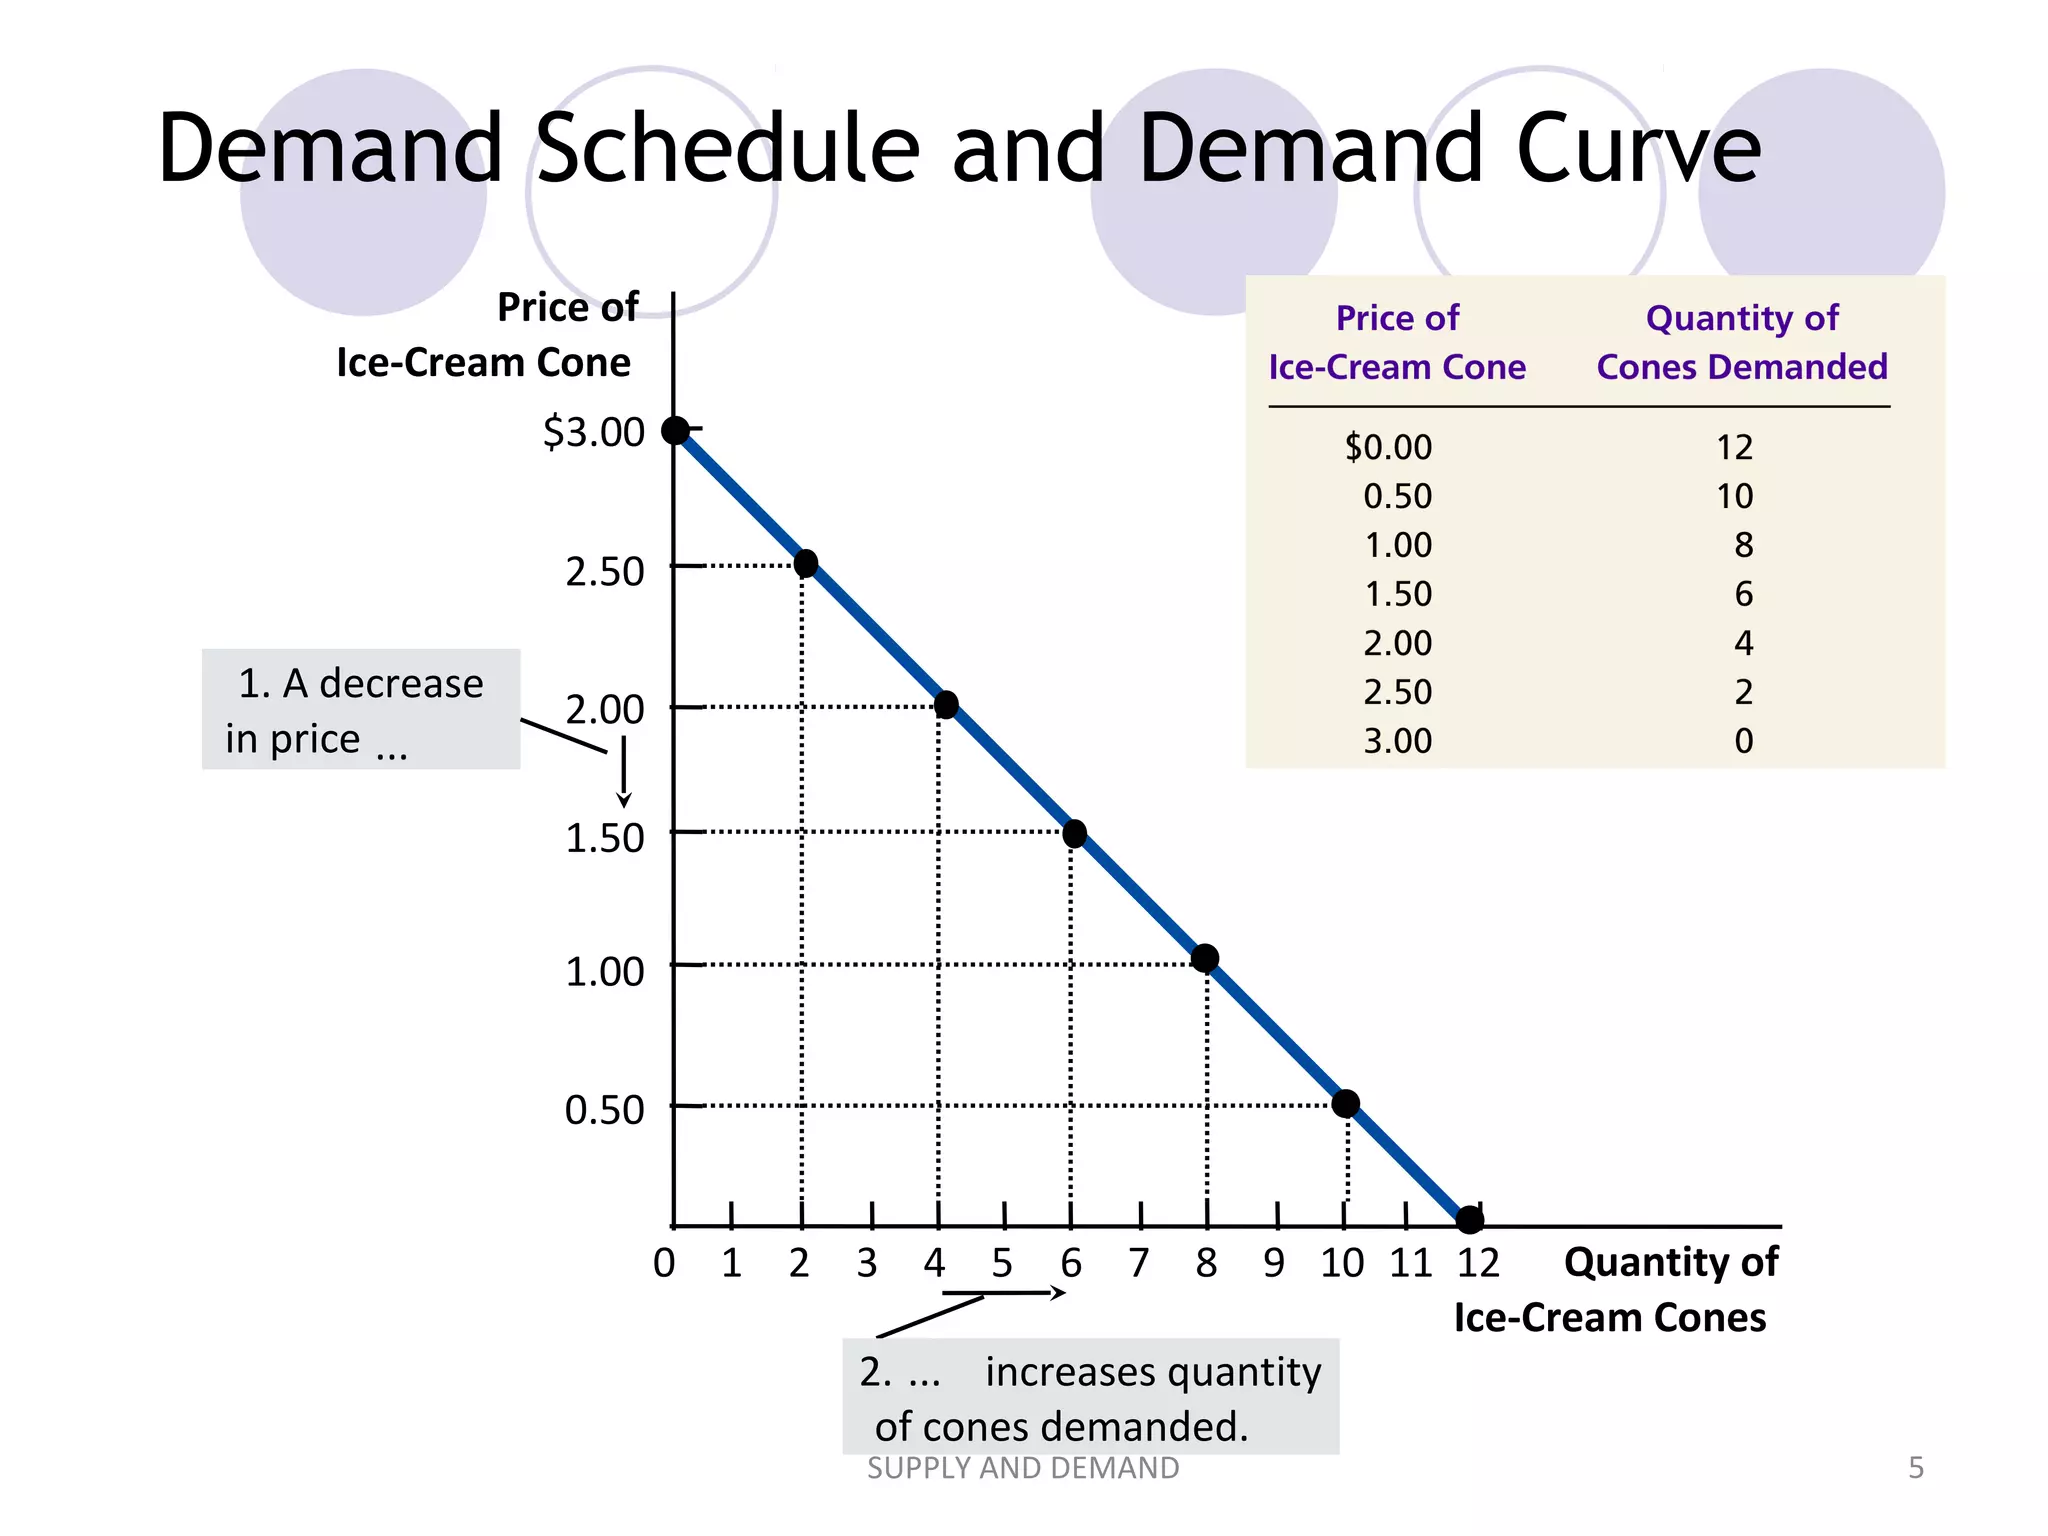


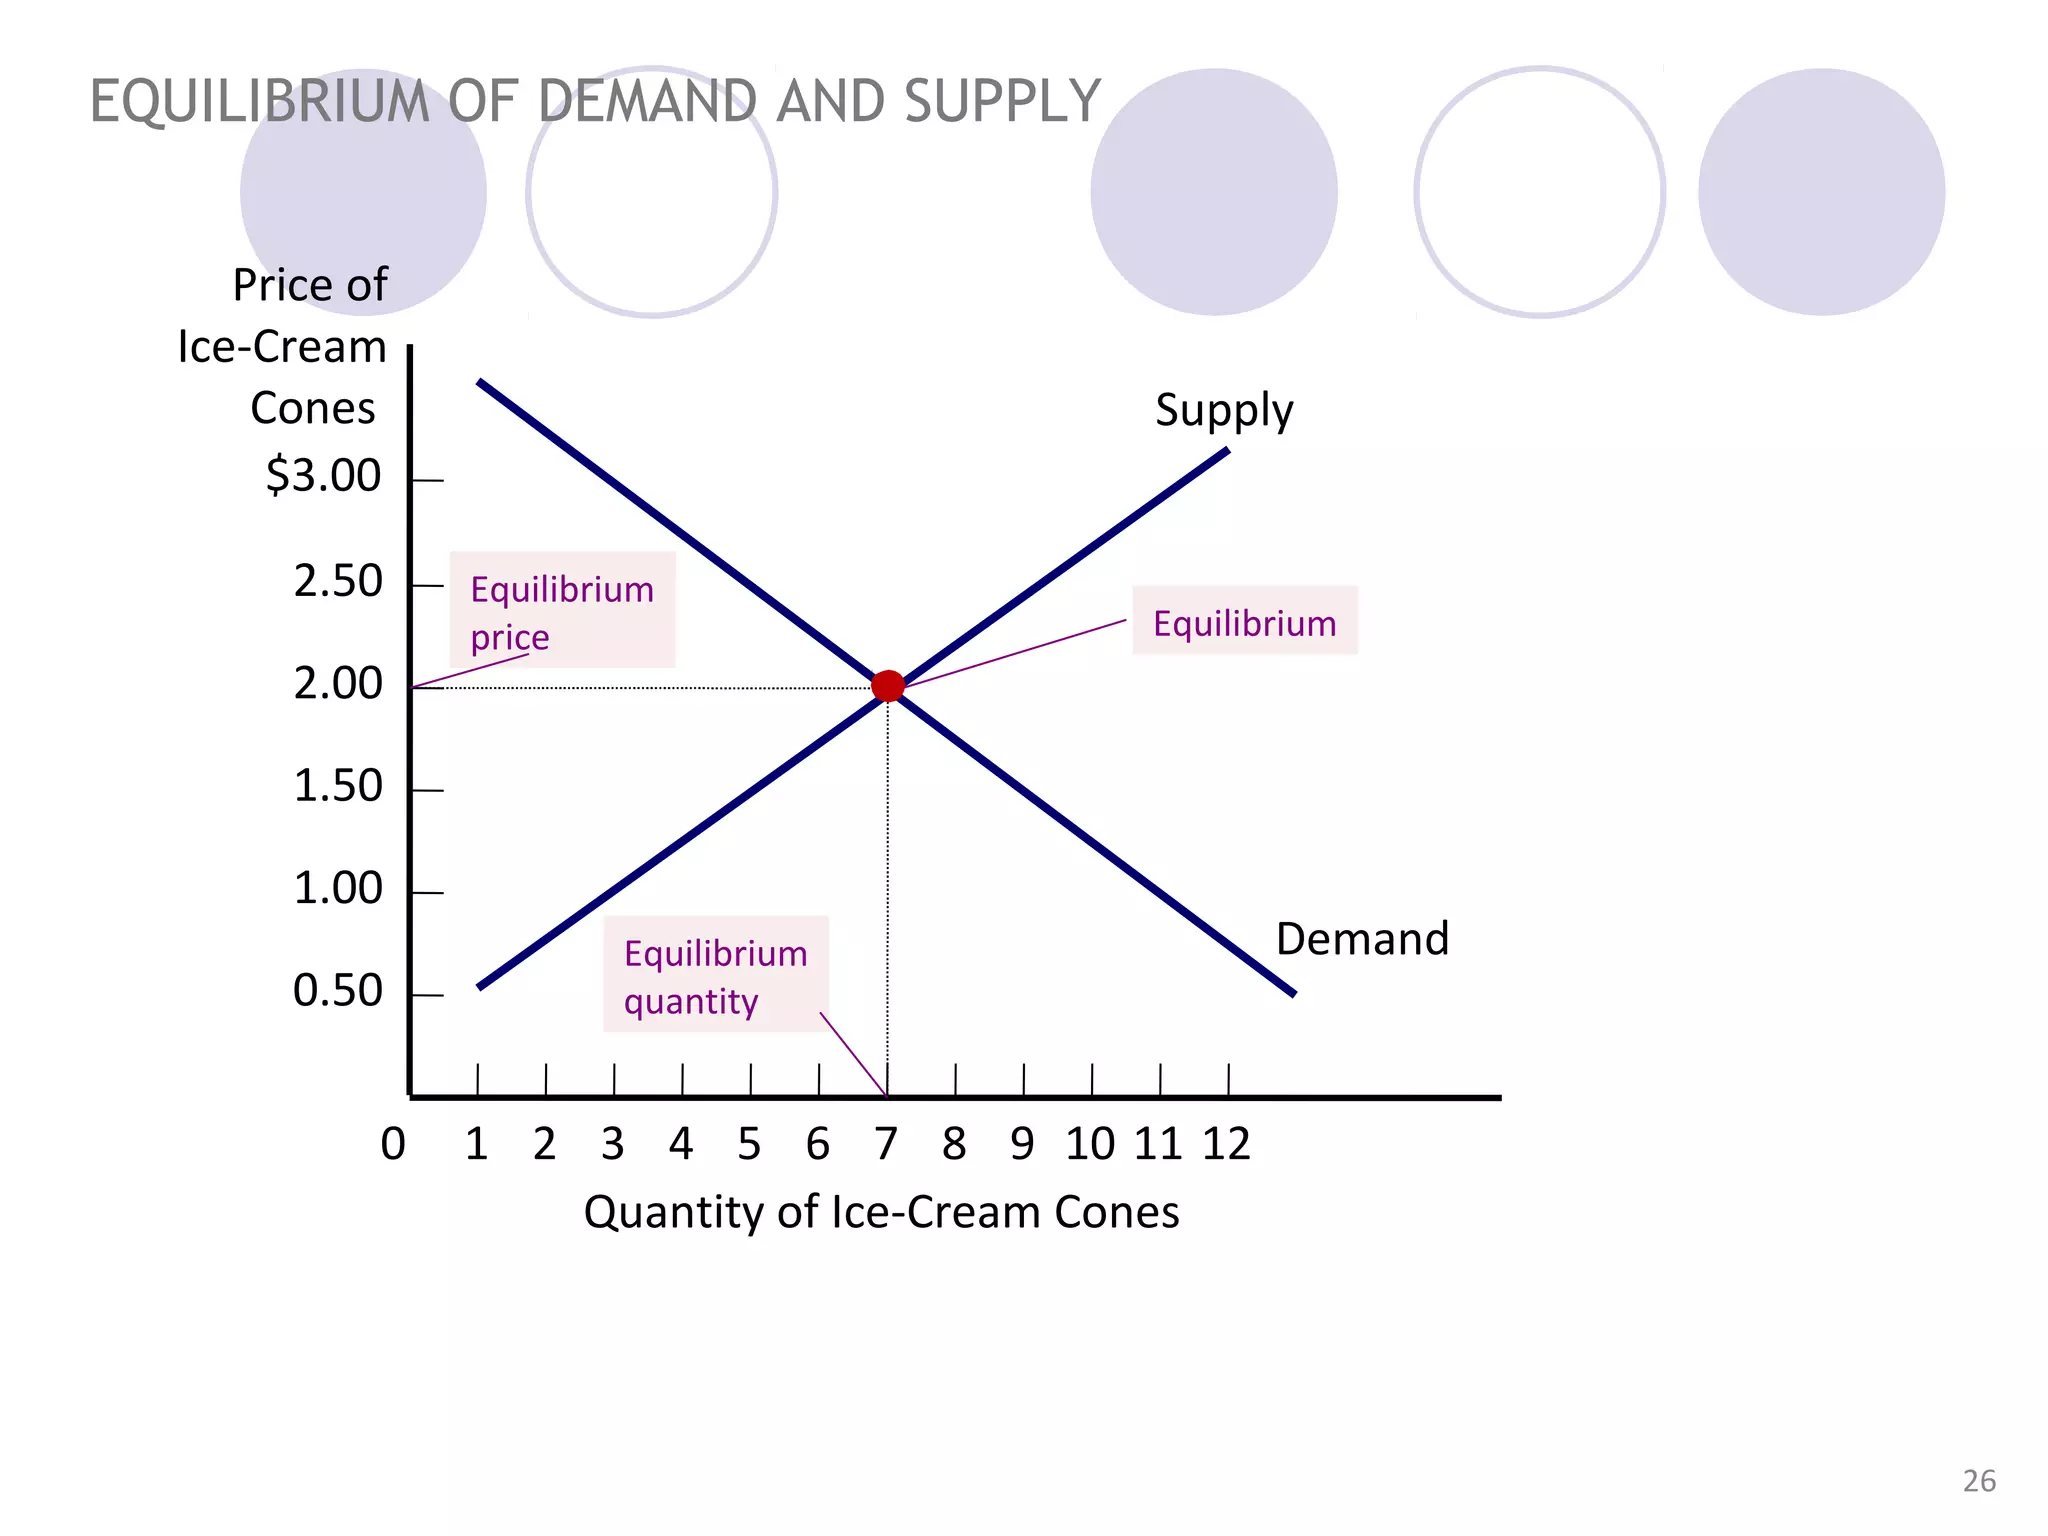


1. The document discusses the economic concepts of demand, supply, and equilibrium. 2. It explains that demand is represented by a demand curve showing the relationship between price and quantity demanded, and that it typically slopes downward as price increases according to the law of demand. Supply is represented similarly by a supply curve. 3. The document also introduces the concept of market equilibrium, which occurs where the supply and demand curves intersect and quantity supplied equals quantity demanded.


