Download as KEY, PPTX


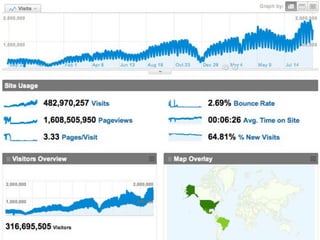
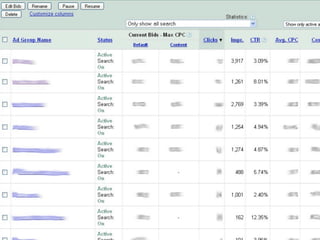
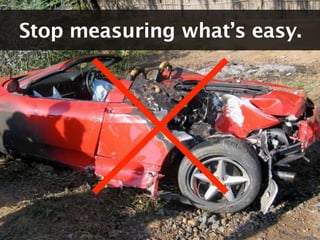
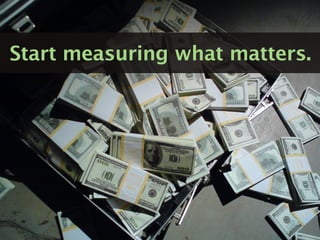


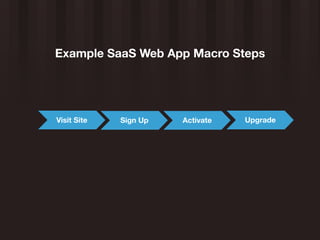
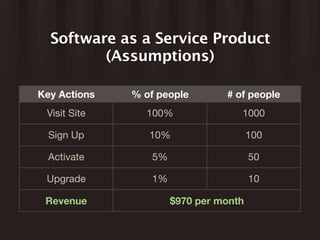

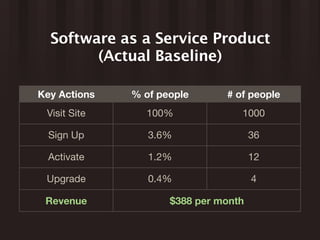
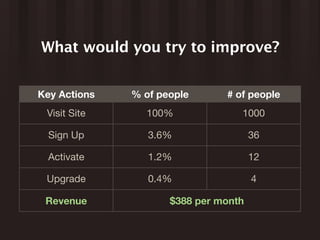
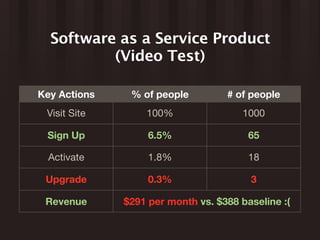

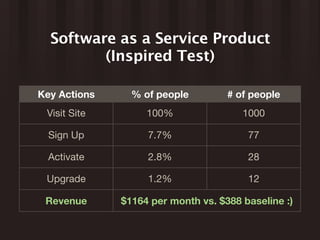
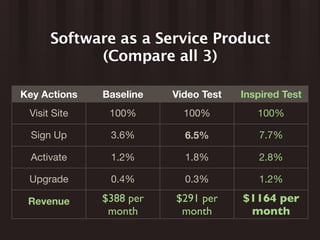
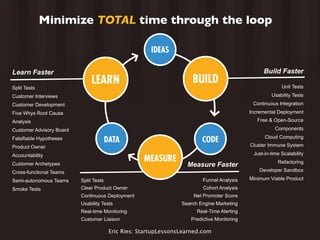


The document provides an overview of using metrics to make better decisions for startups. It discusses moving from tracking vanity metrics that are easy to measure to actionable metrics that matter. An example is given of a SaaS web app that tracks key metrics like sign-ups, activations and upgrades at each step. The actual baseline results are compared to assumptions, and different tests are discussed, like a video test that decreased conversions and an inspired test that increased revenue. The importance of learning faster through tests and data is emphasized, as is measuring faster and minimizing the time to get customers through the process.


