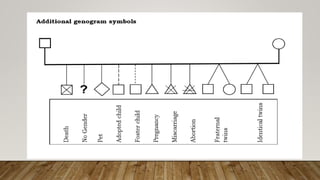
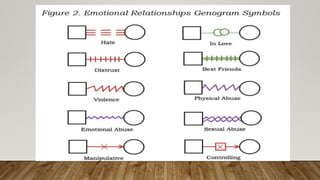
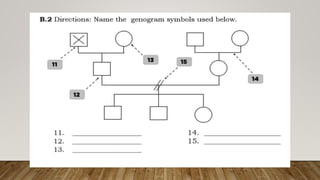
This document discusses genograms, which are graphic representations of family trees that depict relationships and attributes across generations. Genograms use symbols to represent individuals and connections between them, including marriage, divorce, and other factors. They were developed in clinical settings to identify patterns of behavior and hereditary tendencies. To make a genogram, one traces family members across generations and documents attributes like health conditions to visualize patterns. Symbols are chosen to clearly illustrate the family history and connections in the genogram.