Download to read offline


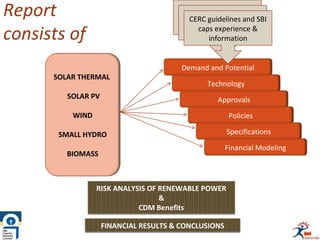
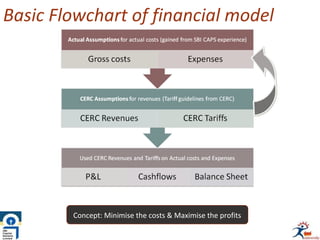
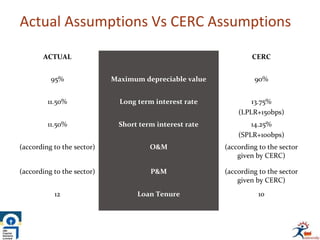

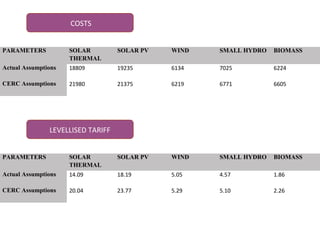
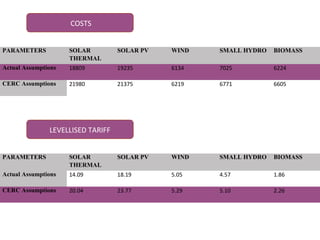

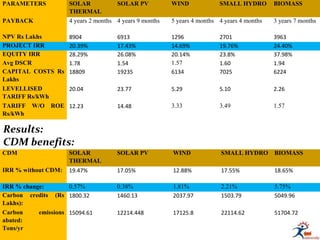


This document summarizes a study on the financial viability of various renewable power projects in India, including solar, wind, biomass, and small hydro. It finds that India's electricity demand is growing significantly but it remains dependent on oil imports and has electricity shortages. The study models hypothetical 10MW renewable power plants of each type to compare their costs, tariffs, profitability metrics, and risks. It finds that biomass has the shortest payback period at 3 years 7 months, while solar PV and thermal also show strong returns. All renewable options help reduce carbon emissions and qualify for CDM benefits. The analysis provides an advisory report for project developers on the various renewable sectors in India.


