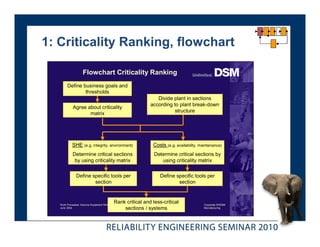
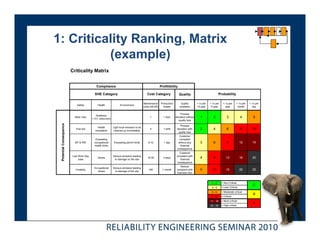
Define criticality matrix with:
- Potential consequence (safety, environment, production)
- Frequency of use
- Replacement cost
- Downtime impact
2 3 4 High
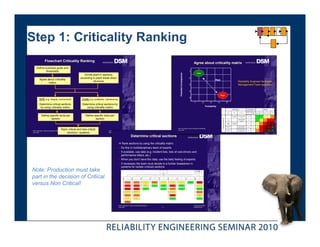
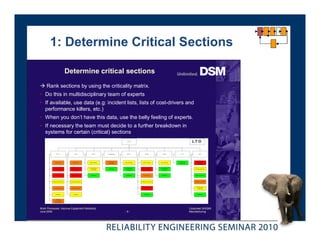
Agree about criticality
ranking per equipment
Low
Frequency of use
High
Low
Replacement cost
High
Low
Downtime impact
High
Criticality matrix:
- Safety, Environment, Production
- Frequency of use
- Replacement cost
- Downtime impact


![Smith Secure 2011 English[1]](https://cdn.slidesharecdn.com/ss_thumbnails/smithsecure2011english1-13080182409464-phpapp02-110613214028-phpapp02-thumbnail.jpg?width=640&height=640&fit=bounds)


