Download to read offline

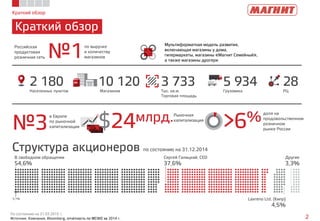


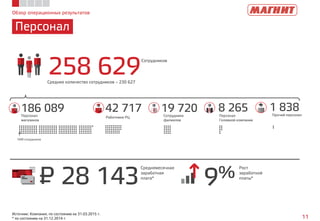
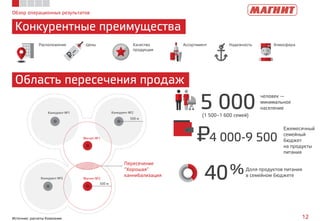
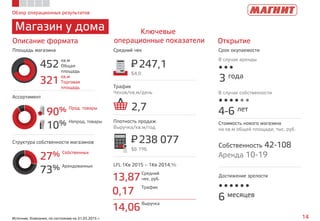
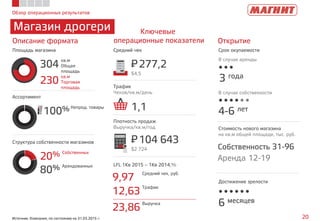
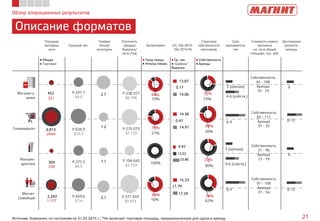
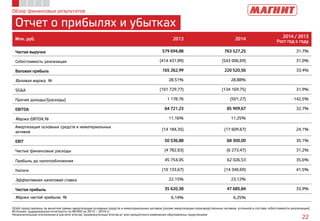
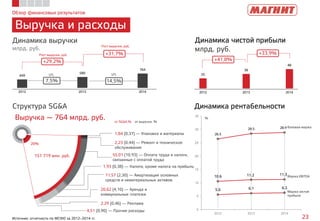


В первом квартале 2015 года компания, представляющая лидера российской продуктовой розничной торговли 'Магнит', продемонстрировала значительный рост выручки до 764 млрд руб., увеличив маржу чистой прибыли до 6,25%. Мультиформатная модель включает различные форматы магазинов, и в 2014 году компания открыла 764 новых магазина, а также запланировала дальнейшее расширение на 28-32% в 2015 году. Структура акционеров показывает, что 54,6% акций свободно обращаются на рынке, а CEO Сергей Галицкий контролирует 37,6% всех акций.


