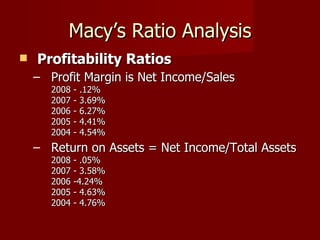
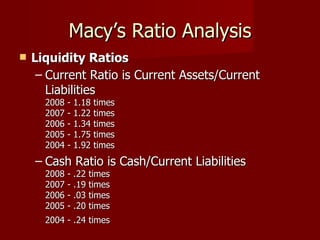
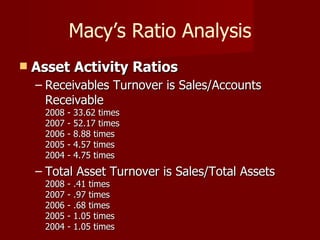
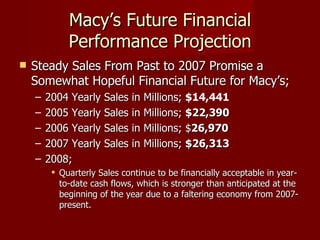
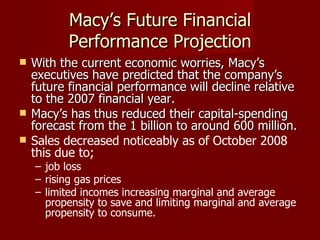
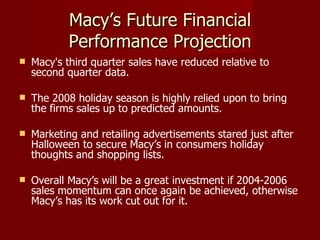
Lana Beal Amber Bock Jeremy Kliethermes Michael Yaache Courtney Bade
The Drive to Differentiate by Aggressively Delivering a Differentiated Shopping Experience with Unique Merchandise, Fashion Brands, Interesting Stores, Engaging Online Sites, Excellent Service and Breakthrough Marketing and Special Events
A Macy’s Background R.H. Macy & Co. began in 1858 in New York City, NY & later changed the company name to Macy’s®. The first retailer to promote a woman to an executive position. Macy’s Turned 150 on October 28, 2008 and to celebrate were granted the right to rename New York's 34 th  Street to R.H. Macy Way in honor of the brand's founder.  With so many choices today, shoppers are looking for retailers that stand out from the crowd and Macy’s strives to do just that. As a retailer Macy’s has more than 800 stores across the country that are closely integrated with a thriving online business.
Macy’s Financial Overview The single letter "M" was adopted as the ticker symbol on the New York Stock Exchange.  As of Feb 2, 2008 there are approximately 419.7 million shares of Macy's, Inc. common stock outstanding. Member of The Bank of New York which provides Direct Registration that allows stock shares to be owned and tracked electronically without a certificate being issued. The Board of Directors authorized a $4 billion increase in the company's stock buyback program,  85.3 million shares of stock were repurchased for $3.3 billion in 2007.
Macy’s Financial Goals & Objectives Accelerate comp-store sales growth. To continue to increase profitability levels (i.e. earnings before interest, taxes, depreciation and amortization) as a percent of sales to a level of 14 percent to 15 percent. Effectively utilize excess cash flows through a combination of strategic growth opportunities and stock buybacks.  Grow earnings per share while increasing return on gross investment. Maintain a creditable equity level sufficient to cover an attempted decline in liabilities
Income Statement and Balance Sheet Analysis Macy’s yielded a higher net income in the 2006 financial year compared to 2007-2008. The balance sheets indicate a 5 year period reduction in total assets for the 2007-2008 financial years.  Macys incurred higher rates with regards to general selling and administration expenses, within the last five years;  32.5% in 2008 32.2% in 2007 31.2% in 2006  31.6% in 2005  These numbers have inevitably increased operating income expenses by 0.3% in the current financial year.
Income Statement and Balance Sheet Analysis Debt & Equity Shareholders equity grew from 2004-2006 and was at its peak in 2006, after which there was a steady decline.  The year 2005, saw an increase in short term debt but a reduction in long term debt. In 2007 there was a reduction in both the long term and short term debts. The balance sheet indicates that Macy’s long term and short term debts have grown so far in 2008.
Macy’s Business Problems Macy’s suffered in mid to late 2007 as the economy weakened and consumer confidence eroded.   Macy's, Inc. reported diluted earnings per share from continuing operations of $2.01 per share, compared with $1.80 per share for the full 53 weeks of fiscal 2006. Net interest expense was $543 million for 2007, compared to $390 million for 2006, an increase of $153 million. The increase in net interest expense for 2007, as compared to 2006, resulted from increased levels of borrowings during 2007.
Macy’s Business Problems  Overall continuing operating cash on hand decreased.  Net cash used by continuing financing activities was $2.069 million in 2007, compared with $4.013 billion in cash used in 2006.  In 2007, the company issued $1.950 billion in debt and repaid only $649 million of that debt.
Macy’s Challenges Macy’s must overcome the financial and economic crisis challenges by; Decreasing store inventory purchases Increasing store and website net sales growth Keeping and low debt to equity ratio Raise earning per share Reduce outstanding accounts receivable Increase available continuing operating cash Overall Macy’s needs to increase net sales and maximize profitability.
Macy’s Ratio Analysis Profitability Ratios   Profit Margin is Net Income/Sales  2008 - .12%  2007 - 3.69%  2006 - 6.27%  2005 - 4.41%  2004 - 4.54%  Return on Assets = Net Income/Total Assets  2008 - .05%  2007 - 3.58%  2006 -4.24%  2005 - 4.63%  2004 - 4.76%
Macy’s Profitability Ratio Analysis Macy’s profitability measures how efficiently it uses its assets and how efficiently the firm manages its operations. The bottom line is net income.  Profit Margin tells investors what percentage of every dollar sold in sales is profit,  It is desirable to have a high profit margin, but total profit may go up or down, so the fact that margins are smaller is not necessarily financially bad.  Another way to measure profitability is by return on assets, which is a measure of profit per dollar of assets.
Macy’s Ratio Analysis Liquidity Ratios   Current Ratio is Current Assets/Current Liabilities  2008 - 1.18 times 2007 - 1.22 times  2006 - 1.34 times  2005 - 1.75 times  2004 - 1.92 times  Cash Ratio is Cash/Current Liabilities  2008 - .22 times  2007 - .19 times  2006 - .03 times  2005 - .20 times  2004 - .24 times
Macy’s Liquidity Ratio Analysis Liquidity or short-term solvency measures Macy’s ability to pay its bills over the short run without undue stress.  The focus for solvency ratios lies within current assets and current liabilities.  A very short-term creditor might be interested in the cash ratio.  Cash Ratio tells you how much current cash you have to cover your current liabilities.
Macy’s Ratio Analysis Asset Activity Ratios   Receivables Turnover is Sales/Accounts Receivable  2008 - 33.62 times  2007 - 52.17 times  2006 - 8.88 times  2005 - 4.57 times  2004 - 4.75 times  Total Asset Turnover is Sales/Total Assets  2008 - .41 times  2007 - .97 times  2006 - .68 times  2005 - 1.05 times  2004 - 1.05 times
Macy’s  Asset Activity  Ratio Analysis To measure the efficiency at which Macy’s uses its assets we use asset ratios.  The specific ratios we discuss can all be interpreted as measures of turnover. What they are intended to describe is how efficiently, or intensively, a firm uses its assets to generate sales.  Receivables turnover tells you how fast credit on sales is collected.  Total Asset Turnover or (TAT) tells you for every dollar in assets that Macy's has, how much is generated in sales.
Macy’s Ratio Analysis Market Value Ratios   Earnings Per Share of Stock is Net Income/Stock Shares Outstanding   2008 - .03 times  2007 - 2.00 times  2006 - 6.53 times  2005 - 3.90 times  2004 - 3.74 times  Price Earnings Ratio is Price Per Share of Stock/Earnings Per Share   2008 - .90 times  2007 - .92 times  2006 - .50 times  2005 - 1.01 times  2004 - 1.01 times
Macy’s Market Value Ratio Analysis The Price Earnings ratio measures how much investors are willing to pay per dollar of current earnings. Expressed as a numerical value “times”.  Higher PE’s are often taken to mean that the firm has significant prospects for future growth and will be a good investment for profit maximization.
Macy’s Ratio Analysis Debt Ratios Equity Multiplier is Total Assets/Total Equity   2008 - 2.85 times  2007 - 2.41 times  2006 - 2.45 times  2005 - 2.41 times  2004 - 2.45 times  Debt-Equity Ratio is Total debt/total equity  2008 - 1.85 times  2007 - 1.41 times  2006- 1.45 times  2005 - 1.41 times  2004 - 1.45 times  Analysis Long-term solvency ratios are intended to address the firm’s long-run ability to meet is obligations, or its financial leverage. These ratios tell you how much debt Macy's has compared to its total equity.
Macy’s Trend Analysis Short-Term Solvency/Liquidity Measures *Figures expressed in millions 2004 2005 2006 2007 2008 Current Ratio Current Assets 7452 7510 10145 7422 6324 Current Liabilities 3883 4301 7590 6095 5360 2004 2005 2006 2007 2008 Current Ratio = Current Assets/Current Liabilities 1.92 1.75 1.34 1.22 1.18 Quick Ratio 2004 2005 2006 2007 2008 Current Assets 7452.00 7510.00 10145.00 7422.00 6324.00 Inventory 3215.00 3120.00 5459.00 5317.00 5060.00 Current Liabilities 3883.00 4301.00 7590.00 6095.00 5360.00 2004 2005 2006 2007 2008 Quick Ratio = (Current Assets - Inventory)/Current Liabilities 1.09 1.02 0.62 0.35 0.24
Macy’s Current Ratio Analysis
Macy’s Trend Analysis Long Term Solvency Total Debt Ratio Measure *Figures expressed in millions 2004 2005 2006 2007 2008 Total Assets 14550 14885 33168 29550 27789 Total Equity 5940 6167 13519 12254 9907 2004 2005 2006 2007 2008 Total Debt Ratio = (Total Assets - Total Equity)/ Total Assets 0.59 0.59 0.59 0.59 0.64
Macy’s Trend Analysis Total Debt Ratio
Macy’s Trend Analysis   Profitability Return On Equity Measure *Figures expressed in millions   2004 2005 2006 2007 2008 Net Income 693 689 1406 995 893 Total Equity 5940 6167 13519 12254 9907 2004 2005 2006 2007 2008 Return on Equity = Net Income/Total Equity 0.12 0.11 0.10 0.08 0.09
Macy’s Trend Analysis Return On Equity
Macy’s Future Financial Performance Projection Steady Sales From Past to 2007 Promise a Somewhat Hopeful Financial Future for Macy’s; 2004 Yearly Sales in Millions;  $14,441   2005 Yearly Sales in Millions;  $22,390   2006 Yearly Sales in Millions; $ 26,970   2007 Yearly Sales in Millions;  $26,313    2008;  Quarterly Sales continue to be financially acceptable in year-to-date cash flows, which is stronger than anticipated at the beginning of the year due to a faltering economy from 2007-present.
Macy’s Future Financial Performance Projection With the current economic worries, Macy’s executives have predicted that the company’s future financial performance will decline relative to the 2007 financial year. Macy’s has thus reduced their capital-spending forecast from the 1 billion to around 600 million.   Sales decreased noticeably as of October 2008 this due to; job loss rising gas prices limited incomes increasing marginal and average propensity to save and limiting marginal and average propensity to consume.
Macy’s Future Financial Performance Projection Macy's third quarter sales have reduced relative to second quarter data. The 2008 holiday season is highly relied upon to bring the firms sales up to predicted amounts. Marketing and retailing advertisements stared just after Halloween to secure Macy’s in consumers holiday thoughts and shopping lists. Overall Macy’s will be a great investment if 2004-2006 sales momentum can once again be achieved, otherwise Macy’s has its work cut out for it.

Macy’S Inc In Computer Lab

  • 1.
    Lana Beal AmberBock Jeremy Kliethermes Michael Yaache Courtney Bade
  • 2.
    The Drive toDifferentiate by Aggressively Delivering a Differentiated Shopping Experience with Unique Merchandise, Fashion Brands, Interesting Stores, Engaging Online Sites, Excellent Service and Breakthrough Marketing and Special Events
  • 3.
    A Macy’s BackgroundR.H. Macy & Co. began in 1858 in New York City, NY & later changed the company name to Macy’s®. The first retailer to promote a woman to an executive position. Macy’s Turned 150 on October 28, 2008 and to celebrate were granted the right to rename New York's 34 th Street to R.H. Macy Way in honor of the brand's founder. With so many choices today, shoppers are looking for retailers that stand out from the crowd and Macy’s strives to do just that. As a retailer Macy’s has more than 800 stores across the country that are closely integrated with a thriving online business.
  • 4.
    Macy’s Financial OverviewThe single letter "M" was adopted as the ticker symbol on the New York Stock Exchange. As of Feb 2, 2008 there are approximately 419.7 million shares of Macy's, Inc. common stock outstanding. Member of The Bank of New York which provides Direct Registration that allows stock shares to be owned and tracked electronically without a certificate being issued. The Board of Directors authorized a $4 billion increase in the company's stock buyback program, 85.3 million shares of stock were repurchased for $3.3 billion in 2007.
  • 5.
    Macy’s Financial Goals& Objectives Accelerate comp-store sales growth. To continue to increase profitability levels (i.e. earnings before interest, taxes, depreciation and amortization) as a percent of sales to a level of 14 percent to 15 percent. Effectively utilize excess cash flows through a combination of strategic growth opportunities and stock buybacks. Grow earnings per share while increasing return on gross investment. Maintain a creditable equity level sufficient to cover an attempted decline in liabilities
  • 6.
    Income Statement andBalance Sheet Analysis Macy’s yielded a higher net income in the 2006 financial year compared to 2007-2008. The balance sheets indicate a 5 year period reduction in total assets for the 2007-2008 financial years. Macys incurred higher rates with regards to general selling and administration expenses, within the last five years; 32.5% in 2008 32.2% in 2007 31.2% in 2006 31.6% in 2005 These numbers have inevitably increased operating income expenses by 0.3% in the current financial year.
  • 7.
    Income Statement andBalance Sheet Analysis Debt & Equity Shareholders equity grew from 2004-2006 and was at its peak in 2006, after which there was a steady decline. The year 2005, saw an increase in short term debt but a reduction in long term debt. In 2007 there was a reduction in both the long term and short term debts. The balance sheet indicates that Macy’s long term and short term debts have grown so far in 2008.
  • 8.
    Macy’s Business ProblemsMacy’s suffered in mid to late 2007 as the economy weakened and consumer confidence eroded. Macy's, Inc. reported diluted earnings per share from continuing operations of $2.01 per share, compared with $1.80 per share for the full 53 weeks of fiscal 2006. Net interest expense was $543 million for 2007, compared to $390 million for 2006, an increase of $153 million. The increase in net interest expense for 2007, as compared to 2006, resulted from increased levels of borrowings during 2007.
  • 9.
    Macy’s Business Problems Overall continuing operating cash on hand decreased. Net cash used by continuing financing activities was $2.069 million in 2007, compared with $4.013 billion in cash used in 2006. In 2007, the company issued $1.950 billion in debt and repaid only $649 million of that debt.
  • 10.
    Macy’s Challenges Macy’smust overcome the financial and economic crisis challenges by; Decreasing store inventory purchases Increasing store and website net sales growth Keeping and low debt to equity ratio Raise earning per share Reduce outstanding accounts receivable Increase available continuing operating cash Overall Macy’s needs to increase net sales and maximize profitability.
  • 11.
    Macy’s Ratio AnalysisProfitability Ratios Profit Margin is Net Income/Sales 2008 - .12% 2007 - 3.69% 2006 - 6.27% 2005 - 4.41% 2004 - 4.54% Return on Assets = Net Income/Total Assets 2008 - .05% 2007 - 3.58% 2006 -4.24% 2005 - 4.63% 2004 - 4.76%
  • 12.
    Macy’s Profitability RatioAnalysis Macy’s profitability measures how efficiently it uses its assets and how efficiently the firm manages its operations. The bottom line is net income. Profit Margin tells investors what percentage of every dollar sold in sales is profit, It is desirable to have a high profit margin, but total profit may go up or down, so the fact that margins are smaller is not necessarily financially bad. Another way to measure profitability is by return on assets, which is a measure of profit per dollar of assets.
  • 13.
    Macy’s Ratio AnalysisLiquidity Ratios Current Ratio is Current Assets/Current Liabilities 2008 - 1.18 times 2007 - 1.22 times 2006 - 1.34 times 2005 - 1.75 times 2004 - 1.92 times Cash Ratio is Cash/Current Liabilities 2008 - .22 times 2007 - .19 times 2006 - .03 times 2005 - .20 times 2004 - .24 times
  • 14.
    Macy’s Liquidity RatioAnalysis Liquidity or short-term solvency measures Macy’s ability to pay its bills over the short run without undue stress. The focus for solvency ratios lies within current assets and current liabilities. A very short-term creditor might be interested in the cash ratio. Cash Ratio tells you how much current cash you have to cover your current liabilities.
  • 15.
    Macy’s Ratio AnalysisAsset Activity Ratios Receivables Turnover is Sales/Accounts Receivable 2008 - 33.62 times 2007 - 52.17 times 2006 - 8.88 times 2005 - 4.57 times 2004 - 4.75 times Total Asset Turnover is Sales/Total Assets 2008 - .41 times 2007 - .97 times 2006 - .68 times 2005 - 1.05 times 2004 - 1.05 times
  • 16.
    Macy’s AssetActivity Ratio Analysis To measure the efficiency at which Macy’s uses its assets we use asset ratios. The specific ratios we discuss can all be interpreted as measures of turnover. What they are intended to describe is how efficiently, or intensively, a firm uses its assets to generate sales. Receivables turnover tells you how fast credit on sales is collected. Total Asset Turnover or (TAT) tells you for every dollar in assets that Macy's has, how much is generated in sales.
  • 17.
    Macy’s Ratio AnalysisMarket Value Ratios Earnings Per Share of Stock is Net Income/Stock Shares Outstanding 2008 - .03 times 2007 - 2.00 times 2006 - 6.53 times 2005 - 3.90 times 2004 - 3.74 times Price Earnings Ratio is Price Per Share of Stock/Earnings Per Share 2008 - .90 times 2007 - .92 times 2006 - .50 times 2005 - 1.01 times 2004 - 1.01 times
  • 18.
    Macy’s Market ValueRatio Analysis The Price Earnings ratio measures how much investors are willing to pay per dollar of current earnings. Expressed as a numerical value “times”. Higher PE’s are often taken to mean that the firm has significant prospects for future growth and will be a good investment for profit maximization.
  • 19.
    Macy’s Ratio AnalysisDebt Ratios Equity Multiplier is Total Assets/Total Equity 2008 - 2.85 times 2007 - 2.41 times 2006 - 2.45 times 2005 - 2.41 times 2004 - 2.45 times Debt-Equity Ratio is Total debt/total equity 2008 - 1.85 times 2007 - 1.41 times 2006- 1.45 times 2005 - 1.41 times 2004 - 1.45 times Analysis Long-term solvency ratios are intended to address the firm’s long-run ability to meet is obligations, or its financial leverage. These ratios tell you how much debt Macy's has compared to its total equity.
  • 20.
    Macy’s Trend AnalysisShort-Term Solvency/Liquidity Measures *Figures expressed in millions 2004 2005 2006 2007 2008 Current Ratio Current Assets 7452 7510 10145 7422 6324 Current Liabilities 3883 4301 7590 6095 5360 2004 2005 2006 2007 2008 Current Ratio = Current Assets/Current Liabilities 1.92 1.75 1.34 1.22 1.18 Quick Ratio 2004 2005 2006 2007 2008 Current Assets 7452.00 7510.00 10145.00 7422.00 6324.00 Inventory 3215.00 3120.00 5459.00 5317.00 5060.00 Current Liabilities 3883.00 4301.00 7590.00 6095.00 5360.00 2004 2005 2006 2007 2008 Quick Ratio = (Current Assets - Inventory)/Current Liabilities 1.09 1.02 0.62 0.35 0.24
  • 21.
  • 22.
    Macy’s Trend AnalysisLong Term Solvency Total Debt Ratio Measure *Figures expressed in millions 2004 2005 2006 2007 2008 Total Assets 14550 14885 33168 29550 27789 Total Equity 5940 6167 13519 12254 9907 2004 2005 2006 2007 2008 Total Debt Ratio = (Total Assets - Total Equity)/ Total Assets 0.59 0.59 0.59 0.59 0.64
  • 23.
    Macy’s Trend AnalysisTotal Debt Ratio
  • 24.
    Macy’s Trend Analysis Profitability Return On Equity Measure *Figures expressed in millions 2004 2005 2006 2007 2008 Net Income 693 689 1406 995 893 Total Equity 5940 6167 13519 12254 9907 2004 2005 2006 2007 2008 Return on Equity = Net Income/Total Equity 0.12 0.11 0.10 0.08 0.09
  • 25.
    Macy’s Trend AnalysisReturn On Equity
  • 26.
    Macy’s Future FinancialPerformance Projection Steady Sales From Past to 2007 Promise a Somewhat Hopeful Financial Future for Macy’s; 2004 Yearly Sales in Millions; $14,441 2005 Yearly Sales in Millions; $22,390 2006 Yearly Sales in Millions; $ 26,970 2007 Yearly Sales in Millions; $26,313  2008; Quarterly Sales continue to be financially acceptable in year-to-date cash flows, which is stronger than anticipated at the beginning of the year due to a faltering economy from 2007-present.
  • 27.
    Macy’s Future FinancialPerformance Projection With the current economic worries, Macy’s executives have predicted that the company’s future financial performance will decline relative to the 2007 financial year. Macy’s has thus reduced their capital-spending forecast from the 1 billion to around 600 million. Sales decreased noticeably as of October 2008 this due to; job loss rising gas prices limited incomes increasing marginal and average propensity to save and limiting marginal and average propensity to consume.
  • 28.
    Macy’s Future FinancialPerformance Projection Macy's third quarter sales have reduced relative to second quarter data. The 2008 holiday season is highly relied upon to bring the firms sales up to predicted amounts. Marketing and retailing advertisements stared just after Halloween to secure Macy’s in consumers holiday thoughts and shopping lists. Overall Macy’s will be a great investment if 2004-2006 sales momentum can once again be achieved, otherwise Macy’s has its work cut out for it.