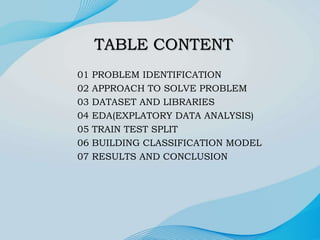
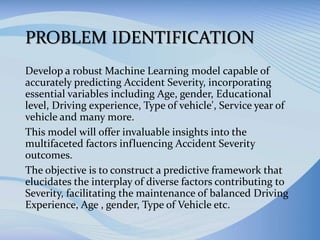
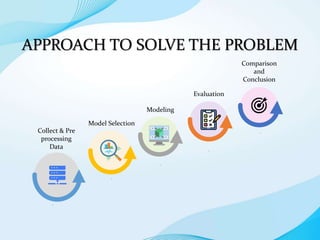
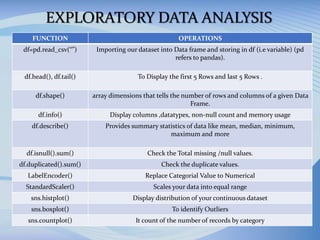
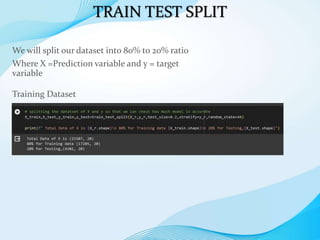
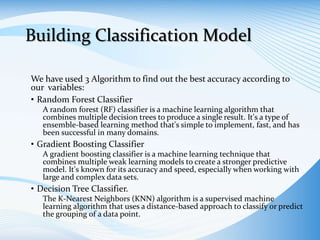
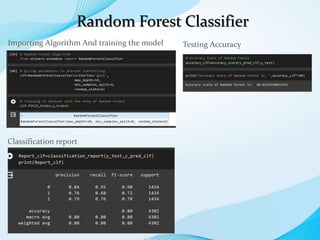
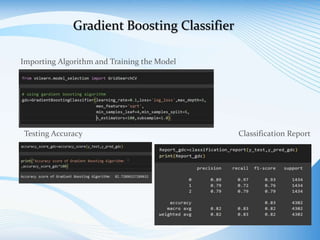
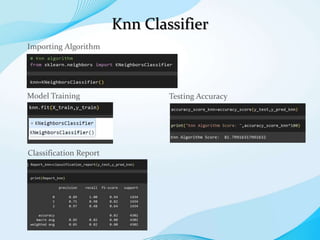
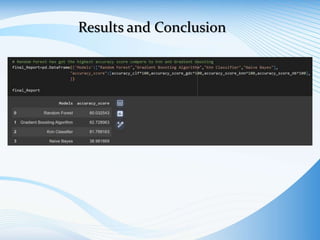
Accident
Severity
Prediction
TABLE CONTENT
01 PROBLEM IDENTIFICATION
02 APPROACH TO SOLVE PROBLEM
03 DATASET AND LIBRARIES
04 EDA(EXPLATORY DATA ANALYSIS)
05 TRAIN TEST SPLIT
06 BUILDING CLASSIFICATION MODEL
07 RESULTS AND CONCLUSION
PROBLEM IDENTIFICATION
Develop a robust Machine Learning model capable of
accurately predicting Accident Severity, incorporating
essential variables including Age, gender, Educational
level, Driving experience, Type of vehicle', Service year of
vehicle and many more.
This model will offer invaluable insights into the
multifaceted factors influencing Accident Severity
outcomes.
The objective is to construct a predictive framework that
elucidates the interplay of diverse factors contributing to
Severity, facilitating the maintenance of balanced Driving
Experience, Age , gender, Type of Vehicle etc.
APPROACH TO SOLVE THE PROBLEM
Comparison
and
Conclusion
.
Evaluation
.
Modeling
.
Model Selection
.
Collect & Pre
processing
Data
.
Dataset and Libraries
Data Set Information:
Age: The age of the individual expressed in years.
Gender: Gender of individual categorized as male or
female.
Days of week: Total days in a week.
Education: How much person is educated.
Driving experience: Experience of person who is
driving.
Type of Vehicle: Vehicle is Government , private or
other
Service year: how much year vehicle has insurance
service.
Cause of accident: How accident happen.
Accident severity: the person is serious injury, fatal
injury, slight injury
Libraries:
Pandas: To Process the data as the data
was in CSV format
Matplotlib and Seaborn : It is
commonly used for data visualization
and creating various types of charts and
plots
Scikit-learn: Scikit-Learn, also known
as Sklearn is a python library to
implement machine learning models
and statistical modelling
EXPLORATORY DATA ANALYSIS
FUNCTION OPERATIONS
df=pd.read_csv(“”) Importing our dataset into Data frame and storing in df (i.e variable) (pd
refers to pandas).
df.head(), df.tail() To Display the first 5 Rows and last 5 Rows .
df.shape() array dimensions that tells the number of rows and columns of a given Data
Frame.
df.info() Display columns ,datatypes, non-null count and memory usage
df.describe() Provides summary statistics of data like mean, median, minimum,
maximum and more
df.isnull().sum() Check the Total missing /null values.
df.duplicated().sum() Check the duplicate values.
LabelEncoder() Replace Categorial Value to Numerical
StandardScaler() Scales your data into equal range
sns.histplot() Display distribution of your continuous dataset
sns.boxplot() To identify Outliers
sns.countplot() It count of the number of records by category
TRAIN TEST SPLIT
We will split our dataset into 80% to 20% ratio
Where X =Prediction variable and y = target
variable
Training Dataset
Building Classification Model
We have used 3 Algorithm to find out the best accuracy according to
our variables:
• Random Forest Classifier
A random forest (RF) classifier is a machine learning algorithm that
combines multiple decision trees to produce a single result. It's a type of
ensemble-based learning method that's simple to implement, fast, and has
been successful in many domains.
• Gradient Boosting Classifier
A gradient boosting classifier is a machine learning technique that
combines multiple weak learning models to create a stronger predictive
model. It's known for its accuracy and speed, especially when working with
large and complex data sets.
• Decision Tree Classifier.
The K-Nearest Neighbors (KNN) algorithm is a supervised machine
learning algorithm that uses a distance-based approach to classify or predict
the grouping of a data point.
Random Forest Classifier
.
.
Importing Algorithm And training the model Testing Accuracy
Classification report
Gradient Boosting Classifier
Testing Accuracy Classification Report
Importing Algorithm and Training the Model
Knn Classifier
Testing Accuracy
Classification Report
Importing Algorithm
Model Training
Results and Conclusion
Thank You!!

Machine Learning for Accident Severity Prediction

  • 1.
  • 2.
    TABLE CONTENT 01 PROBLEMIDENTIFICATION 02 APPROACH TO SOLVE PROBLEM 03 DATASET AND LIBRARIES 04 EDA(EXPLATORY DATA ANALYSIS) 05 TRAIN TEST SPLIT 06 BUILDING CLASSIFICATION MODEL 07 RESULTS AND CONCLUSION
  • 3.
    PROBLEM IDENTIFICATION Develop arobust Machine Learning model capable of accurately predicting Accident Severity, incorporating essential variables including Age, gender, Educational level, Driving experience, Type of vehicle', Service year of vehicle and many more. This model will offer invaluable insights into the multifaceted factors influencing Accident Severity outcomes. The objective is to construct a predictive framework that elucidates the interplay of diverse factors contributing to Severity, facilitating the maintenance of balanced Driving Experience, Age , gender, Type of Vehicle etc.
  • 4.
    APPROACH TO SOLVETHE PROBLEM Comparison and Conclusion . Evaluation . Modeling . Model Selection . Collect & Pre processing Data .
  • 5.
    Dataset and Libraries DataSet Information: Age: The age of the individual expressed in years. Gender: Gender of individual categorized as male or female. Days of week: Total days in a week. Education: How much person is educated. Driving experience: Experience of person who is driving. Type of Vehicle: Vehicle is Government , private or other Service year: how much year vehicle has insurance service. Cause of accident: How accident happen. Accident severity: the person is serious injury, fatal injury, slight injury Libraries: Pandas: To Process the data as the data was in CSV format Matplotlib and Seaborn : It is commonly used for data visualization and creating various types of charts and plots Scikit-learn: Scikit-Learn, also known as Sklearn is a python library to implement machine learning models and statistical modelling
  • 6.
    EXPLORATORY DATA ANALYSIS FUNCTIONOPERATIONS df=pd.read_csv(“”) Importing our dataset into Data frame and storing in df (i.e variable) (pd refers to pandas). df.head(), df.tail() To Display the first 5 Rows and last 5 Rows . df.shape() array dimensions that tells the number of rows and columns of a given Data Frame. df.info() Display columns ,datatypes, non-null count and memory usage df.describe() Provides summary statistics of data like mean, median, minimum, maximum and more df.isnull().sum() Check the Total missing /null values. df.duplicated().sum() Check the duplicate values. LabelEncoder() Replace Categorial Value to Numerical StandardScaler() Scales your data into equal range sns.histplot() Display distribution of your continuous dataset sns.boxplot() To identify Outliers sns.countplot() It count of the number of records by category
  • 7.
    TRAIN TEST SPLIT Wewill split our dataset into 80% to 20% ratio Where X =Prediction variable and y = target variable Training Dataset
  • 8.
    Building Classification Model Wehave used 3 Algorithm to find out the best accuracy according to our variables: • Random Forest Classifier A random forest (RF) classifier is a machine learning algorithm that combines multiple decision trees to produce a single result. It's a type of ensemble-based learning method that's simple to implement, fast, and has been successful in many domains. • Gradient Boosting Classifier A gradient boosting classifier is a machine learning technique that combines multiple weak learning models to create a stronger predictive model. It's known for its accuracy and speed, especially when working with large and complex data sets. • Decision Tree Classifier. The K-Nearest Neighbors (KNN) algorithm is a supervised machine learning algorithm that uses a distance-based approach to classify or predict the grouping of a data point.
  • 9.
    Random Forest Classifier . . ImportingAlgorithm And training the model Testing Accuracy Classification report
  • 10.
    Gradient Boosting Classifier TestingAccuracy Classification Report Importing Algorithm and Training the Model
  • 11.
    Knn Classifier Testing Accuracy ClassificationReport Importing Algorithm Model Training
  • 12.
  • 13.