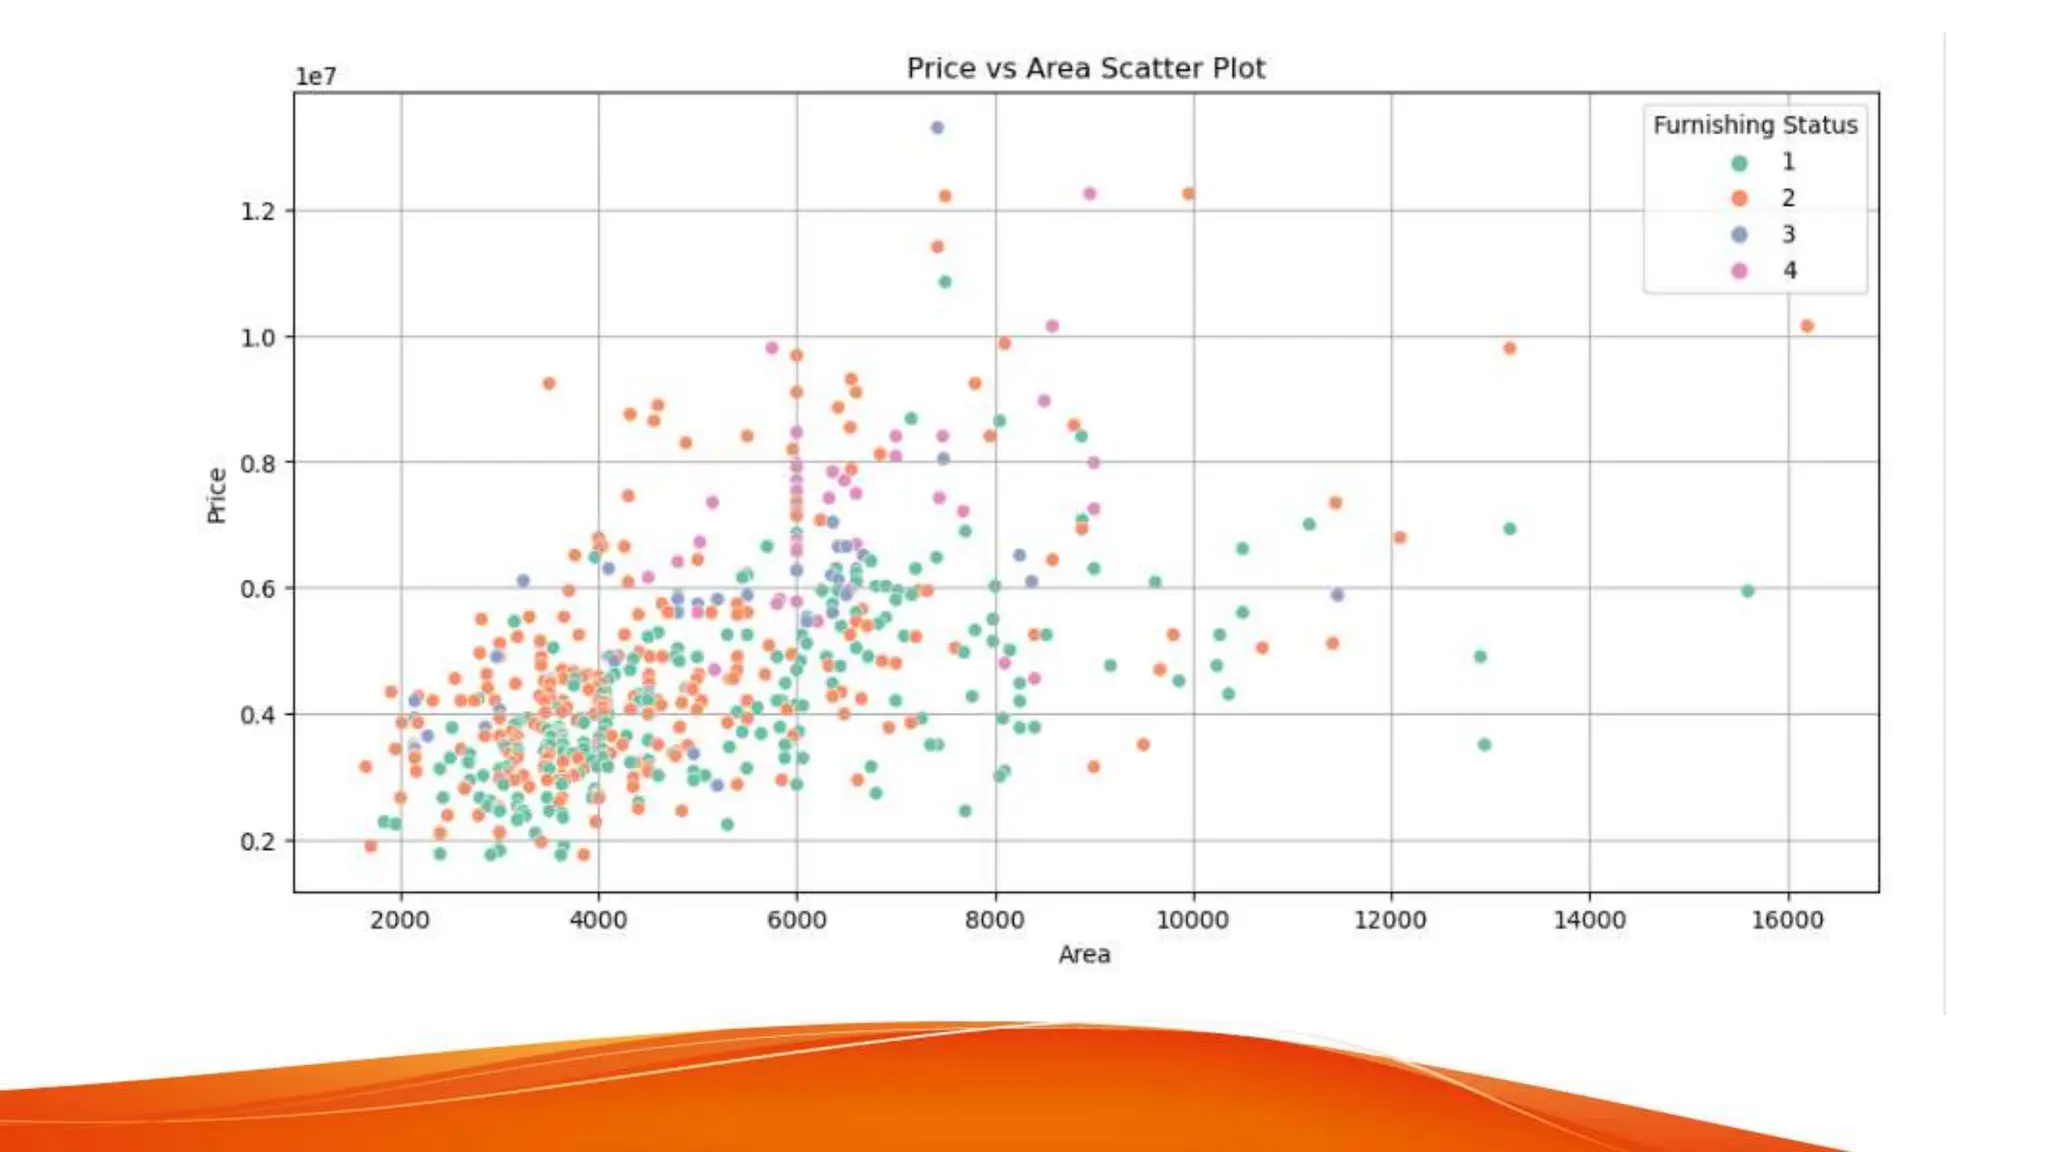
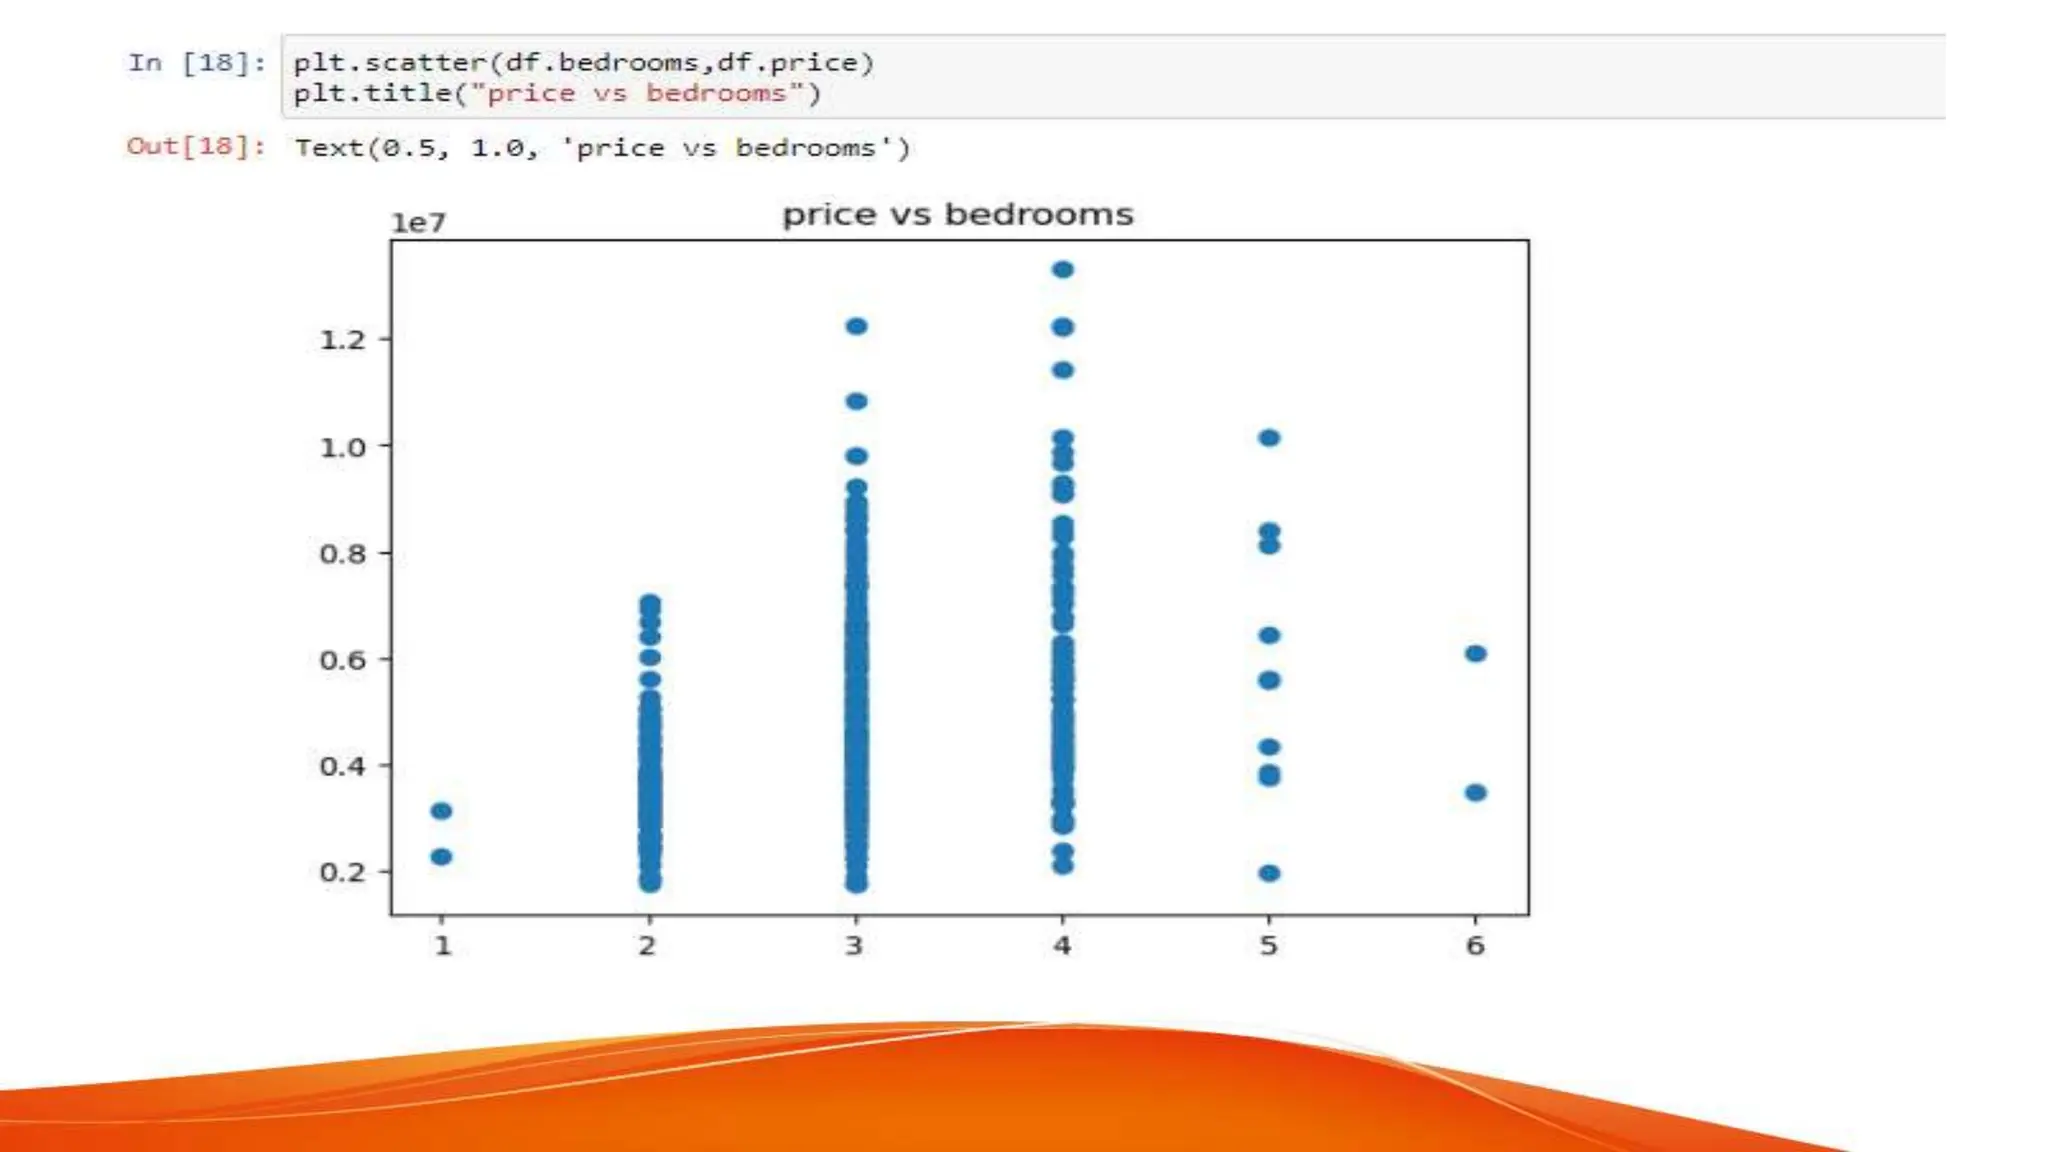
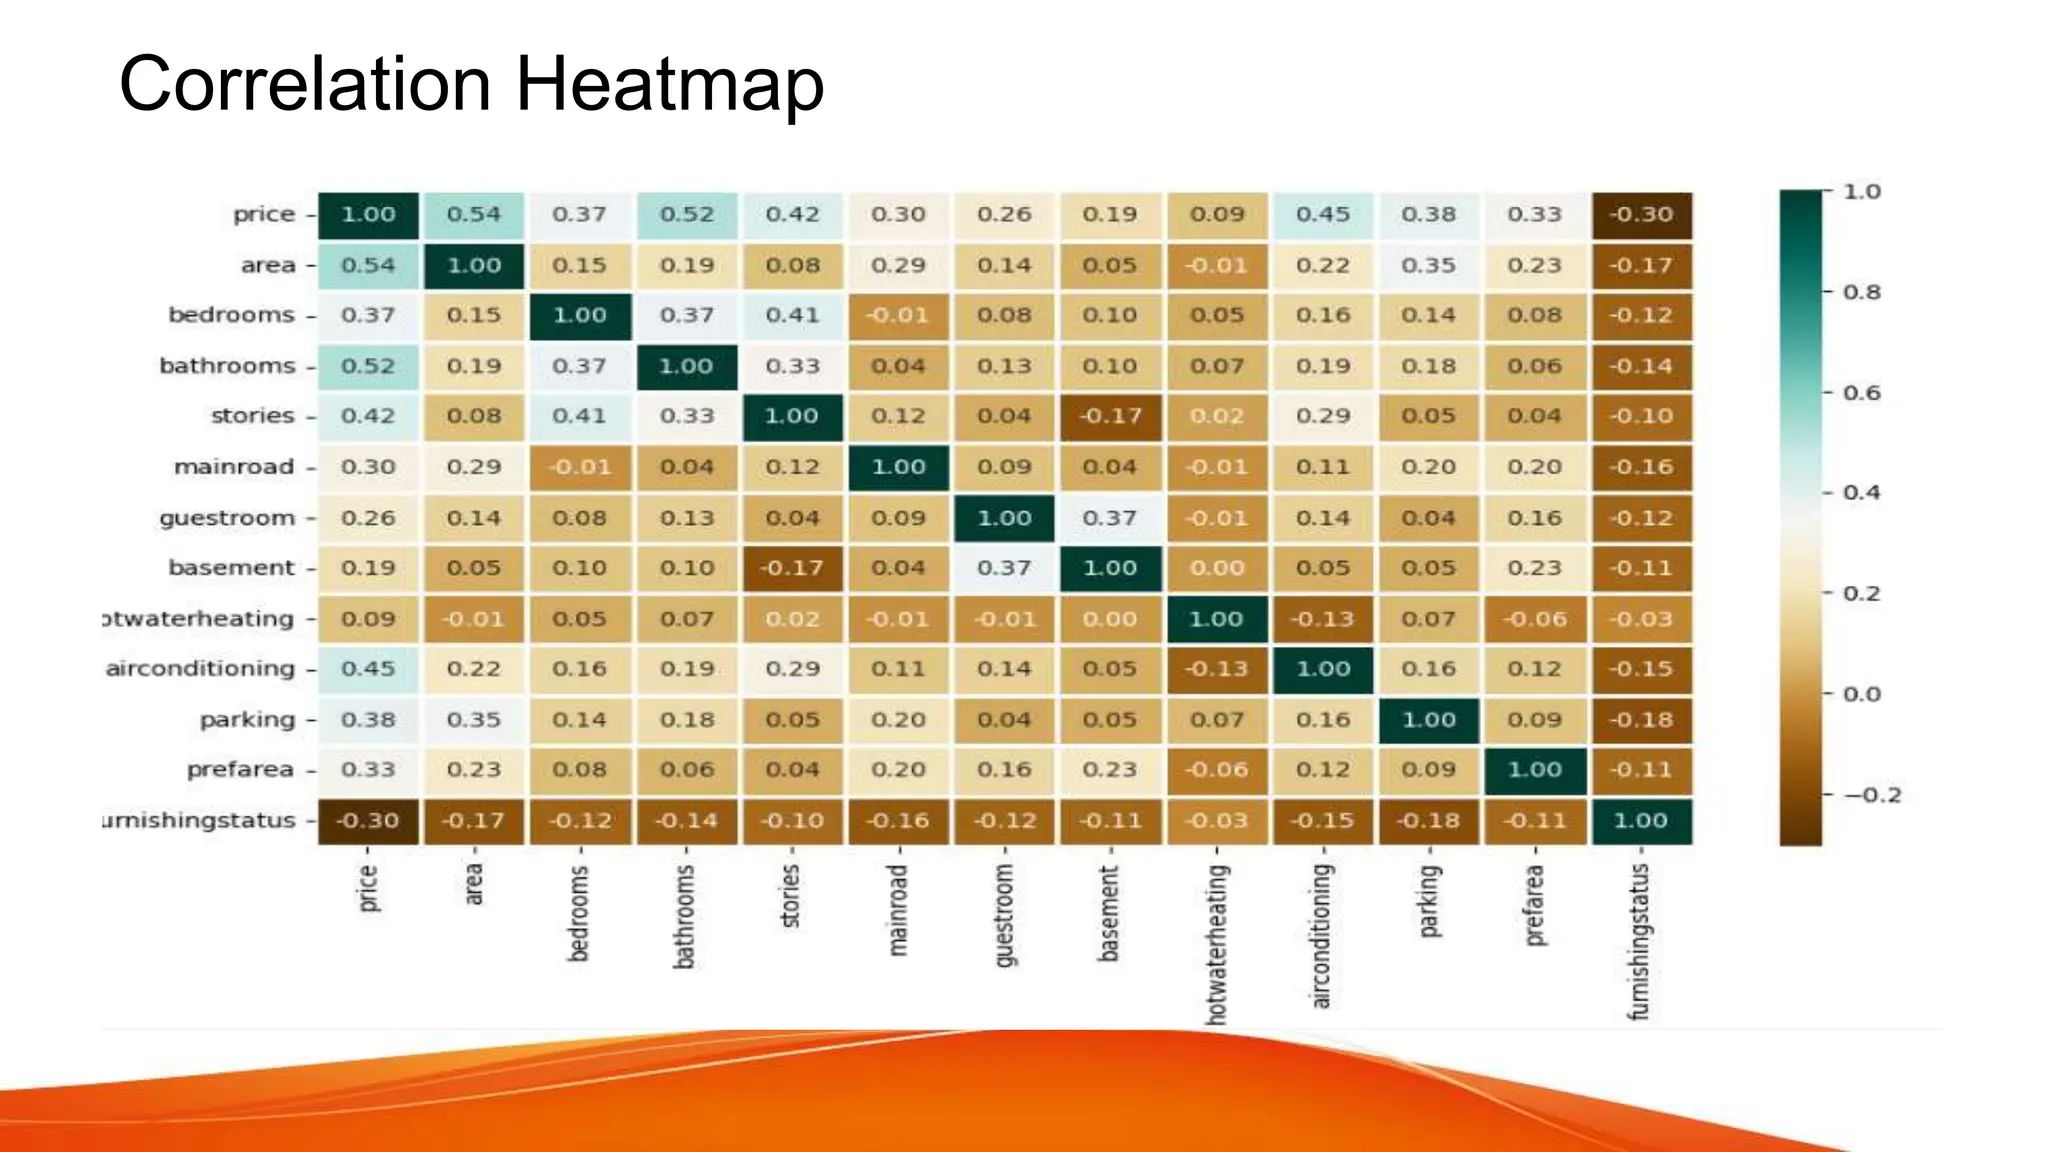
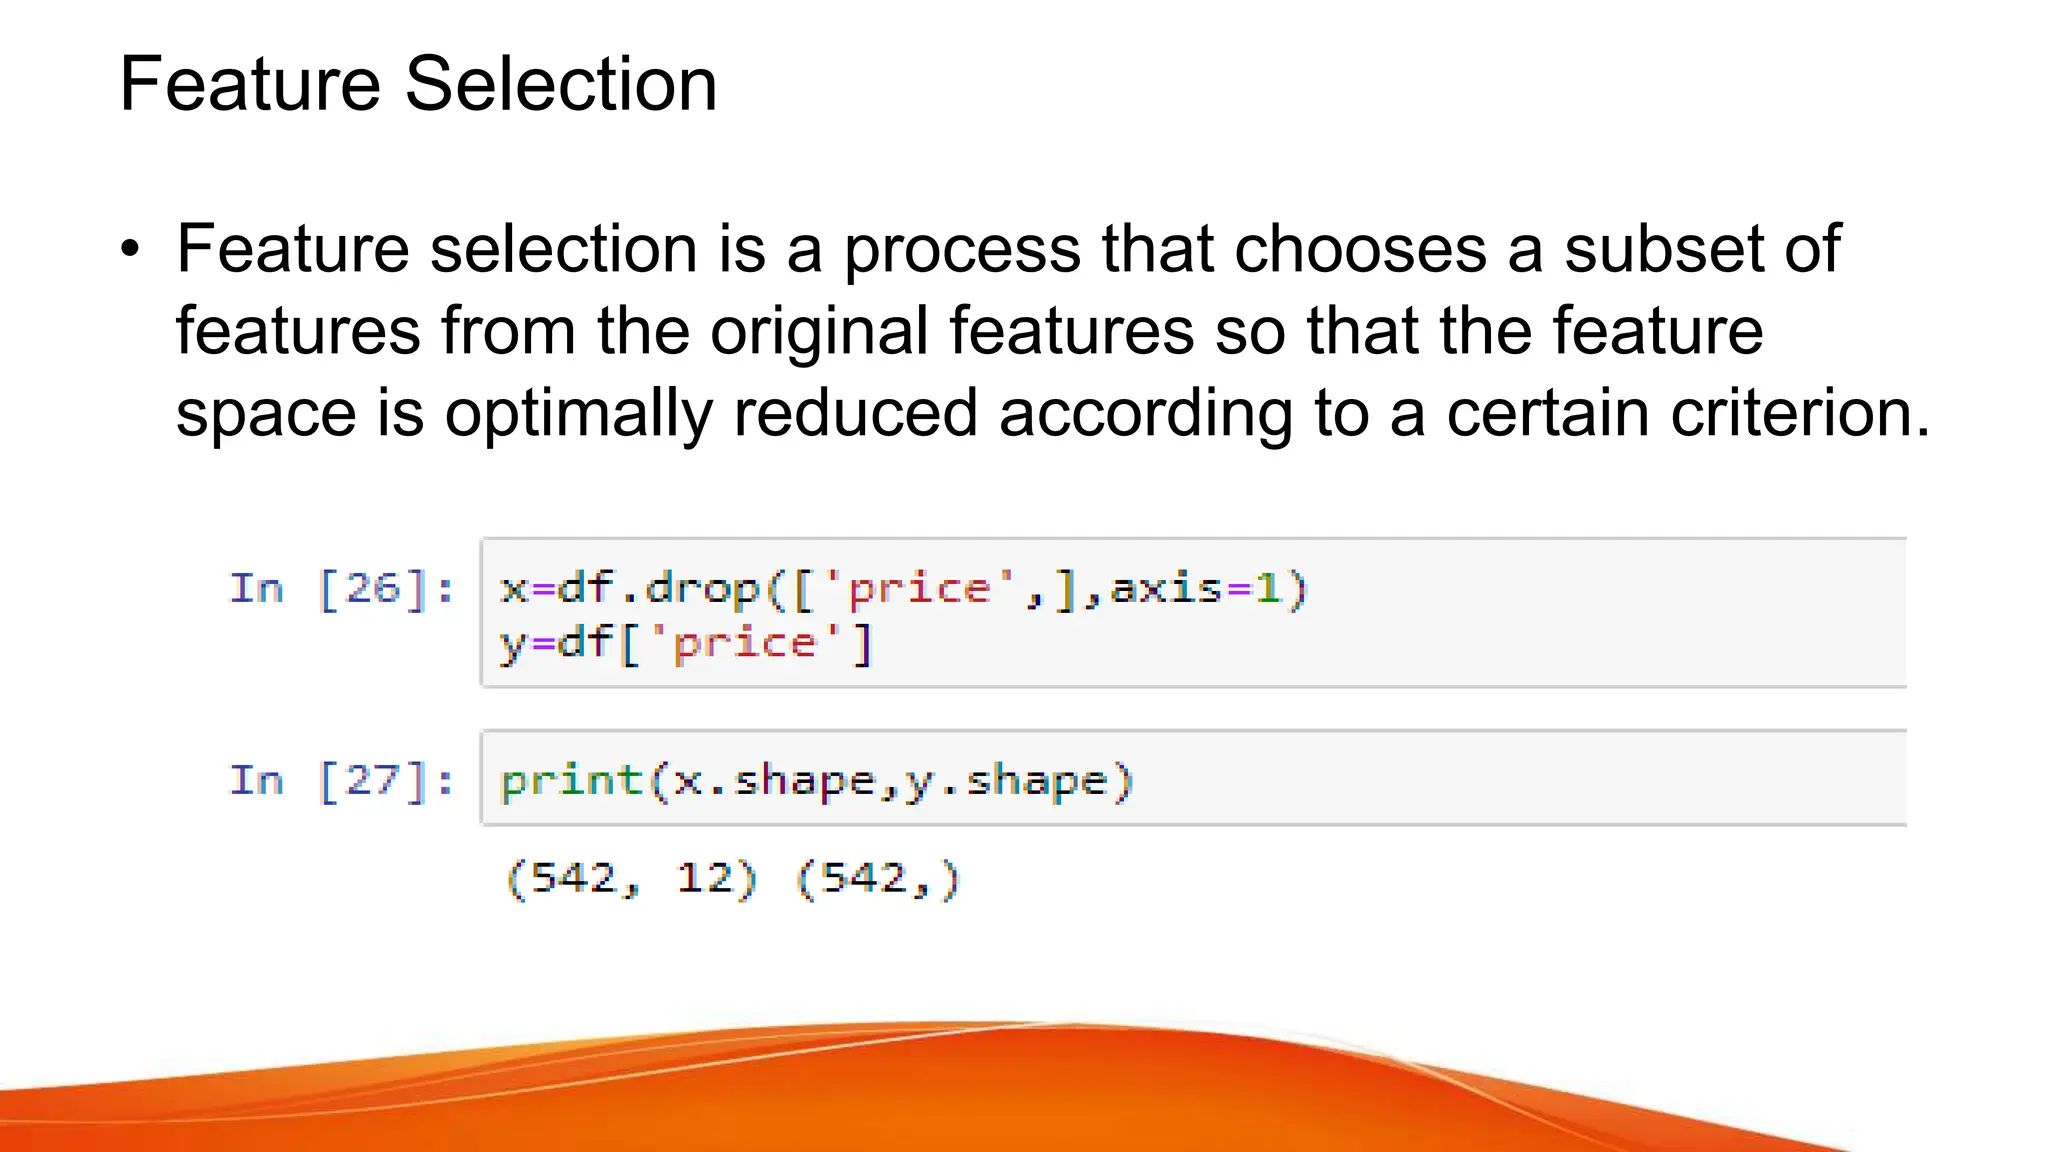
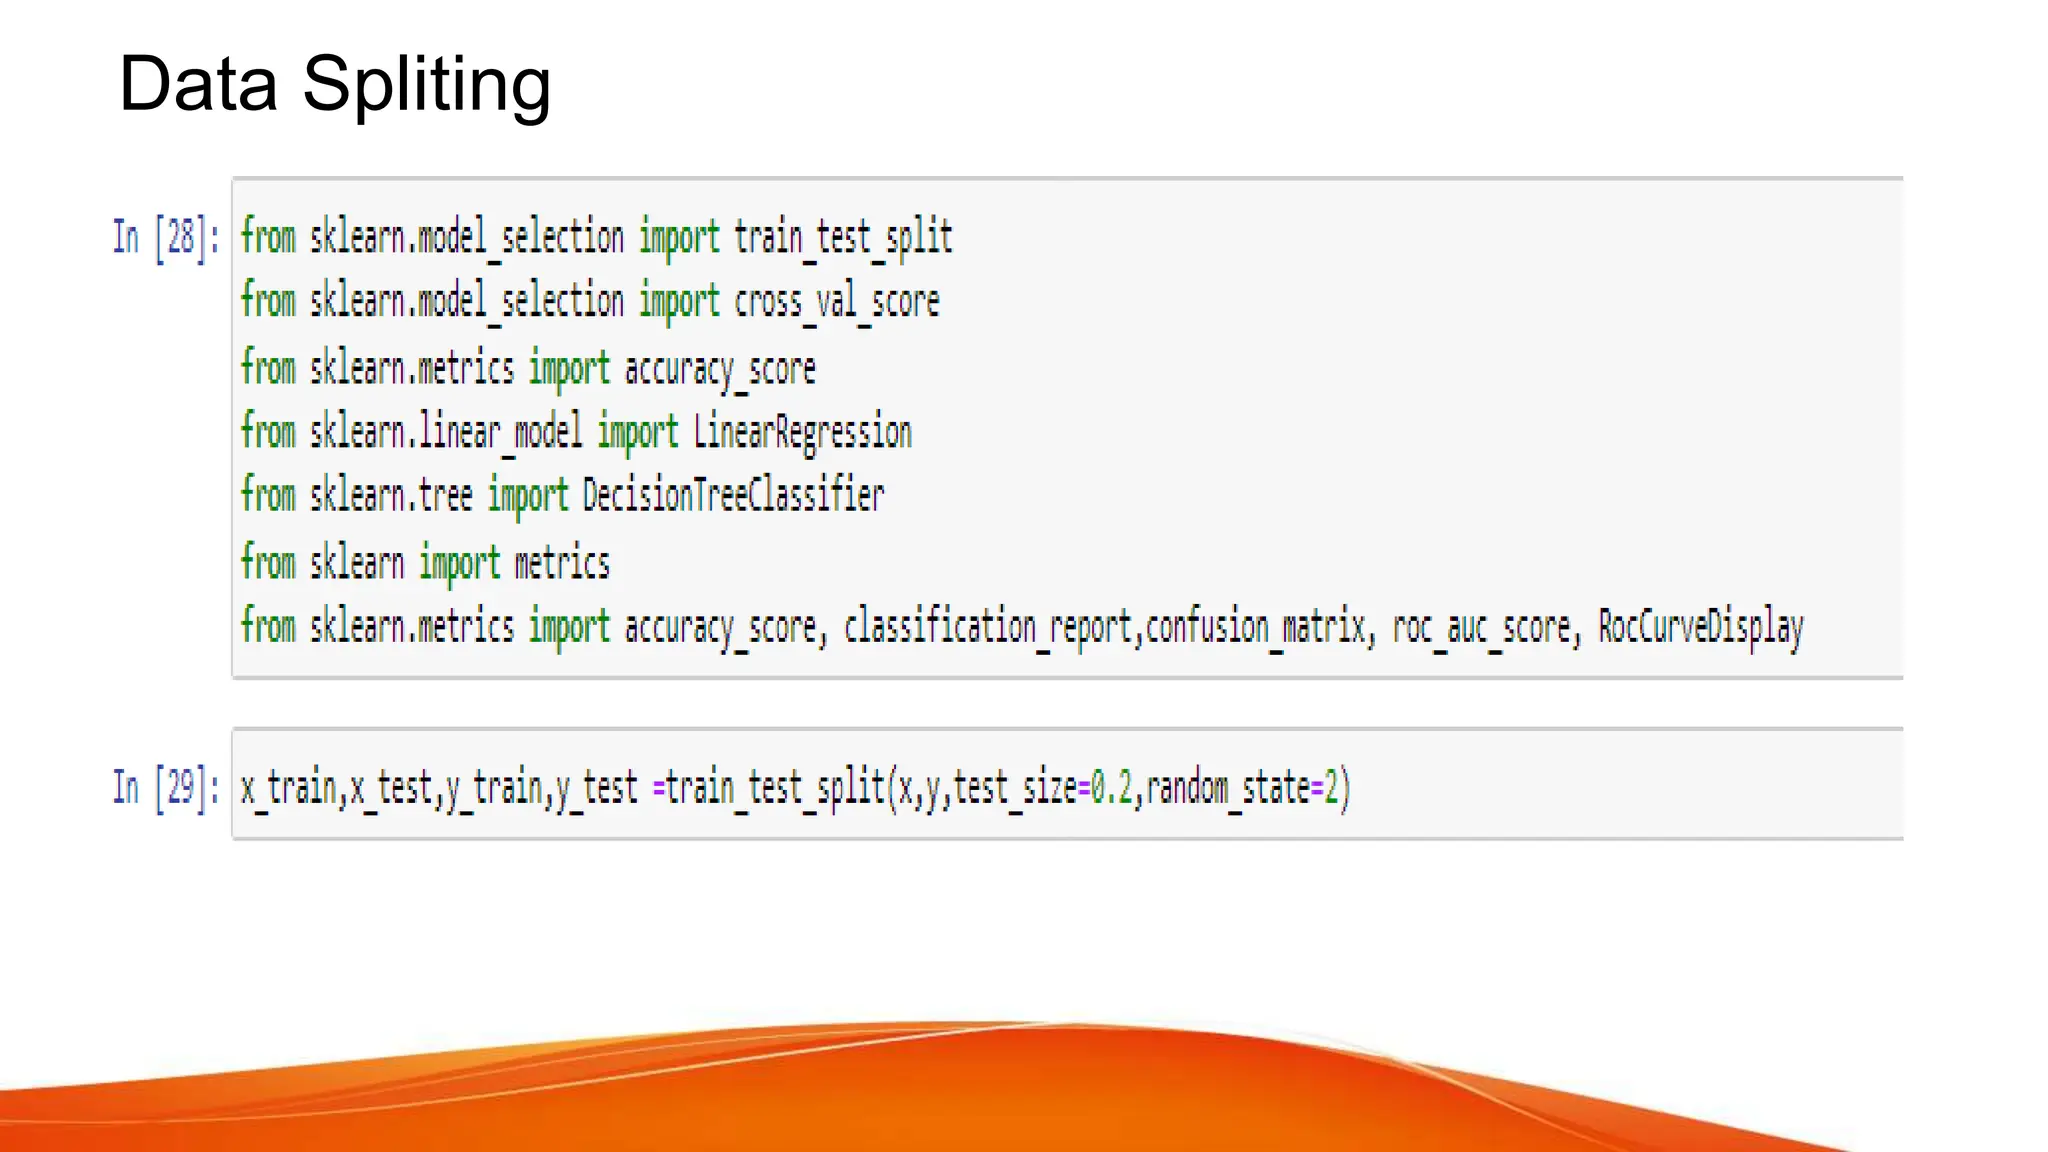
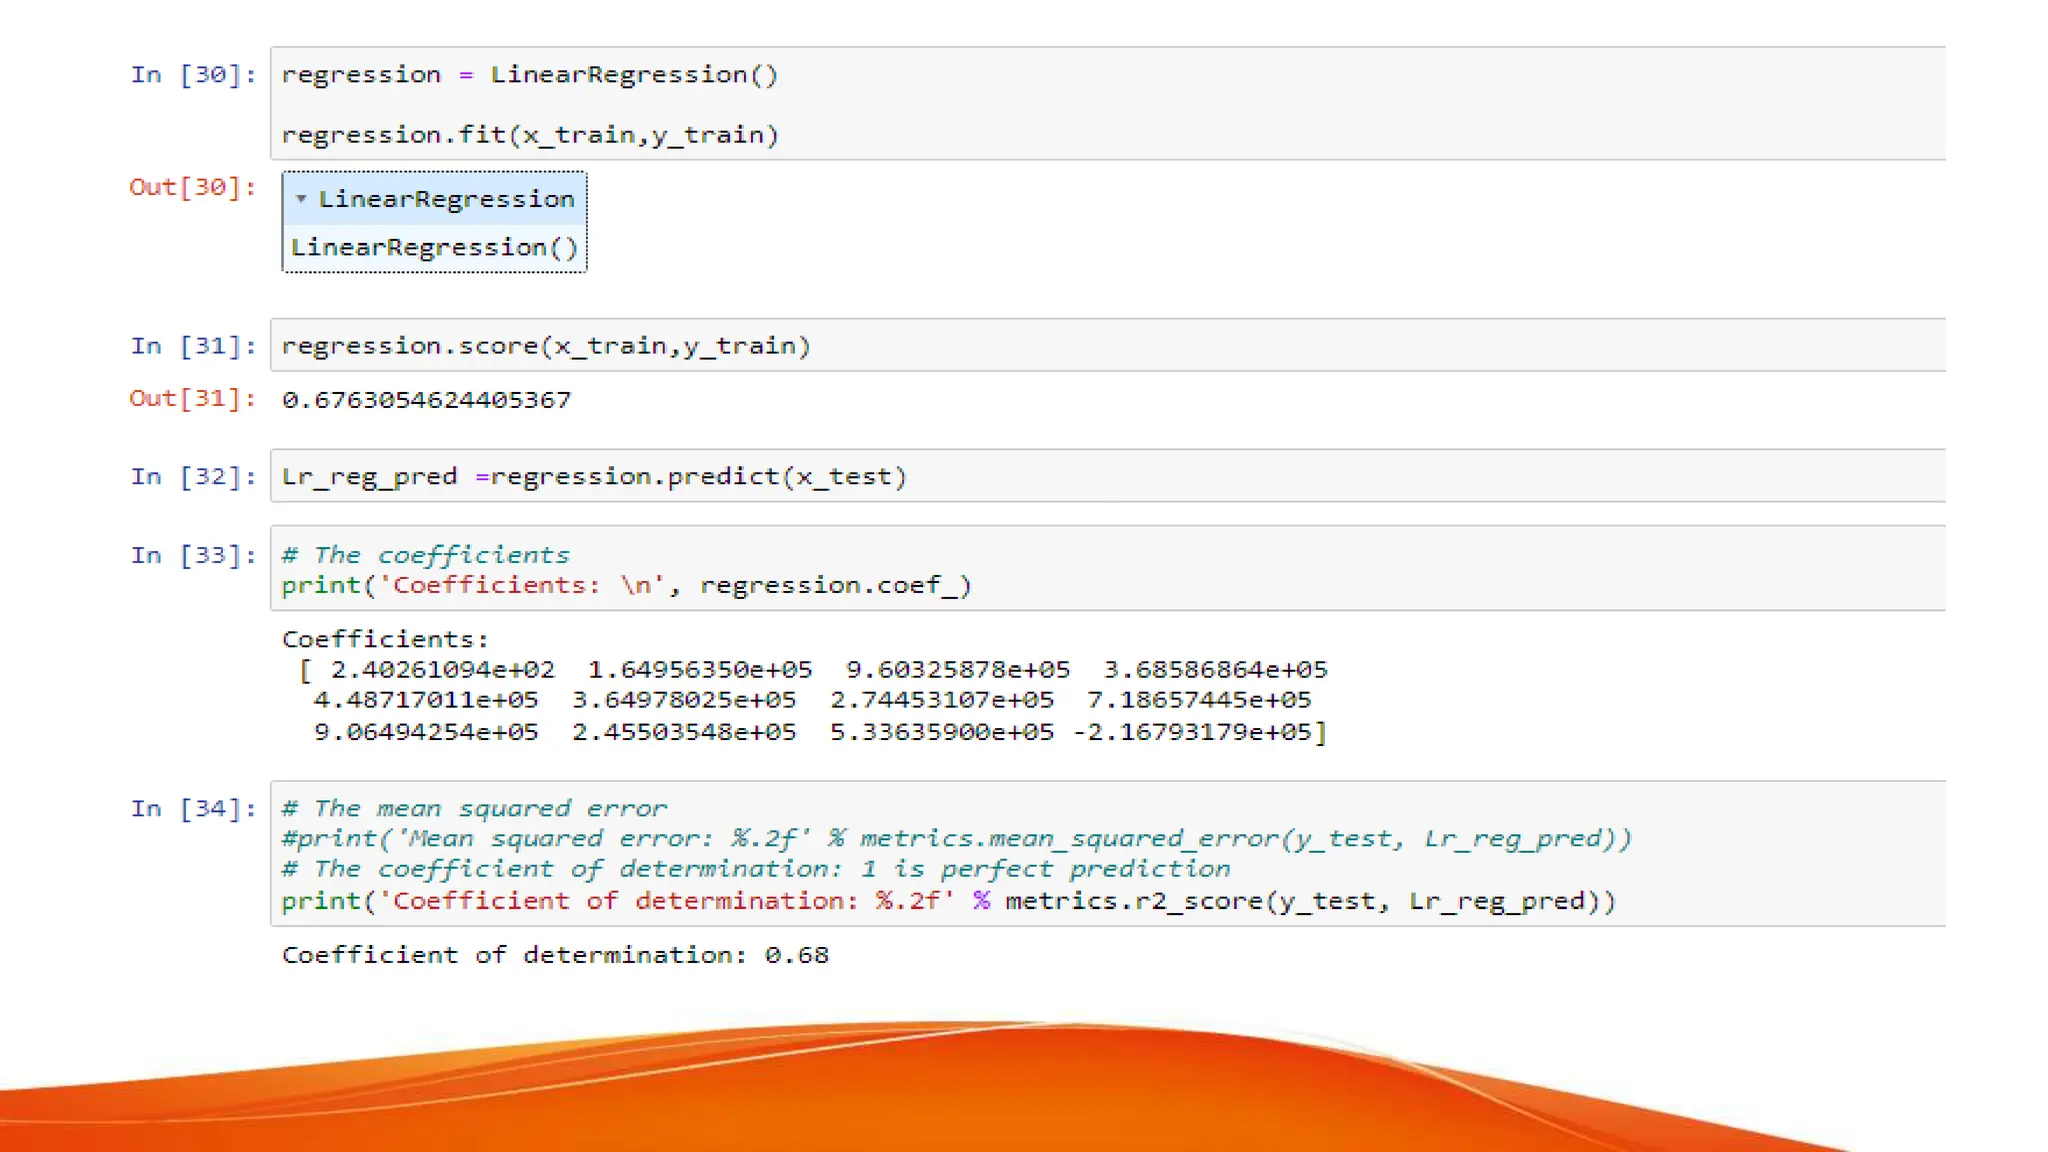
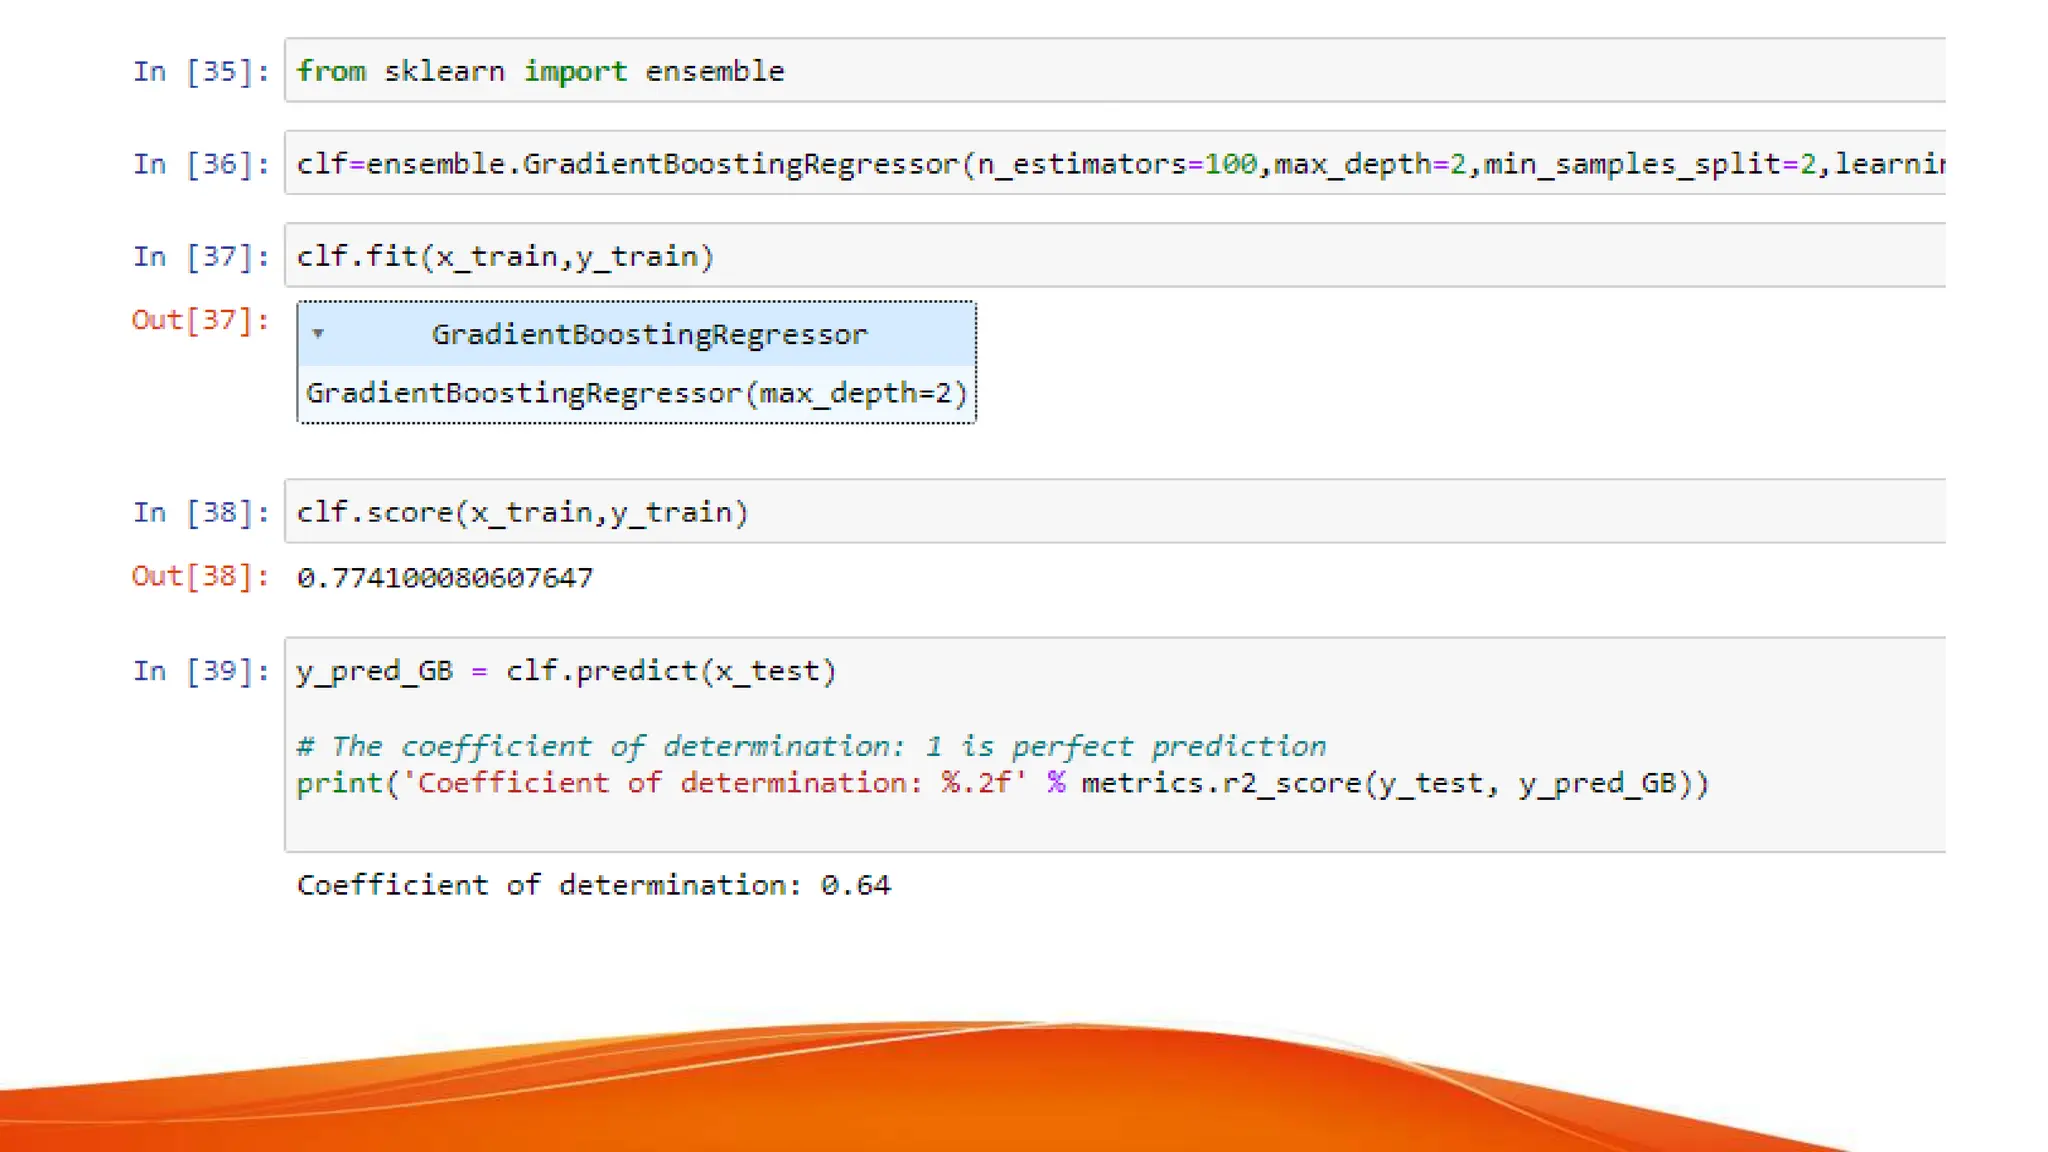
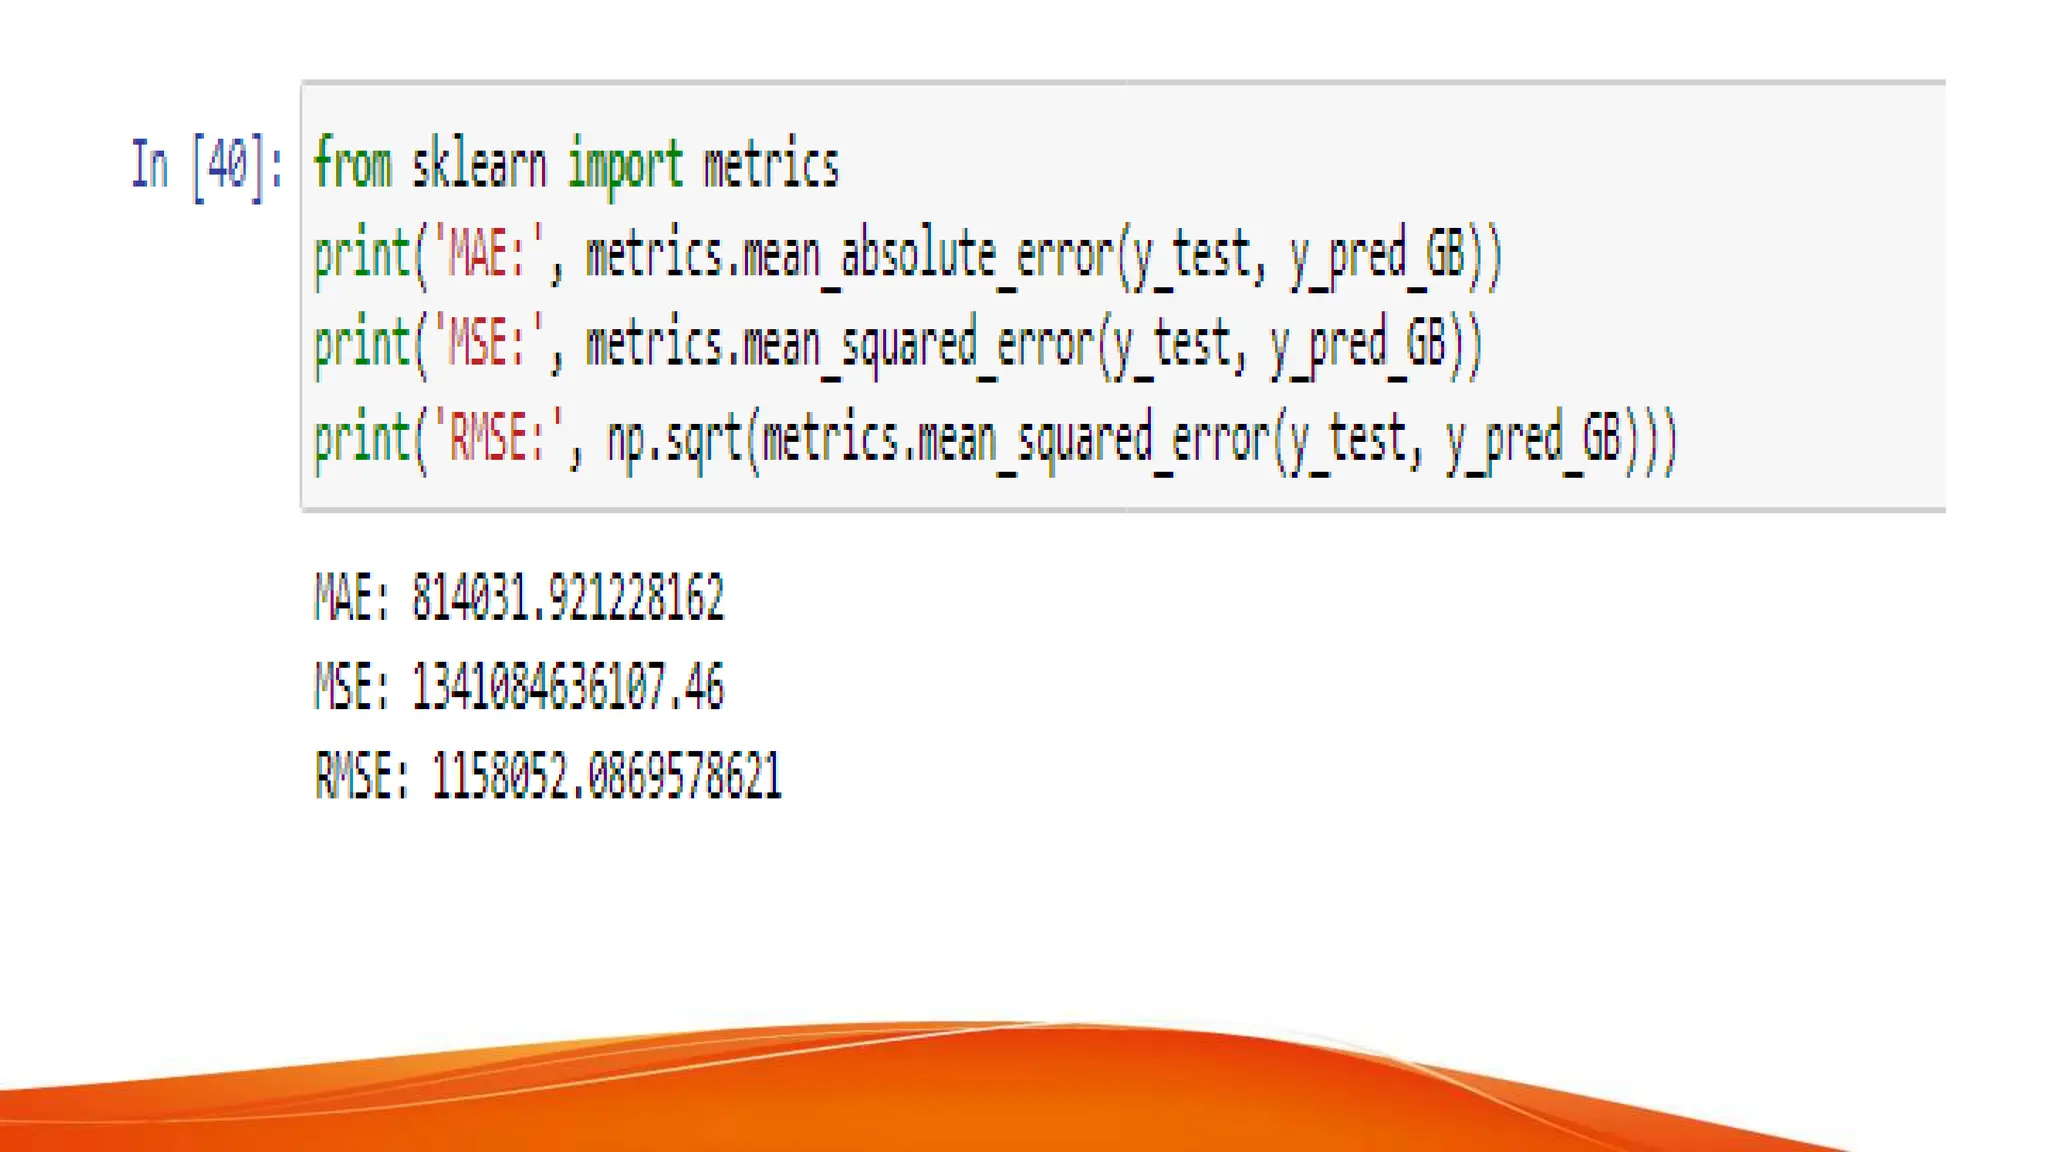
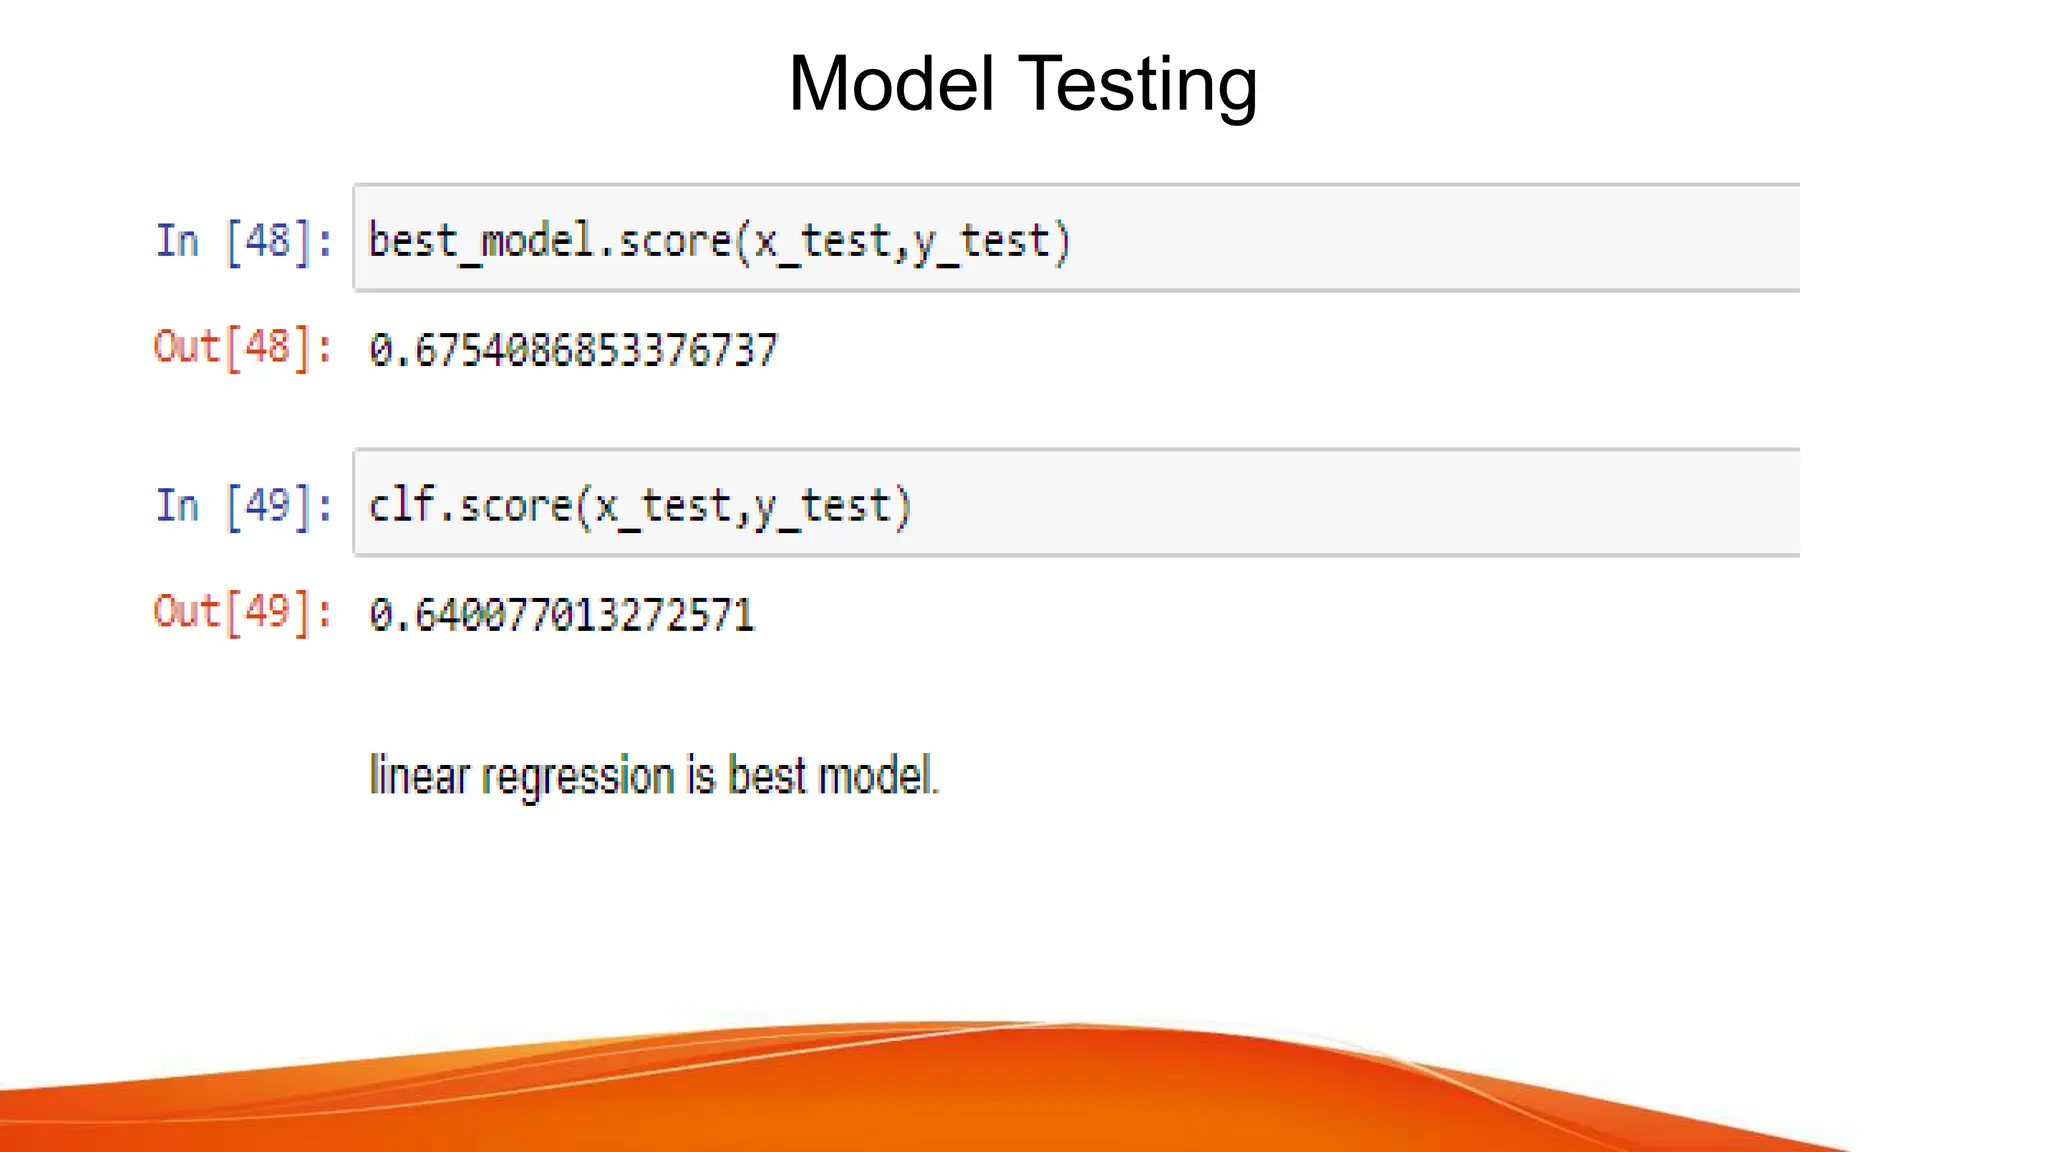
House Price Prediction
By, Saurabh Jadhav
Abstract
• House price forecasting is an important topic of real
estate. The literature attempts to derive useful knowledge
from historical data of property markets. Machine learning
techniques are applied to analyze historical property
transactions in India to discover useful models for house
buyers and sellers.Moreover, experiments demonstrate
that the Multiple Linear Regression that is based on mean
squared error measurement is a competitive approach.
Aim
• These are the Parameters on which we will evaluate
ourselves-
• Create an effective price prediction model
• Validate the model’s prediction accuracy
• Identify the important home price attributes which feed the
model’s predictive power.
Data Selection
Data selection is defined as the process of determining the
appropriate data type and source, as well as suitable
instruments to collect data. Data selection precedes the
actual practice of data collection.
Data visualization
• Data visualization is the graphical representation of
information and data. By using visual elements like charts,
graphs, and maps, data visualization tools provide an
accessible way to see and understand trends, outliers,
and patterns in data. In the world of Big Data, data
visualization tools and technologies are essential to
analyse massive amounts of information and make data-
driven decisions.
Exploratory Data Analysis
• refers to the deep analysis of data so as to discover
different patterns and spot anomalies. Before making
inferences from data it is essential to examine all your
variables.we can infer from above describe function
thatthe dataset has a house where the house has 6
bedrooms , seems to be a massive house and would be
interesting to know more about it as we progress.
Maximum square feet is 16200 where as the minimum is
1650. we can see that the data is distributed.
Correlation Heatmap
Feature Selection
• Feature selection is a process that chooses a subset of
features from the original features so that the feature
space is optimally reduced according to a certain criterion.
Data Spliting
Model Selection
Linear Regression
• Linear Regression is a machine learning algorithm based
on supervised learning.
• It performs a regression task. Regression models a target
prediction value based on
independent variables.
• It is mostly used for finding out the relationship between
variables and forecasting
Gradient Boosting
• Gradient Boosting is a powerful boosting algorithm that combines
several weak learners into strong learners, in which each new
model is trained to minimize the loss function such as mean
squared error or cross-entropy of the previous model using
gradient descent. In each iteration, the algorithm computes the
gradient of the loss function with respect to the predictions of the
current ensemble and then trains a new weak model to minimize
this gradient. The predictions of the new model are then added to
the ensemble, and the process is repeated until a stopping
criterion is met.
2. Evaluation Metrics:
• Regression metrics are quantitative measures used to evaluate the nice of a
regression model. Scikit-analyze provides several metrics, each with its own
strengths and boundaries, to assess how well a model suits the statistics.
• Types of Regression Metrics
• Some common regression metrics in scikit-learn with examples
• Mean Absolute Error (MAE)
• Mean Squared Error (MSE)
• R-squared (R²) Score
• Root Mean Squared Error (RMSE)
Model Testing
Conclusion
So we conclude that the system that we proposed solves most of
the problems that we have with the existing system.After training
and testing of datasets with all models, the linear regression
performs better than gradient boost regressor model. The highest
accuracy score is achieved by the linear regression. So, we suggest
that this regression model be used for future house price
predictions. Therefore, the outcome of our project will be
predicting house prices with good accuracy which can help the
customer as well as developer.

Predicting House Prices: A Machine Learning Approach

  • 1.
  • 2.
    Abstract • House priceforecasting is an important topic of real estate. The literature attempts to derive useful knowledge from historical data of property markets. Machine learning techniques are applied to analyze historical property transactions in India to discover useful models for house buyers and sellers.Moreover, experiments demonstrate that the Multiple Linear Regression that is based on mean squared error measurement is a competitive approach.
  • 3.
    Aim • These arethe Parameters on which we will evaluate ourselves- • Create an effective price prediction model • Validate the model’s prediction accuracy • Identify the important home price attributes which feed the model’s predictive power.
  • 4.
    Data Selection Data selectionis defined as the process of determining the appropriate data type and source, as well as suitable instruments to collect data. Data selection precedes the actual practice of data collection.
  • 6.
    Data visualization • Datavisualization is the graphical representation of information and data. By using visual elements like charts, graphs, and maps, data visualization tools provide an accessible way to see and understand trends, outliers, and patterns in data. In the world of Big Data, data visualization tools and technologies are essential to analyse massive amounts of information and make data- driven decisions.
  • 7.
    Exploratory Data Analysis •refers to the deep analysis of data so as to discover different patterns and spot anomalies. Before making inferences from data it is essential to examine all your variables.we can infer from above describe function thatthe dataset has a house where the house has 6 bedrooms , seems to be a massive house and would be interesting to know more about it as we progress. Maximum square feet is 16200 where as the minimum is 1650. we can see that the data is distributed.
  • 12.
  • 13.
    Feature Selection • Featureselection is a process that chooses a subset of features from the original features so that the feature space is optimally reduced according to a certain criterion.
  • 14.
  • 15.
    Model Selection Linear Regression •Linear Regression is a machine learning algorithm based on supervised learning. • It performs a regression task. Regression models a target prediction value based on independent variables. • It is mostly used for finding out the relationship between variables and forecasting
  • 17.
    Gradient Boosting • GradientBoosting is a powerful boosting algorithm that combines several weak learners into strong learners, in which each new model is trained to minimize the loss function such as mean squared error or cross-entropy of the previous model using gradient descent. In each iteration, the algorithm computes the gradient of the loss function with respect to the predictions of the current ensemble and then trains a new weak model to minimize this gradient. The predictions of the new model are then added to the ensemble, and the process is repeated until a stopping criterion is met.
  • 19.
    2. Evaluation Metrics: •Regression metrics are quantitative measures used to evaluate the nice of a regression model. Scikit-analyze provides several metrics, each with its own strengths and boundaries, to assess how well a model suits the statistics. • Types of Regression Metrics • Some common regression metrics in scikit-learn with examples • Mean Absolute Error (MAE) • Mean Squared Error (MSE) • R-squared (R²) Score • Root Mean Squared Error (RMSE)
  • 21.
  • 22.
    Conclusion So we concludethat the system that we proposed solves most of the problems that we have with the existing system.After training and testing of datasets with all models, the linear regression performs better than gradient boost regressor model. The highest accuracy score is achieved by the linear regression. So, we suggest that this regression model be used for future house price predictions. Therefore, the outcome of our project will be predicting house prices with good accuracy which can help the customer as well as developer.