This document describes a SAS application that dynamically creates drill-down capabilities in SAS output to allow users to view listings of ID numbers associated with specific data values. The application generates one-way or two-way frequency tables with hyperlinks connecting data values to HTML pages listing corresponding ID numbers. It uses macros to dynamically identify variables, create frequency tables and matching HTML files, and add hyperlinks to data values in the output. This allows non-programmers to efficiently examine specific cases behind data values without involving programmers.
This document discusses different approaches for mapping object-oriented class hierarchies and properties to a relational database schema. It describes mapping an entire class hierarchy to a single table, mapping each concrete class to its own table, mapping each class to its own table, and using a generic table structure. It also discusses strategies for mapping class-scope properties that apply to all instances of a class, including using single-column single-row tables, multi-column single-row tables, multi-column single-row tables for all classes, and a multi-row generic schema.
This document discusses how the Unified Modeling Language (UML) and UML Profile for Data Modeling can be used to map object-oriented application models to relational data models. Key mappings include:
- Packages map to database schemas
- Classes map to tables
- Attributes map to columns
- Associations between classes map to relationships between tables, such as one-to-one, one-to-many, and many-to-many relationships.
- Generalization relationships between classes map to identifying relationships between tables.
This tutorial introduces Clementine, a data mining toolkit. It provides an overview of the Clementine workspace and guides users through loading sample medical data, visualizing the data in a table, and preparing it for modeling. The goal is to help medical researchers find which drug may be appropriate for future patients with the same illness as those in the sample data.
Access is a relational database management system that stores data in tables and allows for complex querying of data across related tables. It stores data in tables rather than worksheets like Excel. Access allows users to create forms and reports, run queries, and connect to external data sources. Key features include building queries visually through a graphical query designer interface without needing SQL knowledge, setting relationships between tables, and updating records through queries.
Creating a Coding Book in IBM SPSS StatisticsThiyagu K
The Codebook is a document containing information about each of the variables in your dataset, such as:
The name assigned to the variable
What the variable represents (i.e., its label)
How the variable was measured (e.g. nominal, ordinal, scale)
How the variable was actually recorded in the raw data (i.e. numeric, string; how many characters wide it is; how many decimal places it has)
For scale variables: The variable's units of measurement
For categorical variables: If coded numerically, the numeric codes and what they represent
This presentation explains the procedure of creating a codebook in IBM SPSS Statistics.
SPSS is a statistical software package used for statistical analysis and data management. It was first released in 1968 and was later acquired by IBM in 2009. Some key uses of SPSS include statistical analysis for social sciences, market research, education, and health research. It allows users to perform various statistical analyses, manage data, and export outputs to other formats.
This document discusses the Excel add-in for data mining. It allows users to mine data with a few clicks using advanced algorithms without needing experience in data mining or SQL server configuration. The add-in contains sections for data preparation, modeling, accuracy validation, and connection. Data can be explored, cleaned, and prepared for modeling. Common modeling algorithms like decision trees, clustering, and association rules are available. Accuracy and validation tools allow testing models on real data. The add-in combines the power of SQL Server Analysis Services with the ease of use of Excel.
Merge vs sql join vs append (horizontal vs vertical) bestAraz Abbas Zadeh
This document discusses methods for joining SAS data sets, including vertical and horizontal joins. Vertical joins involve appending one data set to another, while horizontal joins use key variables to combine observations. Specific join methods like inner, left, right, and full joins are explained. The document provides examples demonstrating how to perform each type of join in SAS using PROC SQL and PROC DATASETS. Limitations and potential issues with joining data sets are also addressed.
This document provides an overview of the statistical software package SPSS (Statistical Package for the Social Sciences). It was originally developed in 1968 to facilitate statistical analysis in the social sciences and was later purchased by IBM in 2009 for over $1 billion. The document outlines SPSS's general capabilities for data management, analysis, and visualization including defining and coding variables, descriptive statistics, graphs, and other statistical analyses. It also defines different variable types, levels of measurement, and common descriptive statistics like measures of central tendency and dispersion.
This document provides an overview and instructions for using IBM SPSS Statistics 19. It includes tutorials for basic functions like opening data files, running analyses, and viewing results. It also covers more advanced topics such as reading different data file types, using the Data Editor to enter and define variable properties, handling missing data, and working with multiple data sources. The document is intended to help new users learn the main capabilities and interface of IBM SPSS Statistics.
Interactivity on Excel Using Pivoting, Dashboards, “Index and Match,” and Glo...Shalin Hai-Jew
Data are not inert, but interpreting summary data from still data visualizations may be somewhat limited. Excel has various built-in enablements for interactive engagements with data, including pivoting, dashboarding, indexing and matching, and global mapping. This work shows some basic setups of data that can enable more interactivity with little effort.
This document discusses graphical descriptions of data through graphs and charts. It introduces frequency tables and relative frequency tables that organize qualitative data into categories and counts. A sample frequency table is created from data on types of cars students drive. This data is then displayed in a bar chart and pie chart to visualize the distribution. Bar charts are described as using category on the x-axis and frequency on the y-axis with rectangular bars proportional in height to the frequencies. Pie charts divide a circle into wedge-shaped sectors proportional to relative frequencies. Examples are provided of creating these graphs in StatCrunch software from the raw car type data.
SPSS (Statistical Package for the Social Sciences) is a statistical analysis software package that allows users to extract, manage, and analyze data. It provides features like generating reports, charts, descriptive statistics, and complex statistical analyses. While SPSS is easy to use and good for beginners, it has some limitations for advanced users in terms of customizing outputs and performing certain data manipulations. The document then describes the main SPSS interface windows including the data editor, output navigator, and syntax editor. It also covers how to open datasets, define variables, transform data, and create frequency tables and other outputs in SPSS.
Support Vector Machines (SVM) with linear or nonlinear kernels has become one of the most promising learning algorithms for classification as well as for regression. All the multilayer perceptron (MLP),Radial Basic Function(RBF) and Learning Polynomials are also worked efficiently with SVM. SVM is basically derived from statistical Learning Theory and it is very powerful statistical tool. The basic principal for the SVM is structural risk minimization and closely related to regularization theory. SVM is a group of supervised learning techniques or methods, which is used to do for classification or regression. In this paper discussed the importance of Support Vector Machines in various areas. This paper discussing the efficiency of SVM with the combination of other classification techniques.
This document discusses computers and their use in data analysis. It describes how computers can perform calculations much faster than humans. It then provides an overview of the history of computers from the first to fifth generations, describing the components used in each. It also discusses different types of computers based on their purpose, performance, and characteristics. The document concludes by explaining how statistical software like Excel and SPSS can be used to efficiently perform tasks like descriptive statistics, correlations, regressions, and other analyses.
Spss data analysis for univariate, bivariate and multivariate statistics by d...Dr. Sola Maitanmi
This chapter provides an overview of statistical principles and modeling. The goals of statistical modeling are to describe sample data and make inferences about the underlying population. Inferential statistics are used to estimate population parameters based on sample statistics. Statistical tests indicate if observed effects in a sample could plausibly occur by chance or suggest an effect in the population. The appropriate statistical model depends on the type of data, such as using t-tests and ANOVA for mean differences or correlation/regression for relationships between continuous variables. Overall, statistical analysis involves sampling data, applying a model, and evaluating model fit and inferences that can be made about the population.
This document provides an overview of the Statistical Package for Social Sciences (SPSS) software. It describes the main components and windows in SPSS, including the data window, variable view window, output window, and chart editor window. It also outlines several statistical techniques that can be performed in SPSS, such as descriptive statistics, correlations, t-tests, and chi-square tests of independence. SPSS is a tool that allows users to manage and analyze data, as well as generate graphs and conduct a wide range of statistical procedures.
This document provides instructions for entering data into SPSS from Excel, cleaning data in SPSS, and formatting variables. It discusses:
1. The three main windows in SPSS and how to enter data directly or import from Excel.
2. Guidelines for structuring data in Excel for easy import into SPSS, including naming variables, encoding categories, including IDs, and placing each variable in its own column.
3. Methods for cleaning data in SPSS, such as recoding variables, creating new variables, computing variables from existing ones, and labeling and formatting variables.
This document discusses how charts can be used to convey messages through visual representations of data. It describes different chart types like pie charts, column charts, and stacked column charts and explains how to create and modify charts using the Chart Wizard and toolbar tools in Excel. It also covers linking and embedding charts in other documents, as well as multitasking between applications using the taskbar. The key points are how to select the appropriate chart type to fit the data and convey the intended message, and how to create and modify charts to effectively communicate information visually.
The document discusses the key components of Microsoft Excel, including worksheets, cells, formulas, functions, charts, and printing. It describes how to enter and format data, use formulas and functions, navigate between sheets, resize rows and columns, and create basic charts using the Chart Wizard. Key components of the Excel window include the worksheet, formula bar, row and column headings, and sheet tabs. Formulas in Excel always begin with an equal sign and can include arithmetic operators. Functions like SUM can be used to calculate values across ranges of cells.
ETL Validator gives quick and easy way to compare Metadata changes between source & target data sources OR changes occurring within the same Database at different points of time. Here, we will create a test case with the Metadata Compare Tool.
Data processing involves converting raw data into meaningful information through activities like editing, coding, classifying, tabulating and diagramming data. It is concerned with preparing raw research data for analysis by organizing and managing data files. The goal is to check for errors or inconsistencies in the data and structure it in a way that allows for descriptive and inferential statistical analysis.
This document discusses using the CALL SYMPUT routine to transfer information between DATA step program steps. It provides three examples: 1) creating dummy variables for all possible values of a variable, 2) generating labels for variables using existing formats, and 3) using the BYTE function to assign alphabetically ordered names to datasets created from raw data files. CALL SYMPUT assigns values produced in a DATA step to macro variables, allowing dynamic communication between SAS language and macros.
This poster represents 4 months of work on the MSc project while doing a double degree at Heriot-Watt University.
£50 have been given for rewarding this work.
This lesson covers SAS macros including how they work, creating macros and macro variables, and incorporating macros into existing programs. Key points include macros allow writing a program that generates a program, macros help automate repetitive tasks, and macro variables store text strings that can be referenced throughout a SAS program. The lesson also reviews invoking macros, using parameters, and conditional logic with %IF/%THEN/%ELSE.
This document summarizes a research project that aims to develop an application to predict airline ticket prices using machine learning techniques. The researchers collected over 10,000 records of flight data including features like source, destination, date, time, number of stops, and price. They preprocessed the data, selected important features, and applied machine learning algorithms like linear regression, decision trees, and random forests to build predictive models. The random forest model provided the most accurate predictions according to performance metrics like MAE, MSE, and RMSE. The researchers propose deploying the best model in a web application using Flask for the backend and Bootstrap for the frontend so users can input flight details and receive predicted price outputs.
Potter's Wheel is an interactive tool for data transformation, cleaning and analysis. It integrates data auditing, transformation and analysis. The user can specify transformations by example through a spreadsheet interface. It detects discrepancies and flags them for the user. Transformations can be stored as programs to apply to data. It allows interactive exploration of data without waiting through partitioning and aggregation.
This document discusses macro variables in SAS/MACROS. It covers:
1. Global and automatic macro variables that are created when SAS is invoked, as well as user-defined macro variables that can be created using %LET.
2. Referencing macro variables with an ampersand (&) to substitute their values. This works in literals enclosed in double quotes but not single quotes.
3. Automatic macro variables like SYSDATE, SYSTIME, and SYSJOBID that provide system information, and how their values can be displayed and used.
Energy-efficient technology investments using a decision support system frame...Emilio L. Cano
This document presents an integrated framework for decision support systems using R. It describes using R and related packages to represent stochastic energy optimization problems, generate input files for solvers, analyze results, and produce reproducible reports. Stochastic models are developed and solved within this framework. The framework allows statistical analysis, graphical output, model equations, solver inputs/outputs, and comprehensive reports to be combined for modeling, analysis, and stakeholder communication.
The previous research has focused on quick and efficient generation of wrappers; the
development of tools for wrapper maintenance has received less attention. This is an important research
problem because Web sources often change in ways that prevent the wrappers from extracting data
correctly. Present an efficient algorithm that extract unstructured data to structural data from web. The
wrapper verification system detects when a wrapper is not extracting correct data, usually because the
Web source has changed its format. The Verification framework automatically recovers data using
Dimension Reduction Techniques from changes in the Web source by identifying data on Web pages.
After apply wrapped data to One Class Classification in Numerical features for avoid classification
problem. Finally, the result data apply in Top-K query for provide best rank based on probabilities
scores. Wrapper verification system relies on one-class classification techniques to beat previous
weaknesses to identify the problem by analysing both the signature and the classifier output. If there are
sufficient mislabelled slots, a technique to find a pattern could be explored.
This document discusses how to call functions in the R language from SAS/IML Studio. It describes transferring data between SAS and R data structures, calling an R analysis from IMLPlus, and calling R packages and graphics from IMLPlus. Specifically, it shows how to:
1. Submit R statements from within an IMLPlus program using SUBMIT / R.
2. Transfer data between SAS data sets, matrices, and DataObjects and R data frames and matrices.
3. Call an R linear regression analysis, extract results, and transfer them back to SAS.
4. Load an R package and call functions from it to estimate a kernel density and create a histogram.
Semantically Enriched Knowledge Extraction With Data MiningEditor IJCATR
This document discusses using data mining techniques to extract knowledge from data and representing that knowledge in both human-understandable and machine-understandable formats. It uses an input dataset, applies data mining methods like regression using WEKA and SAS, extracts natural language triples about the results, and generates RDF triples to represent the knowledge in a machine-readable format.
This document discusses various modeling techniques used during the analysis phase of software engineering. It covers scenario-based modeling including use cases, activity diagrams, and swimlane diagrams. It also discusses flow-oriented modeling using data flow diagrams and grammars. Additionally, it discusses class-based modeling including identifying analysis classes, class diagrams, and the class-responsibility-collaborator technique. Finally, it discusses behavioral modeling including identifying events and creating state and sequence diagrams.
Explore how data science can be used to predict employee churn using this data science project presentation, allowing organizations to proactively address retention issues. This student presentation from Boston Institute of Analytics showcases the methodology, insights, and implications of predicting employee turnover. visit https://bostoninstituteofanalytics.org/data-science-and-artificial-intelligence/ for more data science insights
This document discusses algorithms, flowcharts, pseudocode, and data types in programming. It defines an algorithm as a step-by-step procedure to solve problems. Pseudocode uses natural language to describe an algorithm, while a flowchart provides a graphical representation. The document also discusses using flowcharts and pseudocode in the planning process, and defines common data types like integer, string, boolean and their uses in programming.
This document summarizes a study that used various machine learning techniques to classify customers as either 2G or 3G network users based on their usage data. It discusses preprocessing the data, building models using decision trees, lazy classifiers, and boosting, and combining the models' predictions. The best performing technique was boosting decision trees, which correctly classified 88.58% of customers through 10-fold cross-validation. While imperfect, combining multiple models led to more reliable classification than any single model.
How PROC SQL and SAS® Macro Programming Made My Statistical Analysis Easy? A ...Venu Perla
Life scientists collect similar type of data on daily basis. Statistical analysis of this data is often performed using SAS programming techniques. Programming for each dataset is a time consuming job. The objective of this paper is to show how SAS programs are created for systematic analysis of raw data to develop a linear regression model for prediction. Then to show how PROC SQL can be used to replace several data steps in the code. Finally to show how SAS macros are created on these programs and used for routine analysis of similar data without any further hard coding in a short period of time.
Learning
Base SAS,
Advanced SAS,
Proc SQl,
ODS,
SAS in financial industry,
Clinical trials,
SAS Macros,
SAS BI,
SAS on Unix,
SAS on Mainframe,
SAS interview Questions and Answers,
SAS Tips and Techniques,
SAS Resources,
SAS Certification questions...
visit http://sastechies.blogspot.com
This presentation illustrates DocIndex, InternetMiner and VisioDecompositer - my 3 proprietary test tools - and walks the user through how they are used effectively.
The tools are presented in the context of a Test Strategy and the emphasis is on HOW the tools are used and the rationale behind the esign of the tools.
View this presentation with SPEAKERS NOTES ON.
2004 map reduce simplied data processing on large clusters (mapreduce)anh tuan
The document describes MapReduce, a programming model and associated implementation for processing large datasets across distributed systems. It allows users to specify map and reduce functions to process key-value pairs. The runtime system handles parallelization across machines, partitioning data, scheduling execution, and handling failures. Hundreds of programs have been implemented using MapReduce at Google to process terabytes of data on thousands of machines.
The document describes MapReduce, a programming model and associated implementation for processing large datasets across distributed systems. MapReduce allows users to specify map and reduce functions to process key-value pairs. The runtime system automatically parallelizes and distributes the computation across clusters, handling failures and communication. Hundreds of programs have been implemented using MapReduce at Google to process terabytes of data on thousands of machines.
The document provides an overview of Microsoft Time Series algorithms for forecasting continuous values like sales over time. It discusses creating time series models in SQL Server that use a key time column to order data and make predictions on predictable attributes. The document demonstrates creating a time series mining model called "Forecasting_MIXED" using the Microsoft Time Series algorithm to predict quantity and amount based on reporting date and region. It shows how to create, alter, and execute the DMX query to generate the model and structure.
1. 1
Paper 224-2009
BUILDING DRILL-DOWN CAPABILITIES DYNAMICALLY IN SAS® OUTPUT
USING BASE SAS®
Hong Zhang, Mathematica Policy Research, Inc., Princeton, NJ
Ronald Palanca, Mathematica Policy Research, Inc., Princeton, NJ
Mark Beardsley, Mathematica Policy Research, Inc., Princeton, NJ
Barbara Kolln, Mathematica Policy Research, Inc., Princeton, NJ
ABSTRACT
“Can you give me a list of ID numbers where ….?” If you are a SAS® programmer, requests of this type might sound
very familiar to you. Such requests occur primarily when research staff members determine that data values may be
outside an acceptable range, are inconsistent, or that the data for certain cases should be examined more closely.
Wouldn’t it be nice if they could look up the ID numbers on their own? This paper presents a tool for enabling them to
do just that. The application dynamically creates drill-down links in SAS output, enabling research staff to view listings
of ID numbers behind each data value of any variable.
Creating one or more hyperlinks in fixed positions can be accomplished fairly easily in some types of SAS output.
However, creating hyperlinks dynamically in every data cell of a report is much more difficult, particularly when the
source SAS dataset changes over time. The challenges in developing the application included (1) identifying the
positions of data cells in the SAS output, (2) dynamically creating separate HTML listings of ID numbers for each data
value, (3) matching data cells correctly with their corresponding HTML listings, and (4) adding hyperlinks to each data
cell on the fly. The application uses SASHELP.VCOLUMN to dynamically identify the input dataset and variables, as
well as PROC REPORT’S CALL DEFINE facility to establish hyperlinks in data cells. A series of macros automates
the process.
INTRODUCTION
When researchers wish to investigate or verify data values for selected cases (observations), they often ask
programmers to provide the ID numbers of those cases. An application that allows non-programmers to view listings
of ID numbers associated with responses of interest could be a valuable tool in the data examination and verification
process. The benefits include (1) a more efficient use of staff time, which allows programmers to spend additional
time on more complex programming tasks; and (2) a reduction in the overall costs of a research project.
An application that allows staff to identify specific cases in a dataset should have dynamic capabilities; that is, it
should be able to reflect the changing nature of the data as more cases are included and as responses show
increasing variability. The application described in this paper creates either one-way or two-way (crosstab) frequency
output in HTML format with hyperlinks, enabling users to connect (“drill down”) to lists of respondent ID numbers or to
simple reports that present other variables in addition to ID numbers. The program was designed to allow researchers
to select variables from any SAS dataset and to review their frequencies, either in one-way or crosstab output. The
HTML listings can be saved to a file or printed out.
The main programmatic challenges in developing the application using Base SAS were (1) Identifying the positions of
data cells in the frequency output, (2) matching data cells (frequency counts) with their corresponding HTML listings,
and (3) adding hyperlinks to each data cell. Output produced by the program is generated dynamically; that is, it
reflects the current range of values of the selected variables, which in many scenarios can change significantly over
the course of data collection.
DATA
The application is described using a SAS dataset (N=360), called STUDENT, which includes ID, YEAR (year of birth),
GRADE, GENDER, AGE, SCHOOLID, and STATE. GRADE and YEAR were chosen to illustrate both one-way and
two-way frequency output. Figure 1 presents sample records from the STUDENTdataset.
Reporting and Information VisualizationSAS Global Forum 2009
2. 2
Figure 1. Student Sample Records
INTERACTIVE SET UP
The program can be run to obtain either one-way frequencies or crosstabs. %Window was added to make the
selection interactive (see Figure 2).
Figure 2. Set-Up Screen
After the choice between one-way or crosstab output is made, a second screen allows users to type in the names of
variables (in an existing SAS dataset) whose values they wish to investigate, or to select all of the variables.
DRILLING DOWN IN ONE-WAY FREQUENCIES
SELECTING VARIABLES AND CREATING HTML REPORTS FOR DATA VALUES
The program permits a choice between one-way frequencies on all variables in a dataset or on a subset of variables.
%LET statements are used to create the name of the SAS dataset and its location as macro variables. Three macros
are then executed in this part of the program.
The first macro, %CREATE_TABLES, runs individual frequencies on the variables selected in the %Window screen.
Each set of frequency output is then saved as an individual SAS dataset, which is named according to the variable
name. Each individual frequency count will have a number, called UID, assigned to it. The UID will be equal to _n_ ,
the internal SAS sequential number for each observation in a dataset. The combination of VARNAME and UID in
each dataset is unique. All individual frequency output datasets are then combined into one dataset, called
ALL_FREQS (see Figure 3). The %CREATE_TABLES macro is executed dynamically using parameters passed to it
from the next macro, %TABLE_DRIVER.
%macro create_tables (lib, dataset, col, type);
proc freq data=&lib..&dataset;
table &col./list missing out=&col. outcum;
run;
data &col.;
set &col.;
length value $300. varname $20. vartype $4.;
varname="&col.";
uid =_n_;
value=STRIP(put(&col.,8.));
Reporting and Information VisualizationSAS Global Forum 2009
3. 3
vartype = "&type";
drop &col.;
run;
data All_Freqs;
set All_Freqs &col.;
run;
%mend create_tables;
The second macro, %TABLE_DRIVER, determines if frequencies are to be run on all variables or only on selected
variables (based on the entry made in the interactive portion of the program). The entry is passed as a macro variable
to the SAS program, and is used in the %TABLE_DRIVER macro. %TABLE_DRIVER creates parameters
dynamically and passes them to the %CREATE_TABLES macro using CALL EXECUTE.
%macro table_driver;
data _null_;
set sashelp.Vcolumn;
%if &num_fields.^=1 %then %do;
if libname = 'DSN' and memname=upcase("&dataset);
call execute('%create_tables('||libname||','||memname||','||name||','||type||')');
%end;
%else %do;
if libname ='DSN' and memname=upcase("&dataset") and upcase(name) in
(&selected_fields) ;
call execute('%create_tables('||libname||','||memname||','||name||','||type||')');
%end;
%mend table_driver;
Figure 3. All_Freqs Dataset
The third macro, %CREATE_HTMLS, creates a series of individual datasets. Each dataset is a subset of the
STUDENT dataset and represents a unique combination of the variables VARNAME and UID in the ALL_FREQS
dataset (see Figure 3). ODS HTML and PROC PRINT are then used to create HTML pages for each table. Each
HTML page is named based on a unique combination of VARNAME and UID. For example, if the variable VALUE in
the ALL_FREQS dataset is equal to 1999, UID would be 6. A dataset will then be created using the filter, YEAR =
1999, and saved as an HTML file named YEAR_6.html. Once again, CALL EXECUTE is used to dynamically create
the macro variables that are passed to the %CREATE_HTMLS macro.
%macro create_htmls (var,value,uid,type);
ods html file="&path.&var._&uid..html"; *variable & row number combination*;
proc print data=&var._&uid. noobs;
where &var.="&value.";
var ID, Gender, Age, SchoolID, State
title "Variable: &var., Value:&value.";
%mend create_htmls;
data _null_;
set All_Freqs;
call execute ('%create_htmls('||STRIP(var)||','|| STRIP(value)||','|| STRIP (uid)||','||STRIP(vartype)||')');
run;
Reporting and Information VisualizationSAS Global Forum 2009
4. 4
CREATING THE FREQUENCY REPORT WITH HYPERLINKS
Each frequency output dataset created by the %CREATE_TABLE macro will then be displayed in a report using
PROC REPORT. The %CREATE_REPORT macro is executed dynamically by the %RPT_DRIVER macro.
%RPT_DRIVER is similar to the %TABLE_DRIVER macro in that it takes into account only the variables that were
selected in %Window for one-way frequencies. Variable names are then passed as parameters from the
%RPT_DRIVER macro to the %CREATE_TABLE macro.
In the COMPUTE BLOCK for the column Count (N) in the PROC REPORT code below, a URLSTRING is created
based on the variable name passed as a parameter and the UID from the input frequency dataset. For example, if the
variable name passed is YEAR and the UID is 1 from the YEAR frequency dataset, then a URLSTRING will be
created with the name of YEAR_1.html. If the URL address just created is one of the HTML files produced by the
%CREATE_HTML macro, then a hyperlink will be created between the two files using the CALL DEFINE statement.
The macro variable &FIELD and the variable UID are used to identify the row of the data cell in the report. For each
row, the facility CALL DEFINE is employed to identify the columns and setup the URL and style for each column in
that specific row. Formatting of columns and cells is done inside the COMPUTE block.
%macro create_report (field,lbl);
proc report data=&field. headskip headline ls=256 nowd missing;
column uid value COUNT PERCENT;
define uid/display noprint;
define value/display "&field." width=255 flow;
define COUNT / 'N';
define PERCENT / 'P' f=7.2;
title2 "Frequencies of &field.";
compute COUNT;
urlstring="&path.&field._"|| STRIP(uid)||".html";
if fileexist (urlstring) then do;
call define ("_c3_","URL",urlstring);
call define ("_c3_", "style", "style=[background=light greenfont_weight = bold]");
end;
endcomp;
run;
%mend create_report;
%macro rpt_driver;
%if &VARS.^=2 %then %do;
data _null_;
set sashelp.Vcolumn;
if libname='DSN' and memname=upcase("&dataset");
call execute ('%create_report('||name||',%str('||label||'))');
run;
%end;
%else %do;
data _null_;
set sashelp.Vcolumn;
if libname ='DSN' and memname=upcase("&dataset") and upcase(name) in
(&selected_fields) ;
call execute('%create_report('||name||',%str('||label||'))');
run;
%end;
%mend rpt_driver;
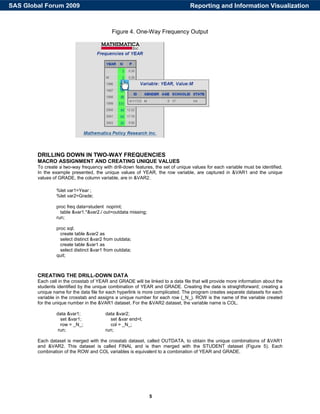
As noted previously, the program uses the variables YEAR and GRADE from the STUDENT dataset for illustrative
purposes. Figure 4 shows how the one-way frequency output works. By clicking on the frequency (N) for the value
“M” (missing) in the frequency report, the user obtains a drill-down listing of ID numbers that have missing values for
YEAR (in this example, YEAR is missing for only one case). In addition to ID, the listing of cases also includes
GENDER, AGE, SCHOOLID, and STATE. All of the listings of individual cases have the name of the variable and its
value in the title.
Reporting and Information VisualizationSAS Global Forum 2009
5. 5
Figure 4. One-Way Frequency Output
DRILLING DOWN IN TWO-WAY FREQUENCIES
MACRO ASSIGNMENT AND CREATING UNIQUE VALUES
To create a two-way frequency with drill-down features, the set of unique values for each variable must be identified.
In the example presented, the unique values of YEAR, the row variable, are captured in &VAR1 and the unique
values of GRADE, the column variable, are in &VAR2.
%let var1=Year ;
%let var2=Grade;
proc freq data=student noprint;
table &var1.*&var2./ out=outdata missing;
run;
proc sql;
create table &var2 as
select distinct &var2 from outdata;
create table &var1 as
select distinct &var1 from outdata;
quit;
CREATING THE DRILL-DOWN DATA
Each cell in the crosstab of YEAR and GRADE will be linked to a data file that will provide more information about the
students identified by the unique combination of YEAR and GRADE. Creating the data is straightforward; creating a
unique name for the data file for each hyperlink is more complicated. The program creates separate datasets for each
variable in the crosstab and assigns a unique number for each row (_N_). ROW is the name of the variable created
for the unique number in the &VAR1 dataset. For the &VAR2 dataset, the variable name is COL.
data &var1; data &var2;
set &var1; set &var end=l;
row = _N_; col = _N_;
run; run;
Each dataset is merged with the crosstab dataset, called OUTDATA, to obtain the unique combinations of &VAR1
and &VAR2. This dataset is called FINAL and is then merged with the STUDENT dataset (Figure 5). Each
combination of the ROW and COL variables is equivalent to a combination of YEAR and GRADE.
Reporting and Information VisualizationSAS Global Forum 2009
6. 6
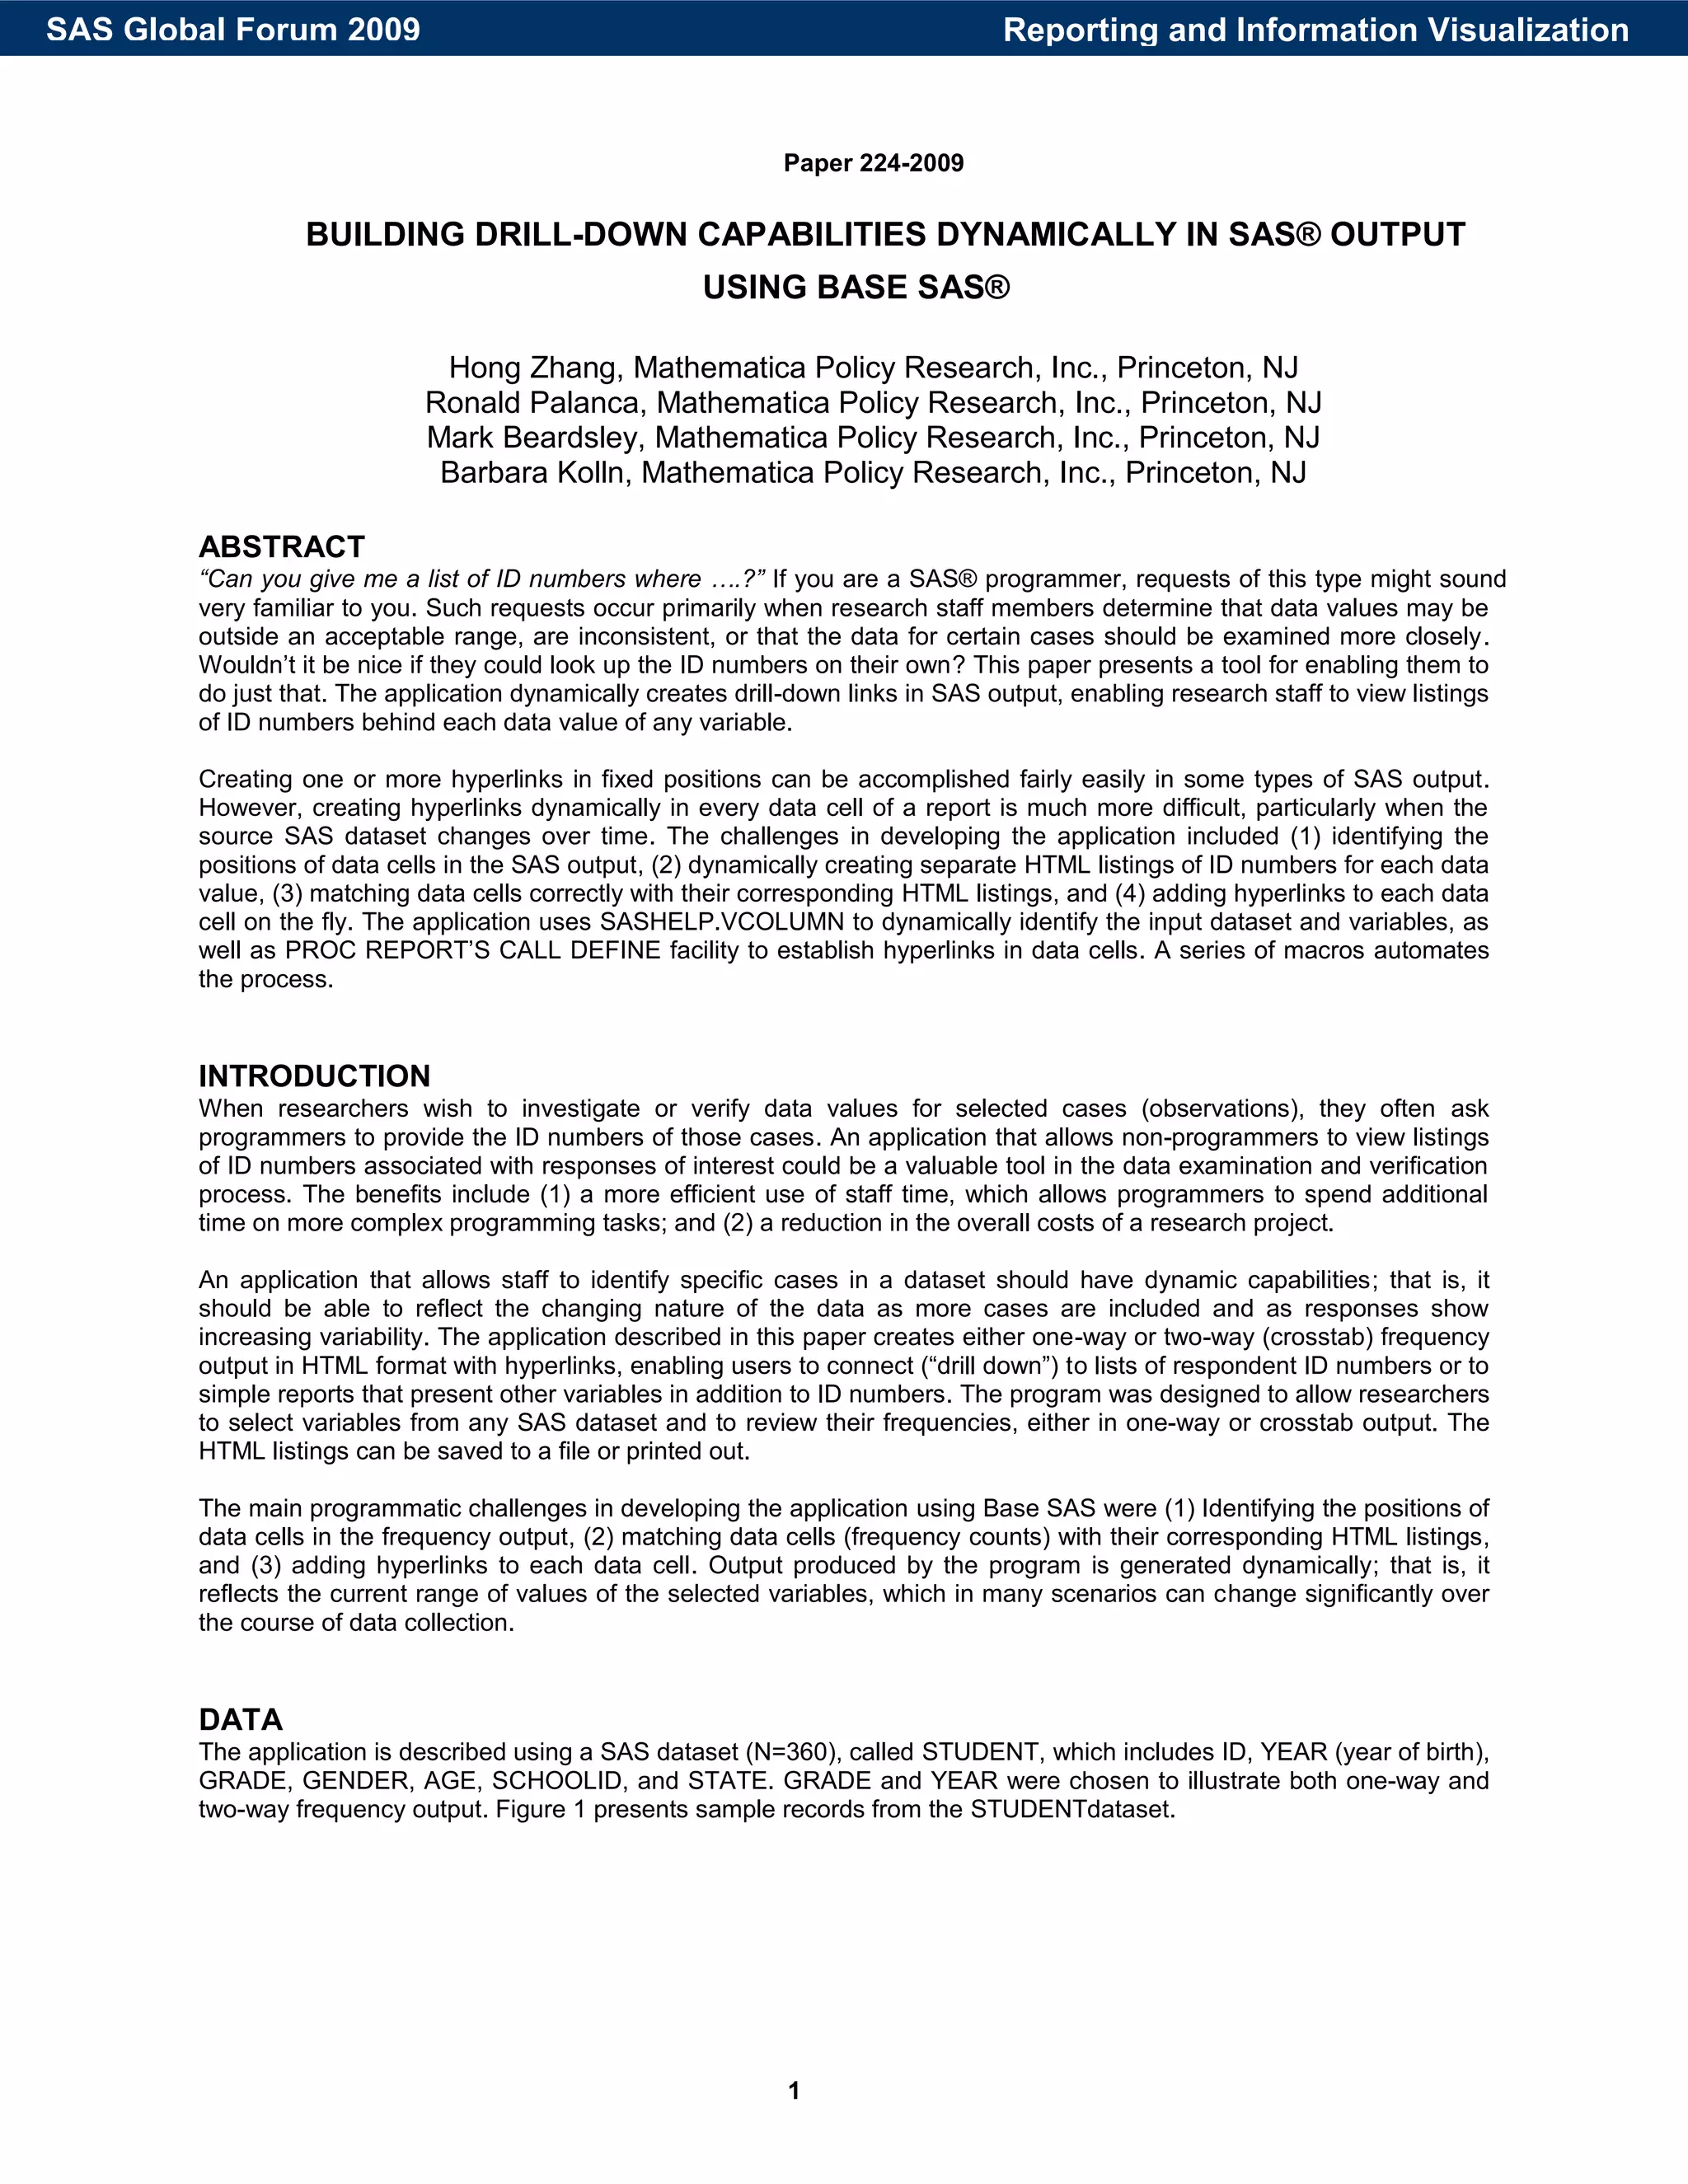
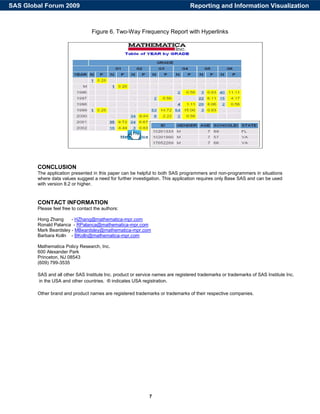
Figure 5. Two-Way Frequency Output
A macro called %CREATE_EACH_HTML outputs multiple HTML files, which represent combinations of the ROW
and COL variables. The macro is executed in the DATA NULL step for each unique combination of &VAR1 (YEAR,
the row variable) and &VAR2 (GRADE, the column variable).
%macro create_each_html(row,col);
ODS html file="&PROJECT._&row._&col..html" STYLE = barrettsblue;
proc print data=FINAL noobs;
where row=&row and col=&col;
var ID GENDER AGE SCHOOLID STATE;
title "<IMG SRC = 'MPRlogo.jpg'>";
title2 "&var1.=&vvar1, &var2.=&vvar2" ;
run;
%mend create_each_html;
data _null_;
set Final;
call execute('%create_each_html('|| STRIP (row)||','|| STRIP(col)||');');
run;
CREATING THE FREQUENCY REPORT WITH HYPERLINKS
The two-way frequency is output using PROC REPORT. Using a DO loop in the COMPUTE statement for the
subcolumn COUNT, each cell in the COUNT field is assigned a URL address. ROW = 1 and COL = 1 would be
1_1.html and so on. If the value of the cell is greater than zero and the corresponding HTML file is one of those
created in %CREATE_HTML, then the cell is linked to the HTML file using the CALL DEFINE statement. Formatting
of the columns and cells is added in the Compute statement.
ODS html file="crosstab_&PROJECT..html" STYLE = barrettsblue ;
proc report data=outdata headskip headline ls=255 nowd missing;
column row &var1. ("&var2" &var2, (COUNT PERCENT));
define &var1./group "&var1" STYLE=[BACKGROUND= barrettsblue];
define row/group noprint;
define &var2./across ' ' order=INTERNAL;
define COUNT /'N';
define PERCENT / 'P' f=7.2 ;
title "<IMG SRC = 'MPRlogo.jpg'>";
title2 "Table of &var1 by &var2";
compute count;
%do I=1 %to %eval(&varnum);
urlstring_&I.="&PROJECT._"|| STRIP (row)||"_"|| STRIP(&I.)||".html";
if fileexist(urlstring_&I.) and _c%eval(2*&I.+1)_>0 then do;
call define("_c%eval(2*&I.+1)_","URL",urlstring_&I. );
call define(_COL_, "style", "STYLE=[FONT_WEIGHT = BOLD]");
end;
%end;
endcomp;
compute percent;
calldefine(_COL_, "style", "STYLE=[BACKGROUND=YELLOW]");
endcomp;
run;
As shown in Figure 6 below, if the cell is selected (N=3) for YEAR = 2002 and GRADE = G2, the inset HTML file is
presented, which provides more detailed information about these three cases.
Reporting and Information VisualizationSAS Global Forum 2009
7. 7
Figure 6. Two-Way Frequency Report with Hyperlinks
CONCLUSION
The application presented in this paper can be helpful to both SAS programmers and non-programmers in situations
where data values suggest a need for further investigation. This application requires only Base SAS and can be used
with version 8.2 or higher.
CONTACT INFORMATION
Please feel free to contact the authors:
Hong Zhang - HZhang@mathematica-mpr.com
Ronald Palanca - RPalanca@mathematica-mpr.com
Mark Beardsley - MBeardsley@mathematica-mpr.com
Barbara Kolln - BKolln@mathematica-mpr.com
Mathematica Policy Research, Inc.
600 Alexander Park
Princeton, NJ 08543
(609) 799-3535
SAS and all other SAS Institute Inc. product or service names are registered trademarks or trademarks of SAS Institute Inc.
in the USA and other countries. ® indicates USA registration.
Other brand and product names are registered trademarks or trademarks of their respective companies.
Reporting and Information VisualizationSAS Global Forum 2009
8. 8
APPENDIX: SAS PROGRAM
options NOXSYNC NOXWAIT xmin MPRINT SYMBOLGEN ls=200 ps=50;
/* Optional project name */
%let PROJECT=SUGI2009;
/* SAS input file */
%let dataset=STUDENT;
/* Location where SAS input file resides */
%let path=c:temp;
libname dsn ".";
/* Delete existing HTML files */
%MACRO RemoveFiles;
x del "&pathhtml*.html";
%MEND;
%RemoveFiles;
%window start
#4 @22 'Building Drilldown Capabilities Dynamically in SAS Output using Base SAS' COLOR = BLUE attr =
underline
#9 @10 'Are we doing Crosstab or One way Frequency?(1-One way Freq, 2-Crosstab)' COLOR = RED @90 FRQ 2
attr=underline
color=RED REQUIRED = YES
14 @10 'Press ENTER to continue' COLOR = RED;
%display start;
%MACRO FREQ;
/* one way frequencies */
%IF &FRQ=1 %THEN %DO;
%window start
#4 @22 'Building Drilldown Capabilities Dynamically in SAS Output using Base SAS' COLOR = BLUE attr =
underline
#9 @10 'Are we doing Frequency on ALL or select variables ?(1-All variables, 2-Select variables)'
COLOR = RED @110 VARS 2 attr=underline color=RED REQUIRED = YES
#14 @10 'Press ENTER to continue' COLOR = RED;
#display start;
%IF &VARS = 2 %THEN %DO;
%window start
#4 @22 'Building Drilldown Capabilities Dynamically in SAS Output using Base SAS' COLOR = BLUE attr =
underline
#9 @10 'Please type in the variable names in single quotes and separated by comma'
COLOR = RED @90 fields 50 attr=underline color=RED REQUIRED = YES
#14 @10 'Press ENTER to continue' COLOR = RED;
%display start;
%END;
%let freq_fields=%UPCASE(&FIELDS);
proc sort data=dsn.&dataset out=&dataset;
by ID;
data All_Freqs;
set _null_;
run;
%macro create_tables(lib, dataset, col,type);
proc freq data=&lib..&dataset;
table &col./list missing out=&col. outcum;
run;
data &col.;
set &col.;
length value $300. varname $20. vartype $4.;
varname="&col.";
uid=_N_;
Reporting and Information VisualizationSAS Global Forum 2009
9. 9
value=STRIP(put(&col.,8.));
vartype="&type";
drop &col.;
run;
data All_Freqs;
set All_Freqs &col.;
run;
%mend create_tables;
%macro table_driver;
data _null_;
set sashelp.Vcolumn;
%if &VARS.^=2 %then %do;
if libname='DSN' and memname=upcase("&dataset") and upcase(name) not in ('ID','BATCH');
call execute('%create_tables('||libname||','||memname||','||name||','||type||')');
%end;
%else %do;
/* if only need frequencies on specified variables, uncomment the following statement*/
if libname ='DSN' and memname=upcase("&dataset") and upcase(name) in (&freq_fields) ;
call execute('%create_tables('||libname||','||memname||','||name||','||type||')');
%end;
RUN;
%mend table_driver;
%table_driver;
%macro create_htmls(var,value,uid,type);
ODS html file="&path.html&var._&uid..html";
%if &type=char %then %do;
proc print data=&dataset. noobs;
where &var.="&value.";
var ID Gender Age SchoolID State;
title "Variable: &var., Value:&value.";
run;
%end;
%else %if &type=num %then %do;
%if %sysfunc(anyalpha(&value))>0 %then %do;
/* for value .D, .R, or .M etc */
proc print data=&dataset. noobs;
where &var.=.&value.;
var ID Gender Age SchoolID State;
tilte "Variable: &var., Value:&value.";
run;
%end;
%else %do;
* pure numbers */
proc print data=&dataset. noobs;
where &var.=&value.;
var ID Gender Age SchoolID State;
title "Variable: &var., Value:&value.";
run;
%end;
%end;
%mend create_htmls;
data _null_;
set All_Freqs;
call execute('%create_htmls('||STRIP(varname)||','||STRIP(value)||','||STRIP(uid)||','||STRIP(vartype)||')');
run;
title "<IMG SRC = 'MPRlogo.jpg'>";
footnote "<A HREF='http://www.mathematica-mpr.com/'>Mathematica Policy Research Inc.</A>";
Reporting and Information VisualizationSAS Global Forum 2009
10. 10
ODS html file="&path.HTMLfreq_&PROJECT..html";
%macro create_report(field,lbl);
proc report data=&field. headskip headline ls=256 nowd missing;
column uid value COUNT PERCENT;
define uid/display noprint;
define value/display "&field." width=255 flow;
define COUNT /'N';
define PERCENT / 'P' f=7.2;
title2 "Frequencies of &field.";
compute COUNT;
urlstring="&path.HTML&field._"||STRIP(uid)||".html";
if fileexist(urlstring) then do;
call define("_c3_","URL",urlstring);
CALL DEFINE("_c3_", "style", "STYLE=[BACKGROUND=LIGHT GREEN FONT_WEIGHT = BOLD]")
end;
endcomp;
run;
%mend create_report;
%macro rpt_driver;
/* Frequencies on all variables */
%if &VARS.^=2 %then %do;
data _null_;
set sashelp.Vcolumn;
if libname='DSN' and memname=upcase("&dataset") and upcase(name) not in ('ID','BATCH');
call execute('%create_report('||name||',%str('||label||'))');
run;
%END;
/* Frequencies on selected variables */
%ELSE %DO;
data _null_;
set sashelp.Vcolumn;
if libname ='DSN' and memname=upcase("&dataset") and upcase(name) in (&freq_fields) ;
call execute('%create_report('||name||',%str('||label||'))');
run;
%END;
%mend rpt_driver;
%rpt_driver;
ODS html close;
%END;
%ELSE %IF &FRQ = 2 %THEN %DO;
/* two way frequencies */
%window start
#4 @22 'Building Drilldown Capabilities Dynamically in SAS Output using Base SAS' COLOR = BLUE attr =
underline
#9 @10 'What would be your row variable in the crosstab?' COLOR = RED @65 var1 15 attr=underline color=RED
REQUIRED = YES
#11 @10 'What would be your column variable in the crosstab?' COLOR = RED @65 var2 15 attr=underline
color=RED REQUIRED = YES
#14 @10 'Press ENTER to continue' COLOR = RED;
%display start;
/* determine the data types of var1 and var2 */
data _null_;
set sashelp.Vcolumn;
if libname=upcase('dsn') and memname=upcase("&dataset.") then do;
if upcase(STRIP(name))=upcase(STRIP("&var1")) then call symput('type1',STRIP(type));
if upcase(STRIP(name))=upcase(STRIP("&var2")) then call symput('type2',STRIP(type));
end;
run;
Reporting and Information VisualizationSAS Global Forum 2009
11. 11
/* If value is missing then it will be converted to S */
/* This is to ensure that the title if for missing value will not be blank */
data &dataset;
set dsn.&dataset;
if &type1. NE num or &type2. NE num then do;
array c _char_;
do over c;
if c=' ' then c='S';
end;
array i _numeric_;
do over i;
if i=. then i=.S;
end;
end;
Drop num char;
run;
proc freq data=&dataset noprint;
table &var1.*&var2./ out=outdata missing;
run;
/* Sort by the row field in output */
proc sort data=outdata;
by &var1;
run;
/* Get the unique value by variable */
proc sql;
create table &var2 as
select distinct &var2 from outdata;
create table &var1 as
select distinct &var1 from outdata;
quit;
/* Assign a unique number to each row of data. This number will determine the column number for &var2 value */
/* Create macro variable to determine number of columns */
data &var2;
set &var2 end=l;
col=_N_;
if l=1 then call symput('varnum',STRIP(put(_N_,8.)));
run;
proc sort;
by &var2;
proc sort data=outdata;
by &var2;
data v12c;
merge outdata(in=a keep=&var1 &var2) &var2.(in=b);
by &var2;
run;
proc sort;
by &var1;
/* Assign a unique number to each row of data. This number will determine the row number for &var1 value */
data &var1;
set &var1;
row=_N_;
run;
proc sort;
Reporting and Information VisualizationSAS Global Forum 2009
12. 12
by &var1;
/* Merge 2 datasets to get col/row location of each &var1 & &var2 combination */
data v12c_final;
merge v12c(in=a) &var1.(in=b);
by &var1;
run;
proc sort data=&dataset;
by &var1 &var2;
proc sort data=v12c_final;
by &var1 &var2;
/* Merge with main dataset */
data final;
merge &dataset(in=a) v12c_final(in=b);
by &var1 &var2;
if a;
run;
proc sort;
by id;
%macro create_each_html(row,col);
ODS html file="&path.HTML&PROJECT._&row._&col..html" STYLE = barrettsblue;
proc print data=FINAL noobs;
where row=&row and col=&col;
VAR ID GENDER AGE SCHOOLID STATE;
title "<IMG SRC = 'MPRlogo.jpg'>";
title2 "&var1.=&vvar1, &var2.=&vvar2" ;
run;
%mend create_each_html;
data _null_;
set v12c_final;
call symput('vvar1',&var1);
call symput('vvar2',&var2);
call execute('%create_each_html('||STRIP(row)||','||STRIP(col)||');');
run;
proc sort data=outdata;
by &var1;
/* Merge data to get row number of &var1 in cross tab */
data outdata2;
merge outdata(in=a) &var1.(in=b);
by &var1;
if a;
run;
/* Run Proc Report for cross tab */
%macro create;
ODS html file="&path.HTMLcrosstab_&PROJECT..html" STYLE = barrettsblue ;
proc report data=outdata2 headskip headline ls=255 nowd missing;
column row &var1. ("&var2" &var2, (COUNT PERCENT));
define &var1./group "&var1" STYLE=[BACKGROUND= barrettsblue];
define row/group noprint;
define &var2./across ' ' order=INTERNAL;
define COUNT /'N';
define PERCENT / 'P' f=7.2 ;
title "<IMG SRC = 'MPRlogo.jpg'>";
title2 "Table of &var1 by &var2";
Reporting and Information VisualizationSAS Global Forum 2009
13. 13
footnote "<A HREF='http://www.mathematica-mpr.com/'>Mathematica Policy Research Inc.</A>";
compute COUNT;
%Do I=1 %to %eval(&varnum);
urlstring_&I.="&path.HTML&PROJECT._"||STRIP(row)||"_"||STRIP(&I.)||".html";
if fileexist(urlstring_&I.) and _c%eval(2*&I.+1)_>0 then do;
call define("_c%eval(2*&I.+1)_","URL",urlstring_&I. );
CALL DEFINE(_COL_, "style", "STYLE=[FONT_WEIGHT = BOLD]");
end;
%end;
endcomp;
COMPUTE PERCENT;
CALL DEFINE(_COL_, "style", "STYLE=[BACKGROUND=YELLOW]");
ENDCOMP;
run;
%mend CREATE;
%create;
ODS html close;
%END;
%MEND FREQ;
Reporting and Information VisualizationSAS Global Forum 2009