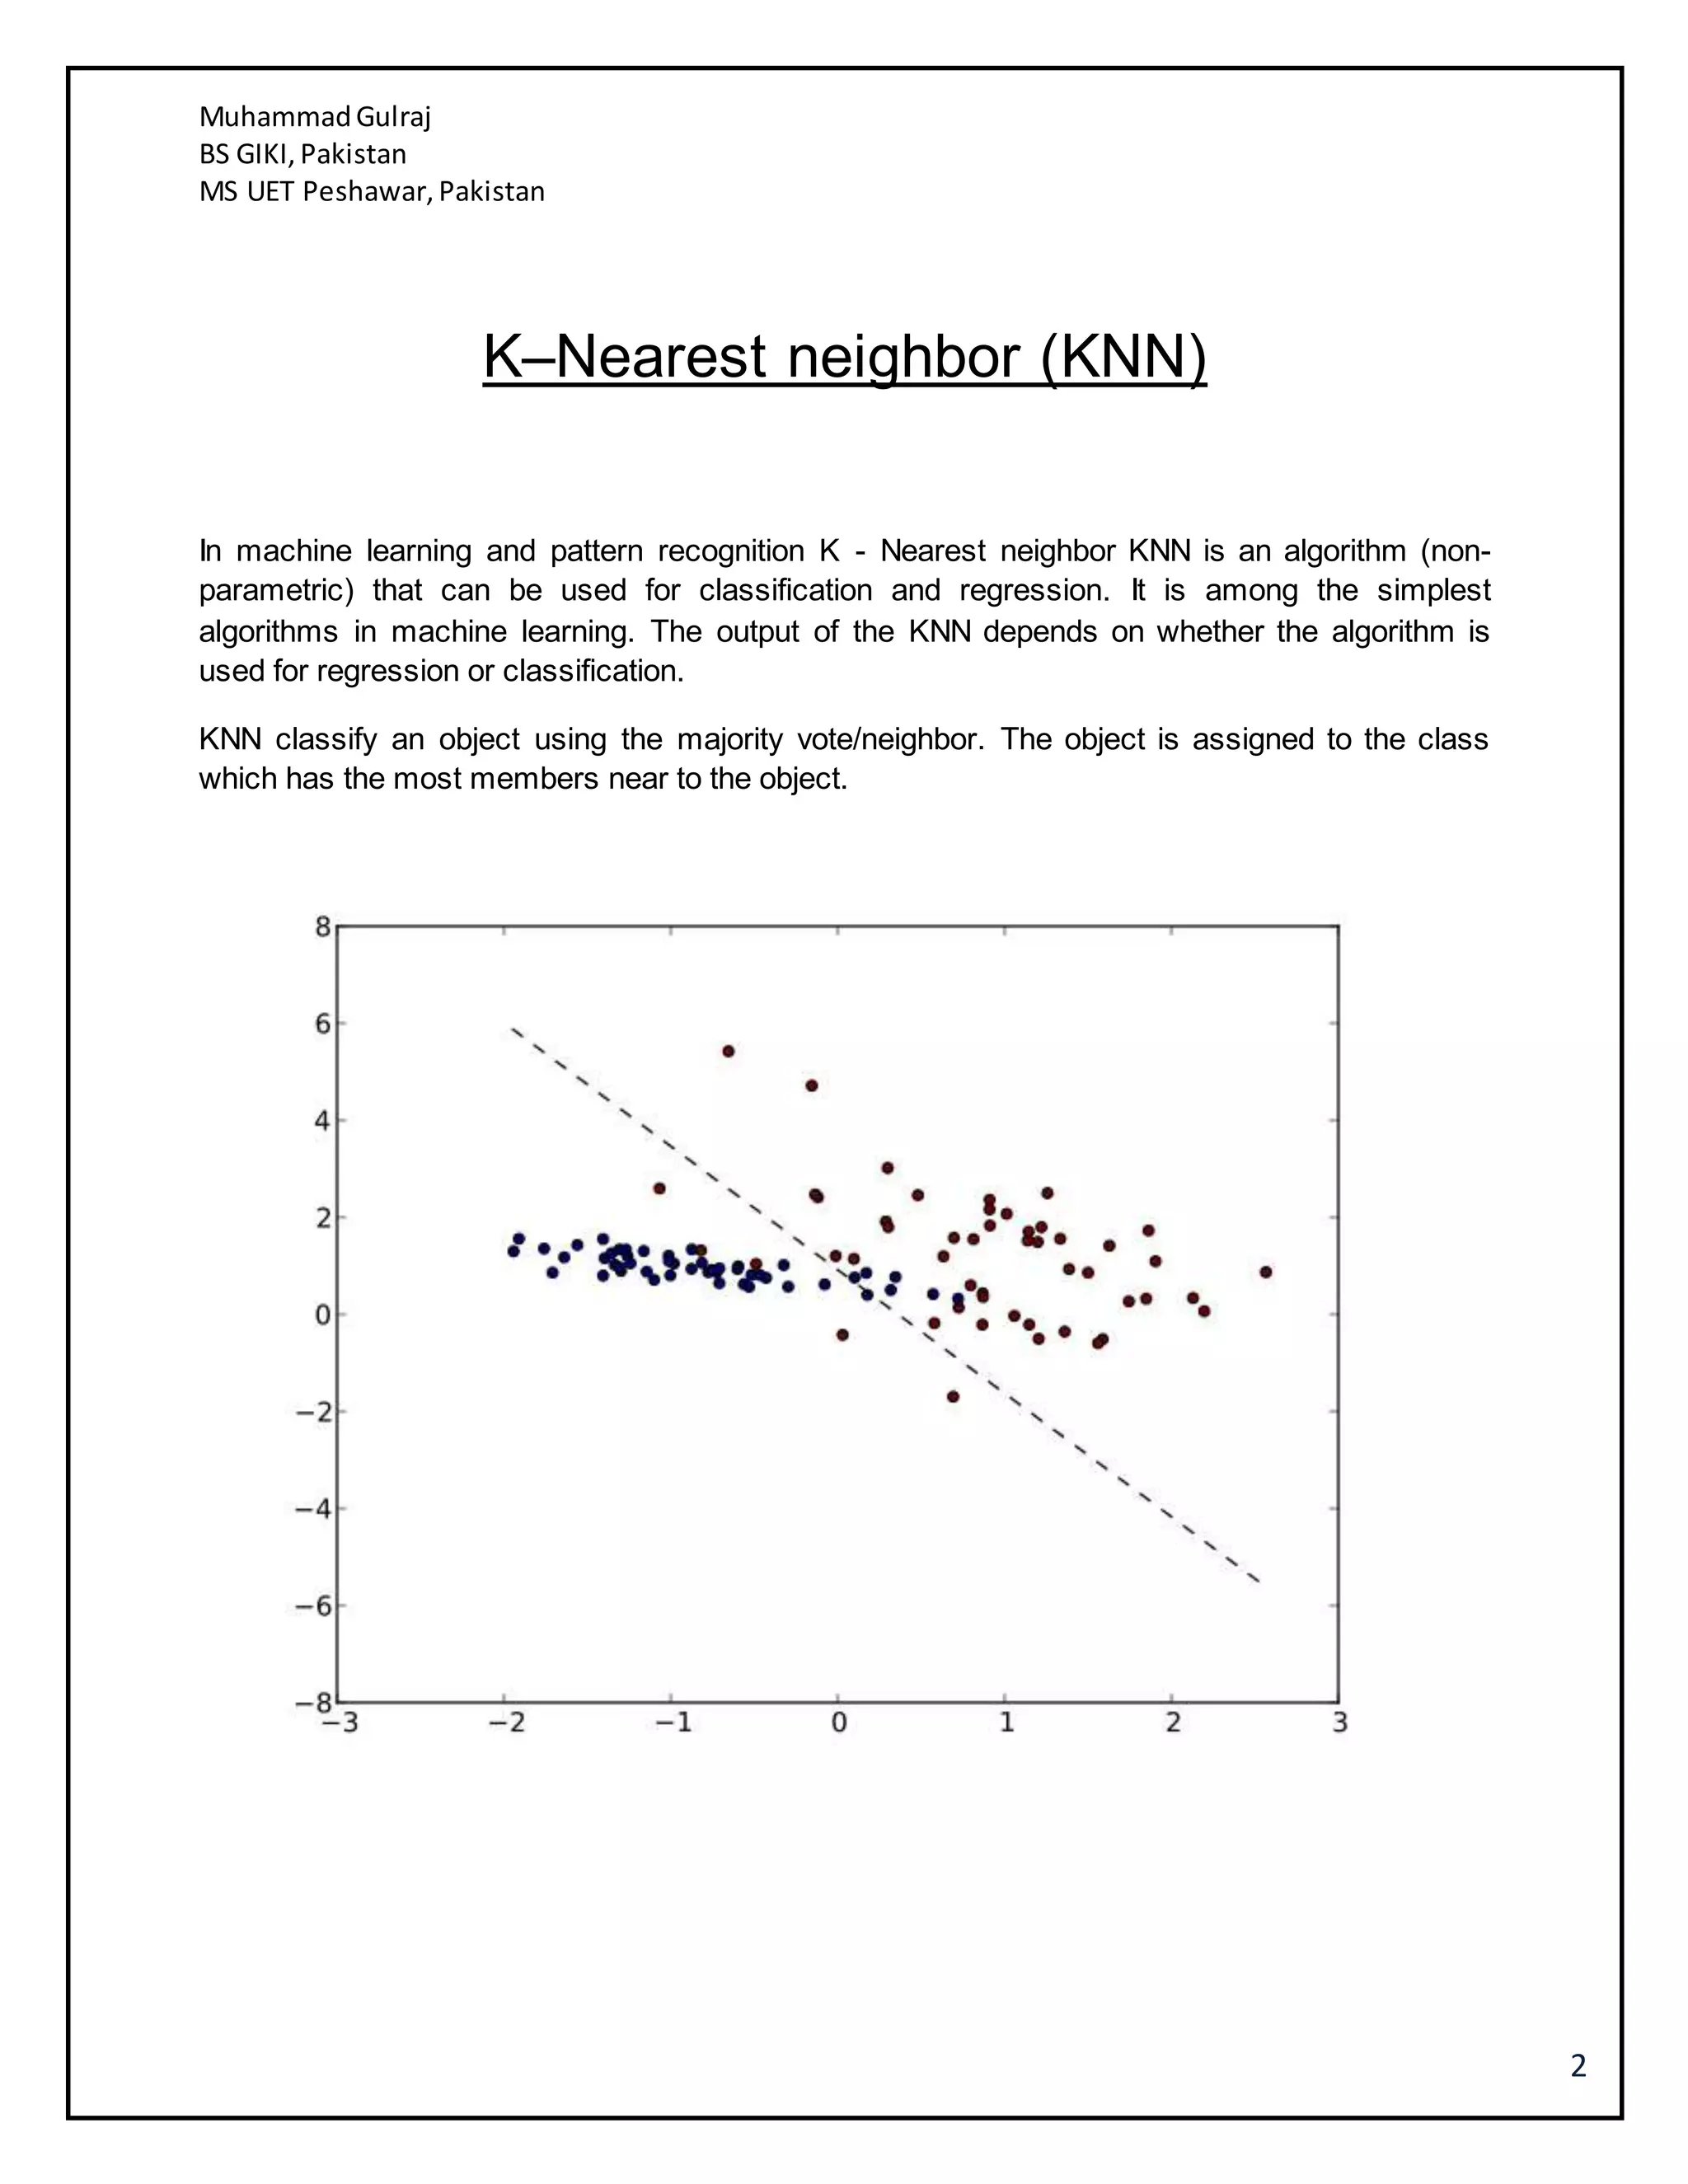
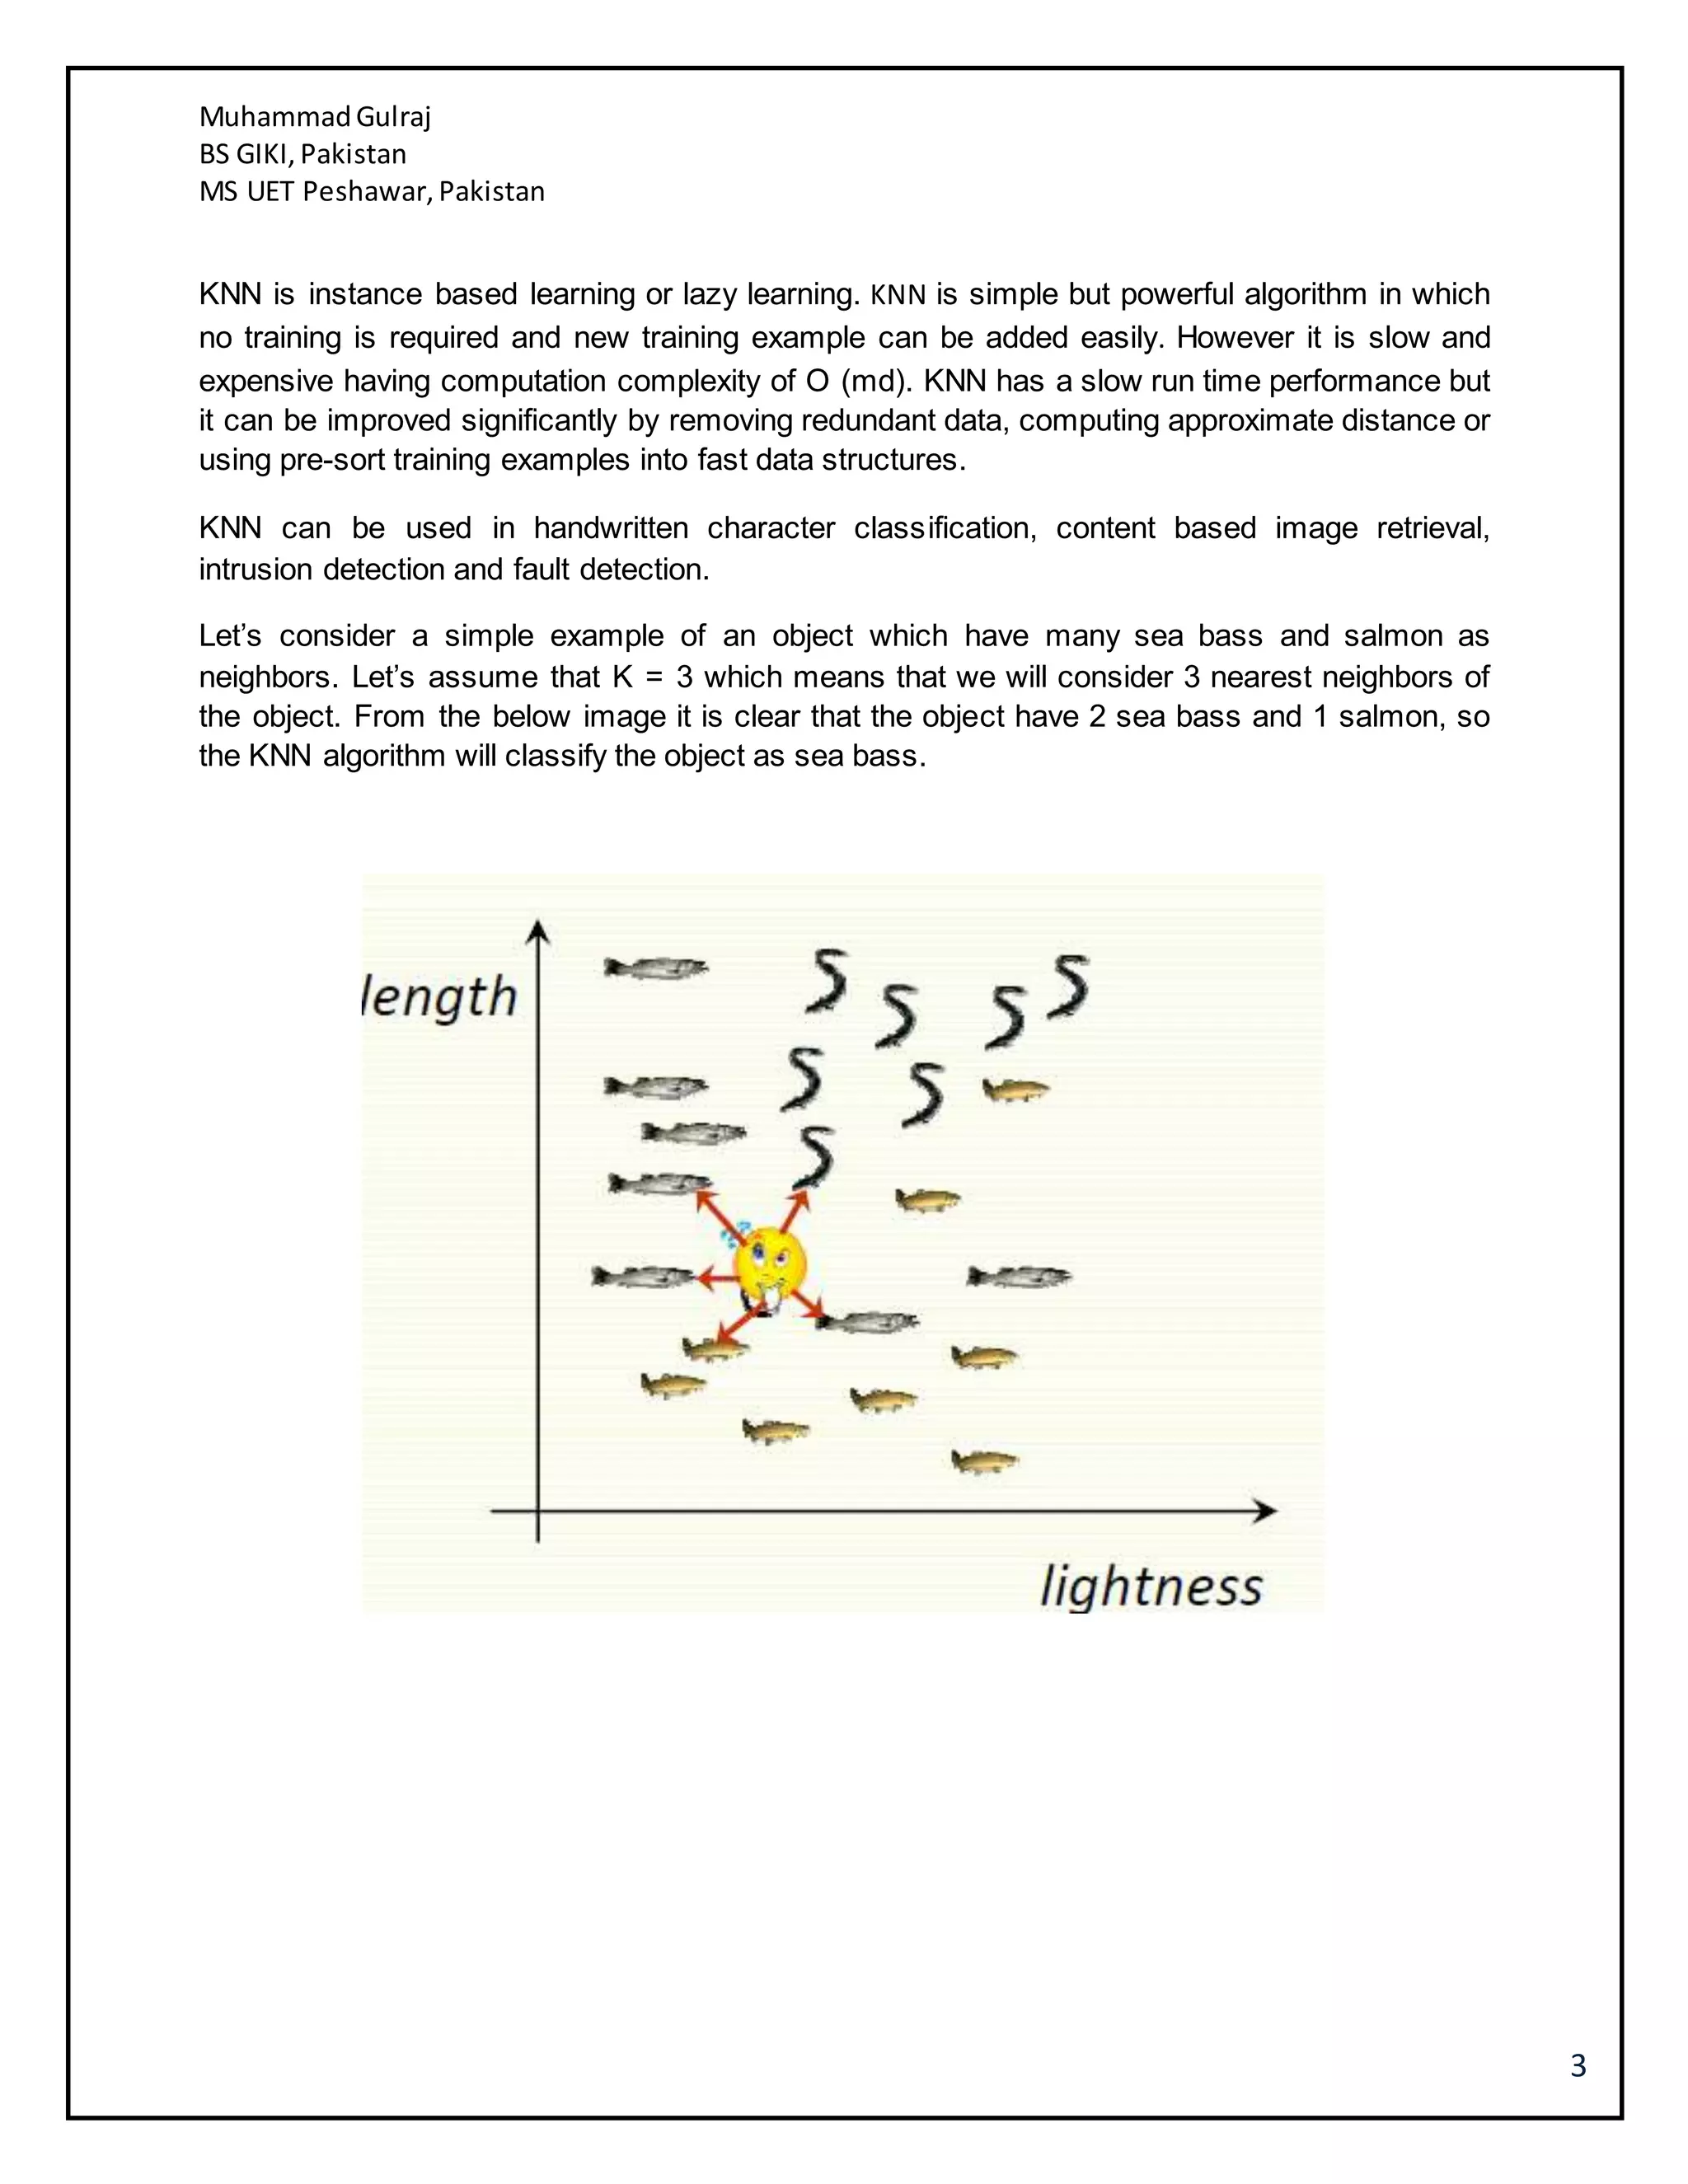
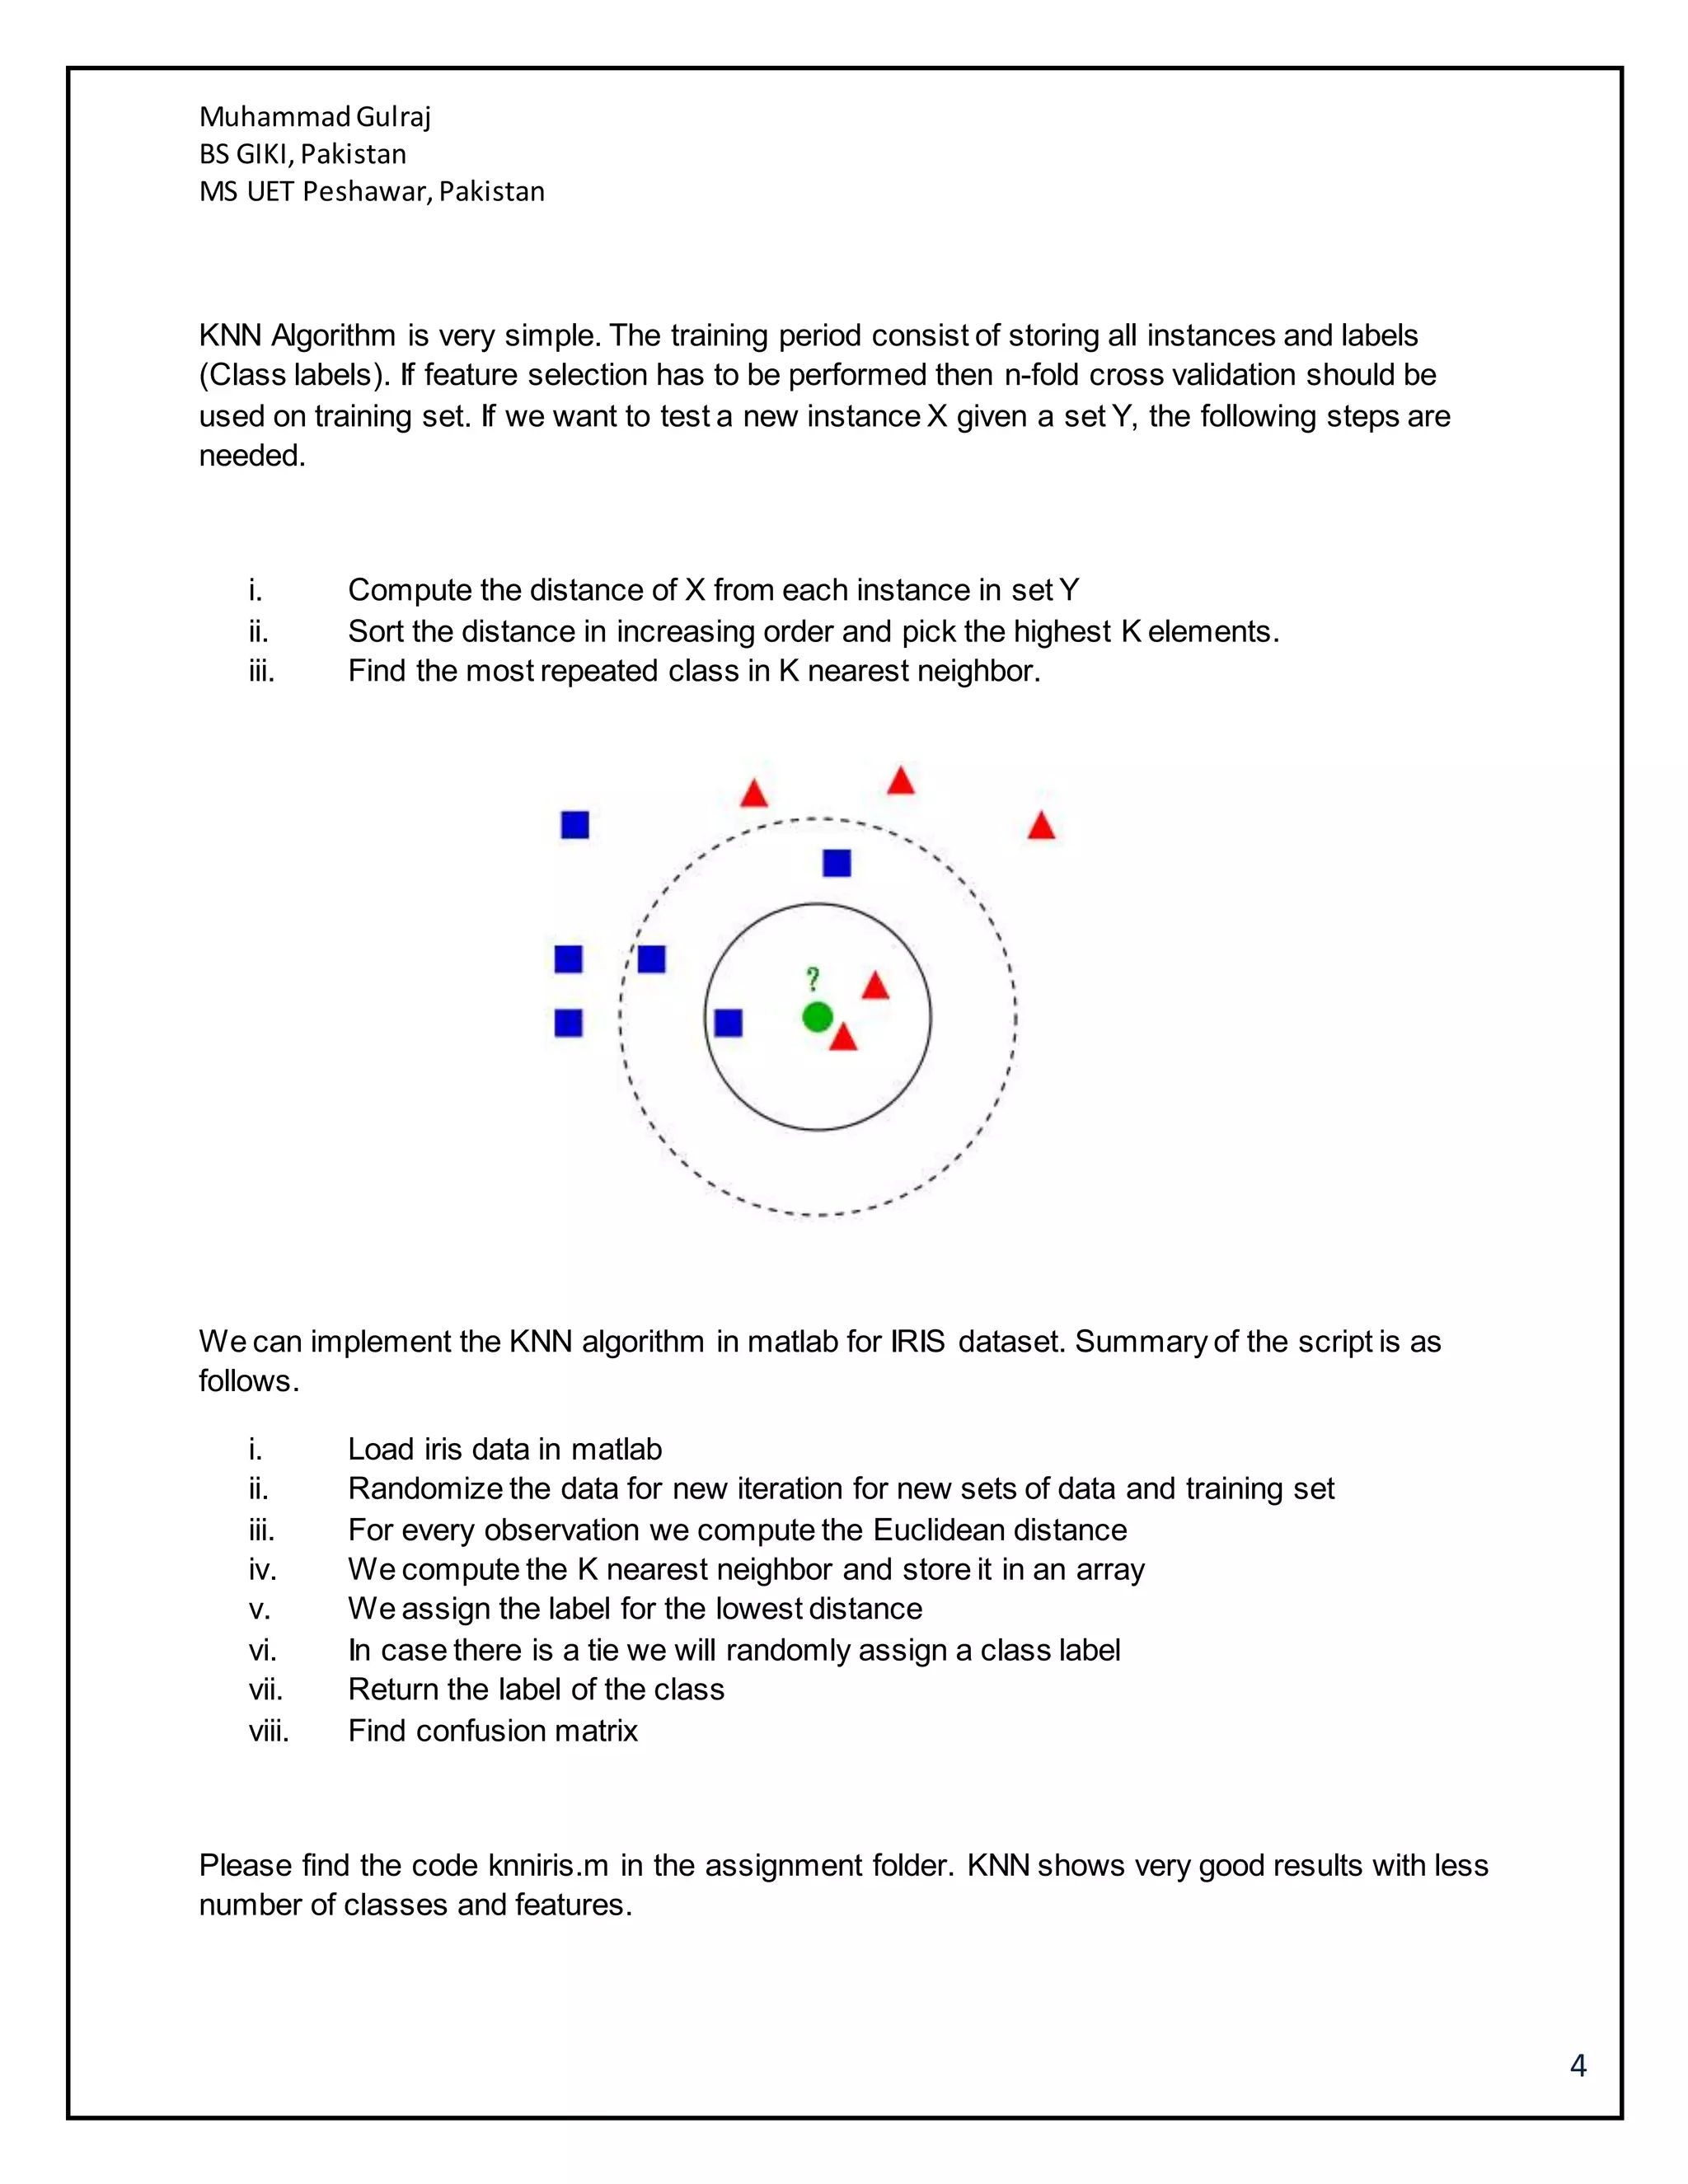
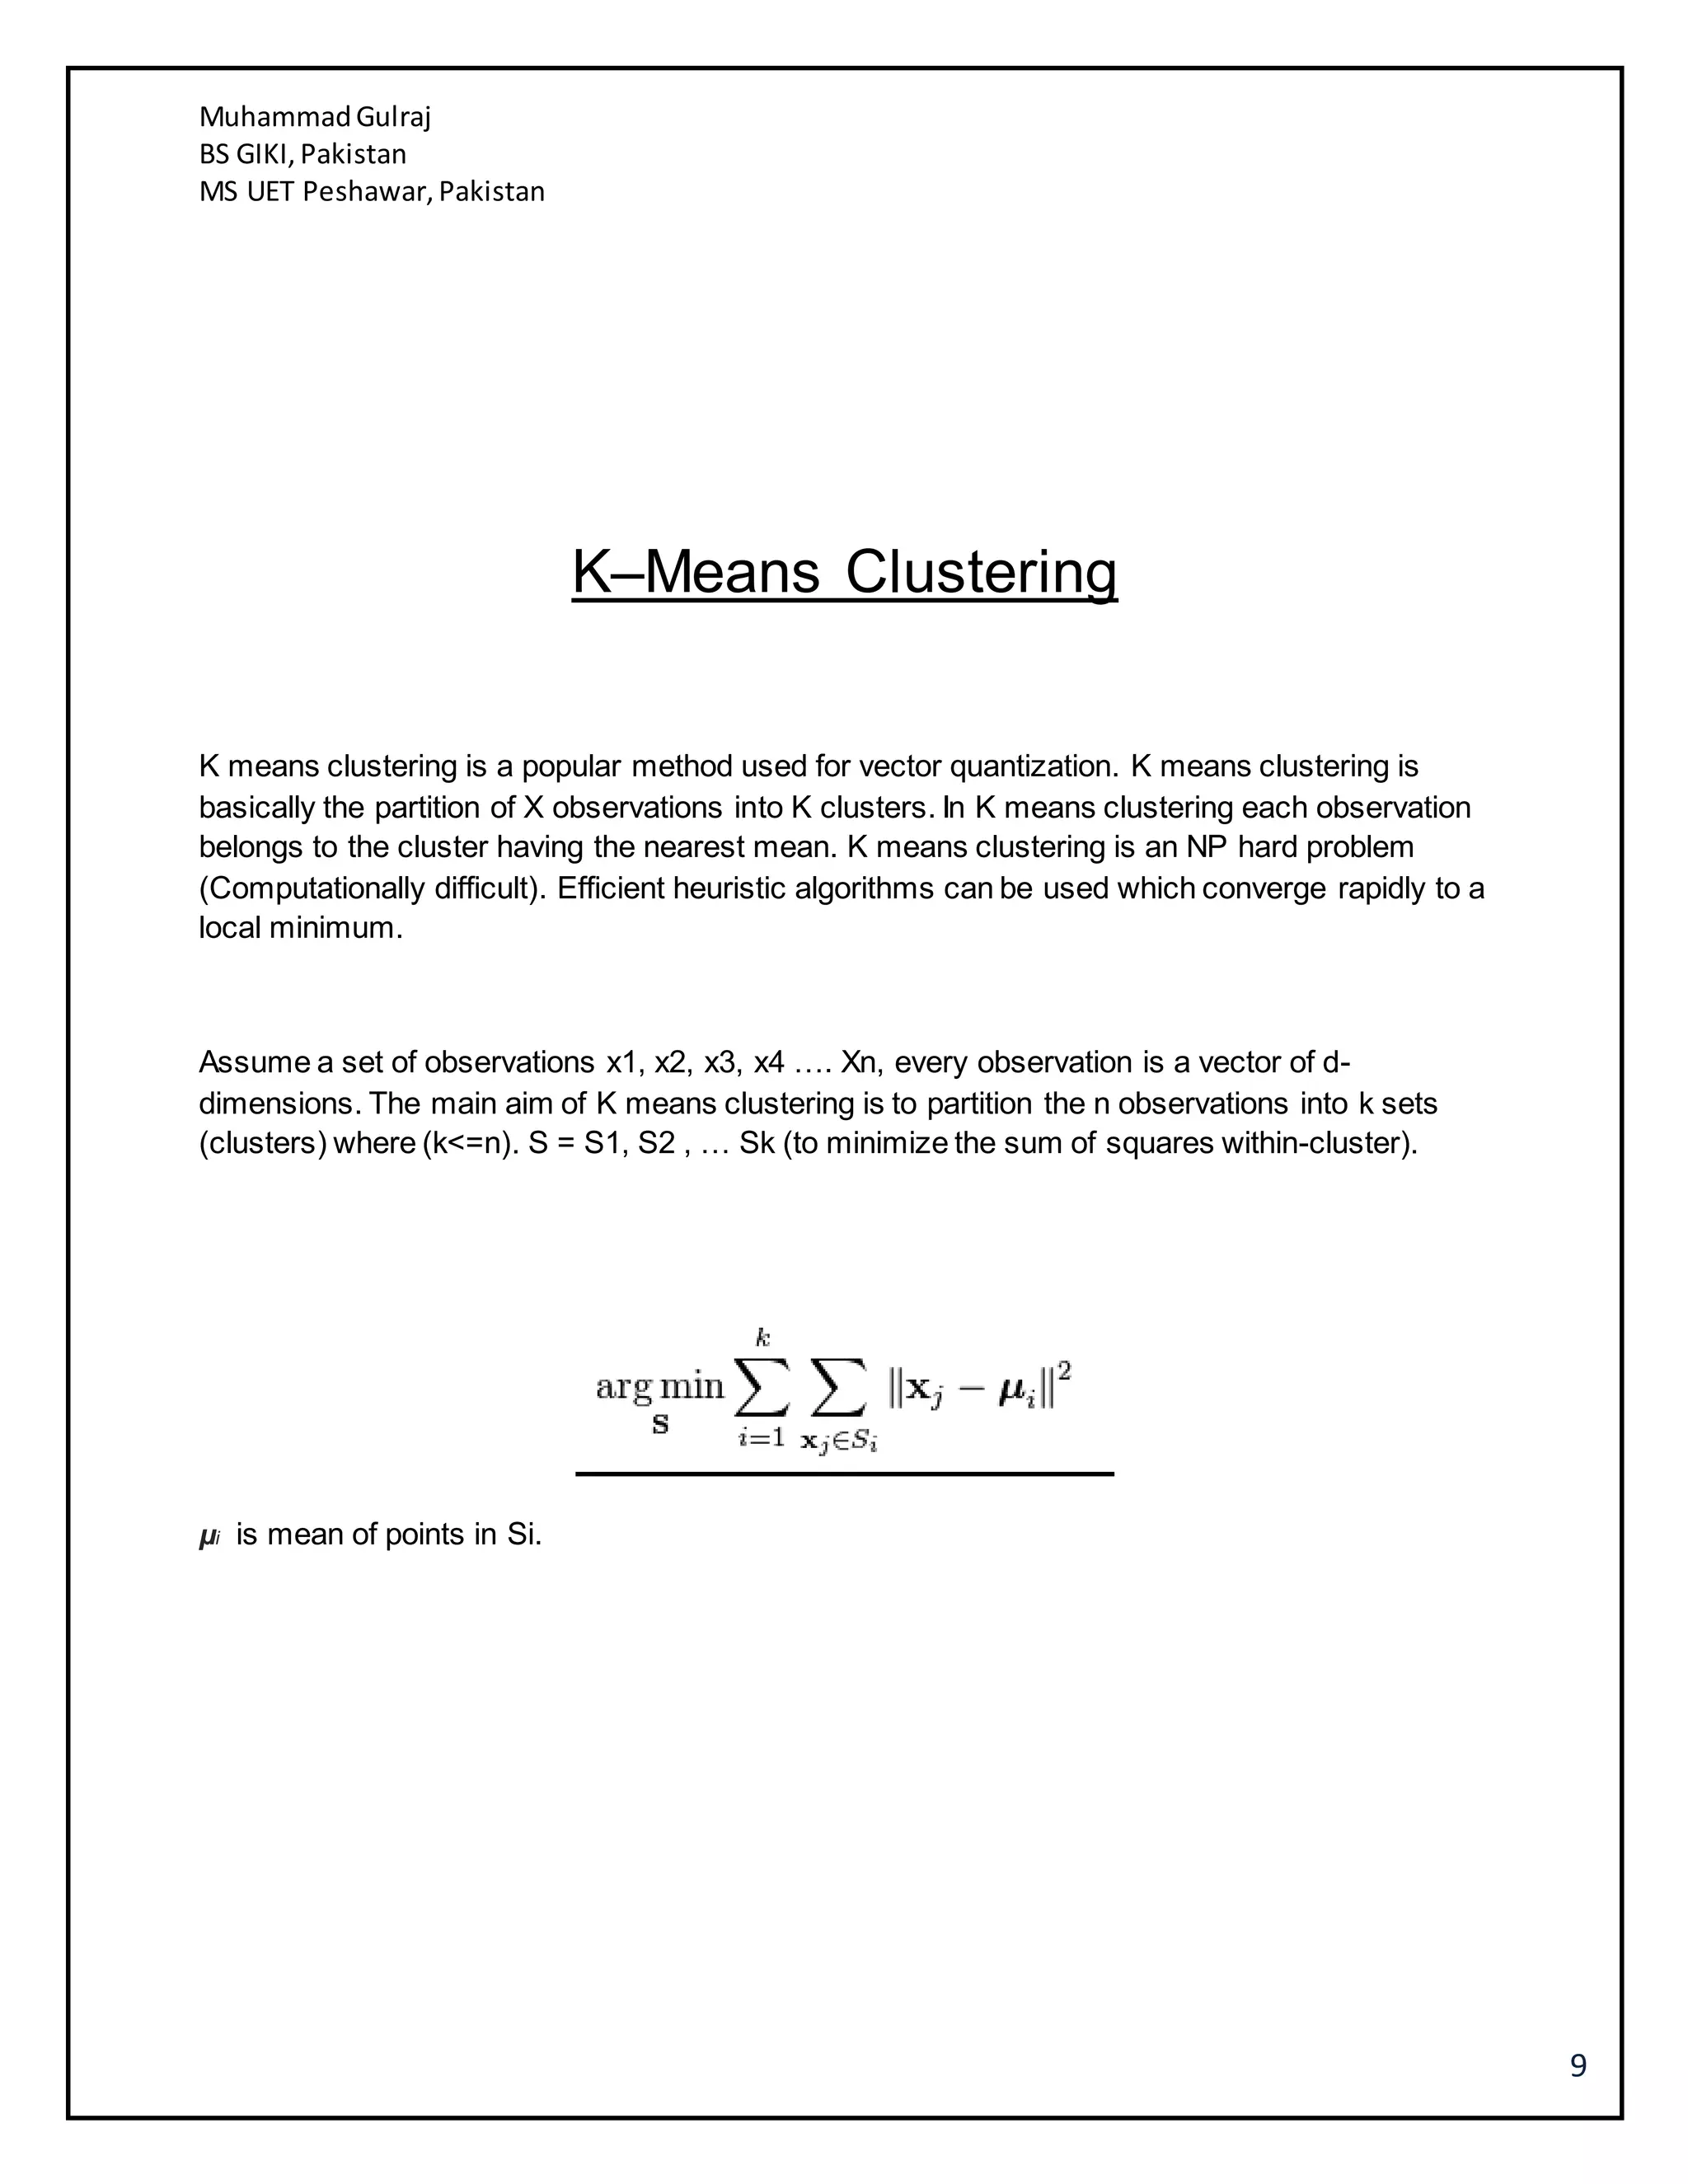
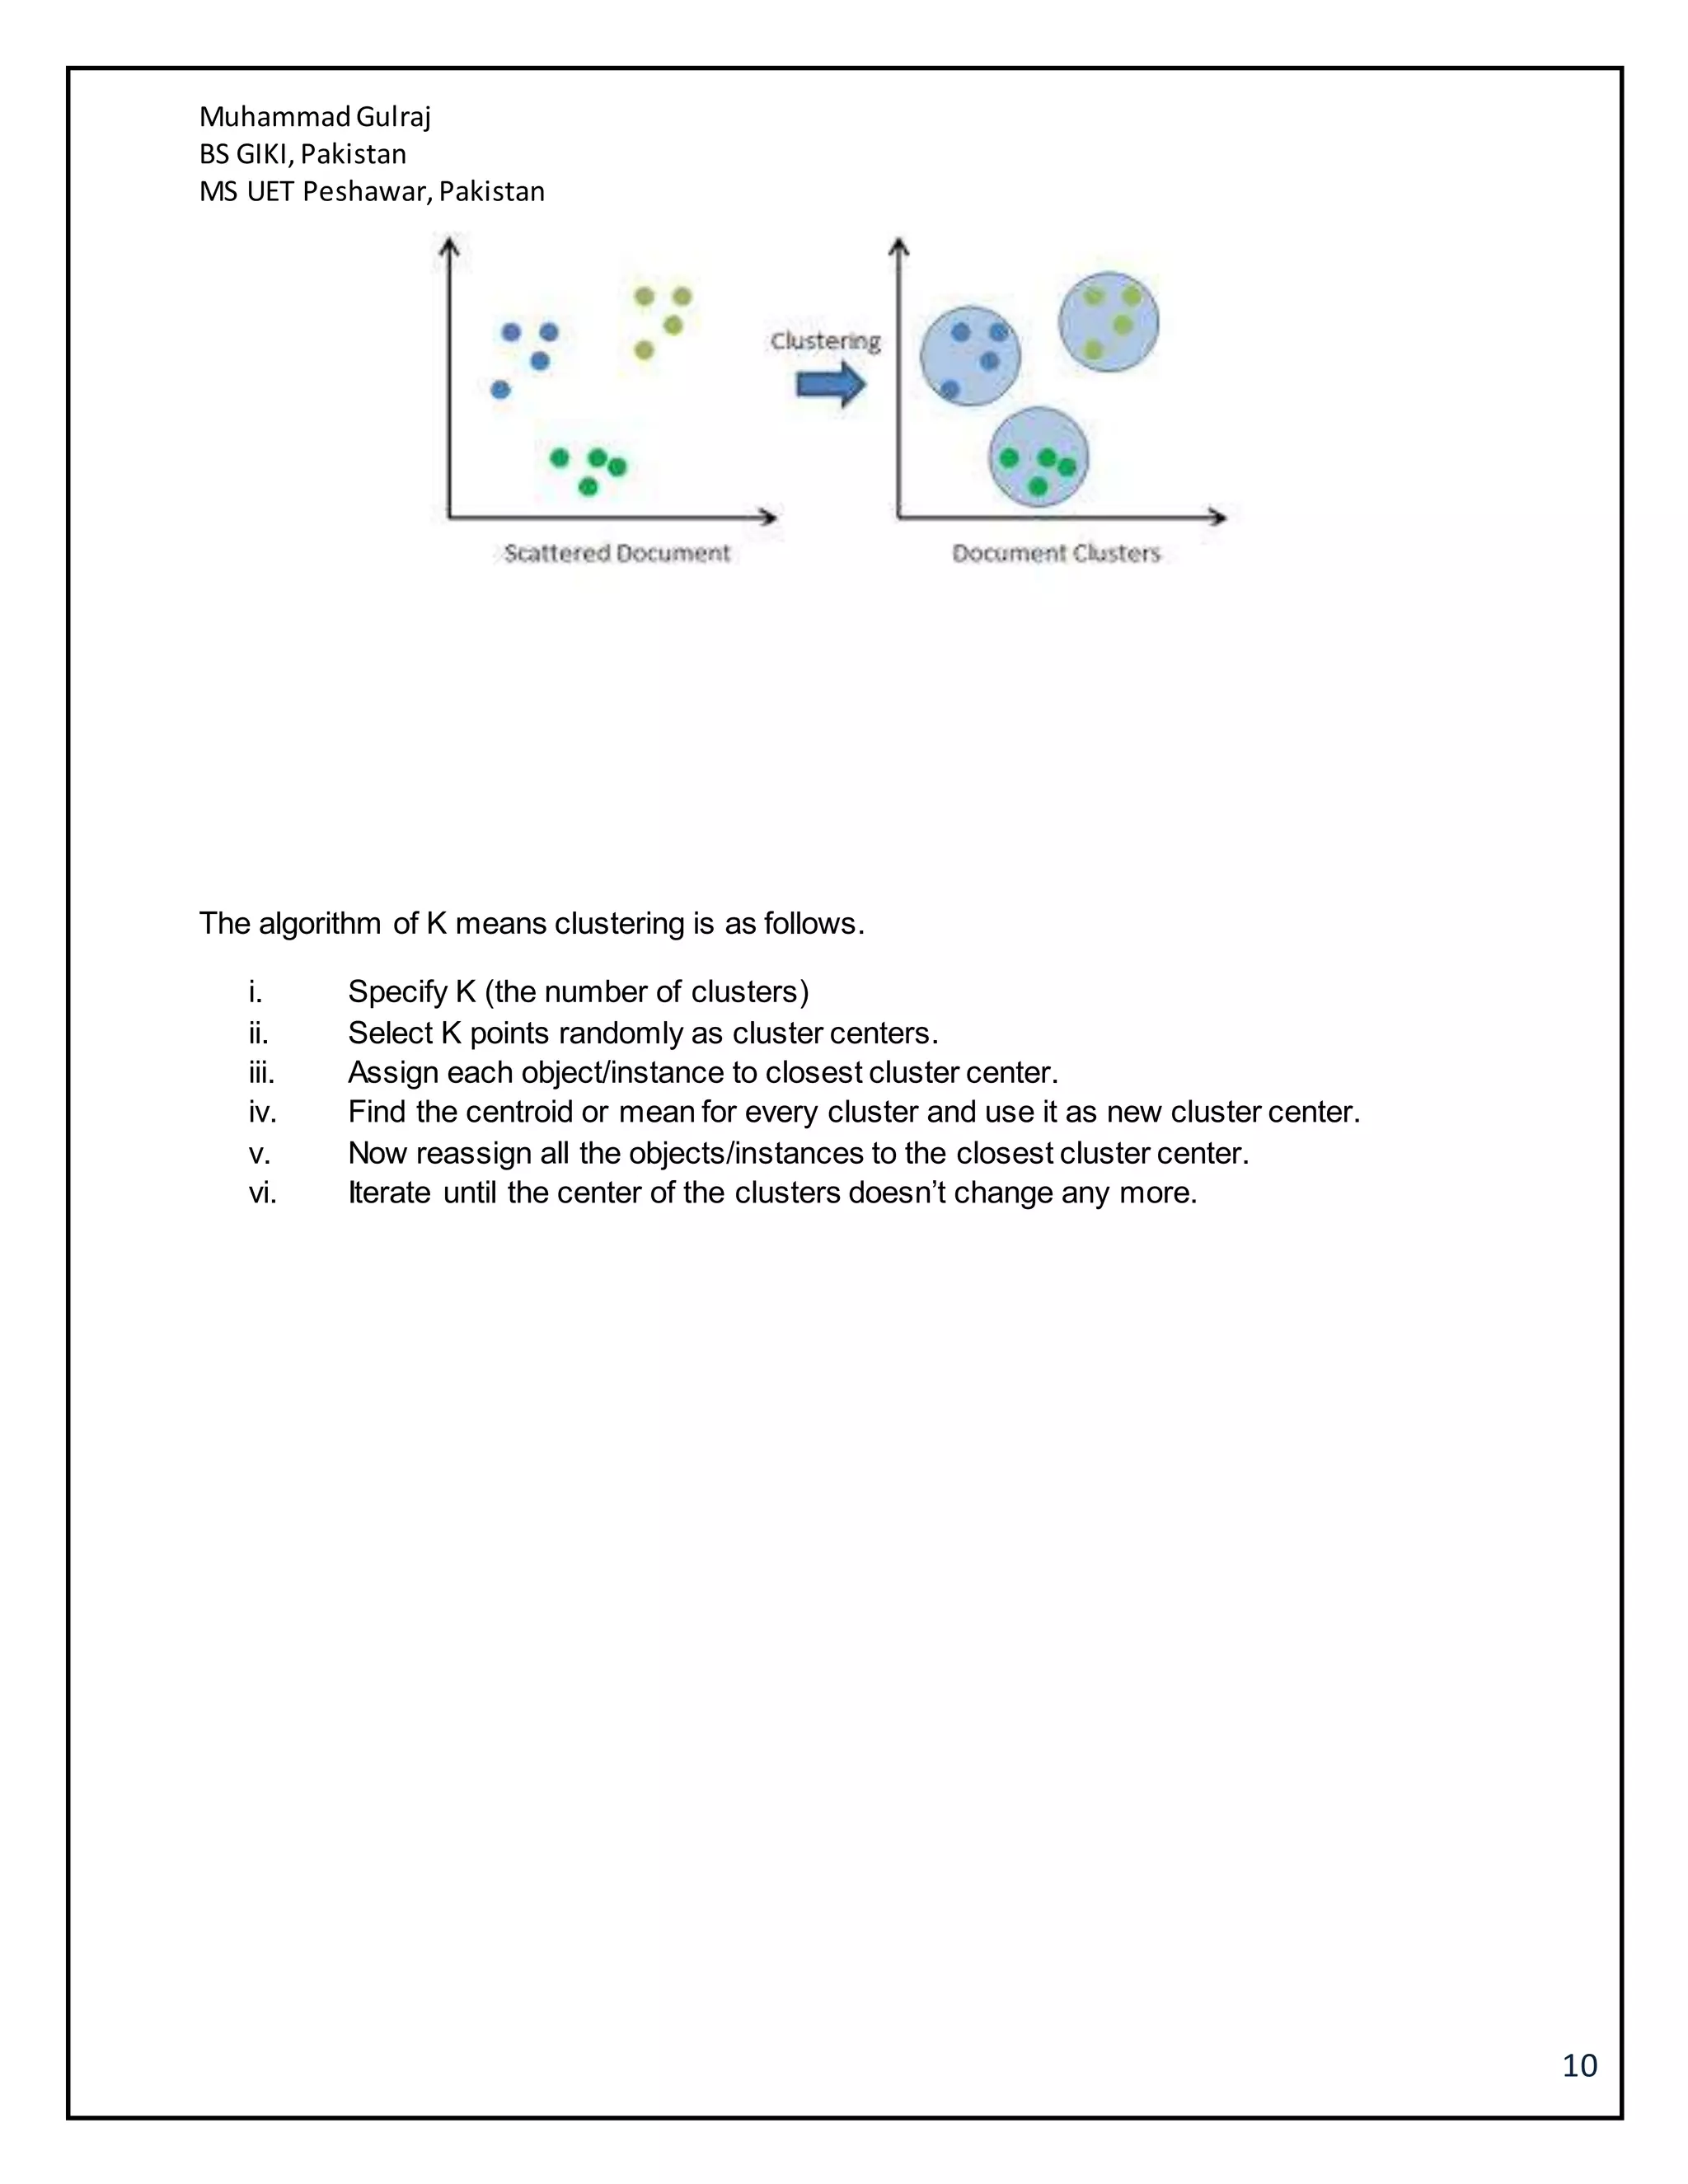
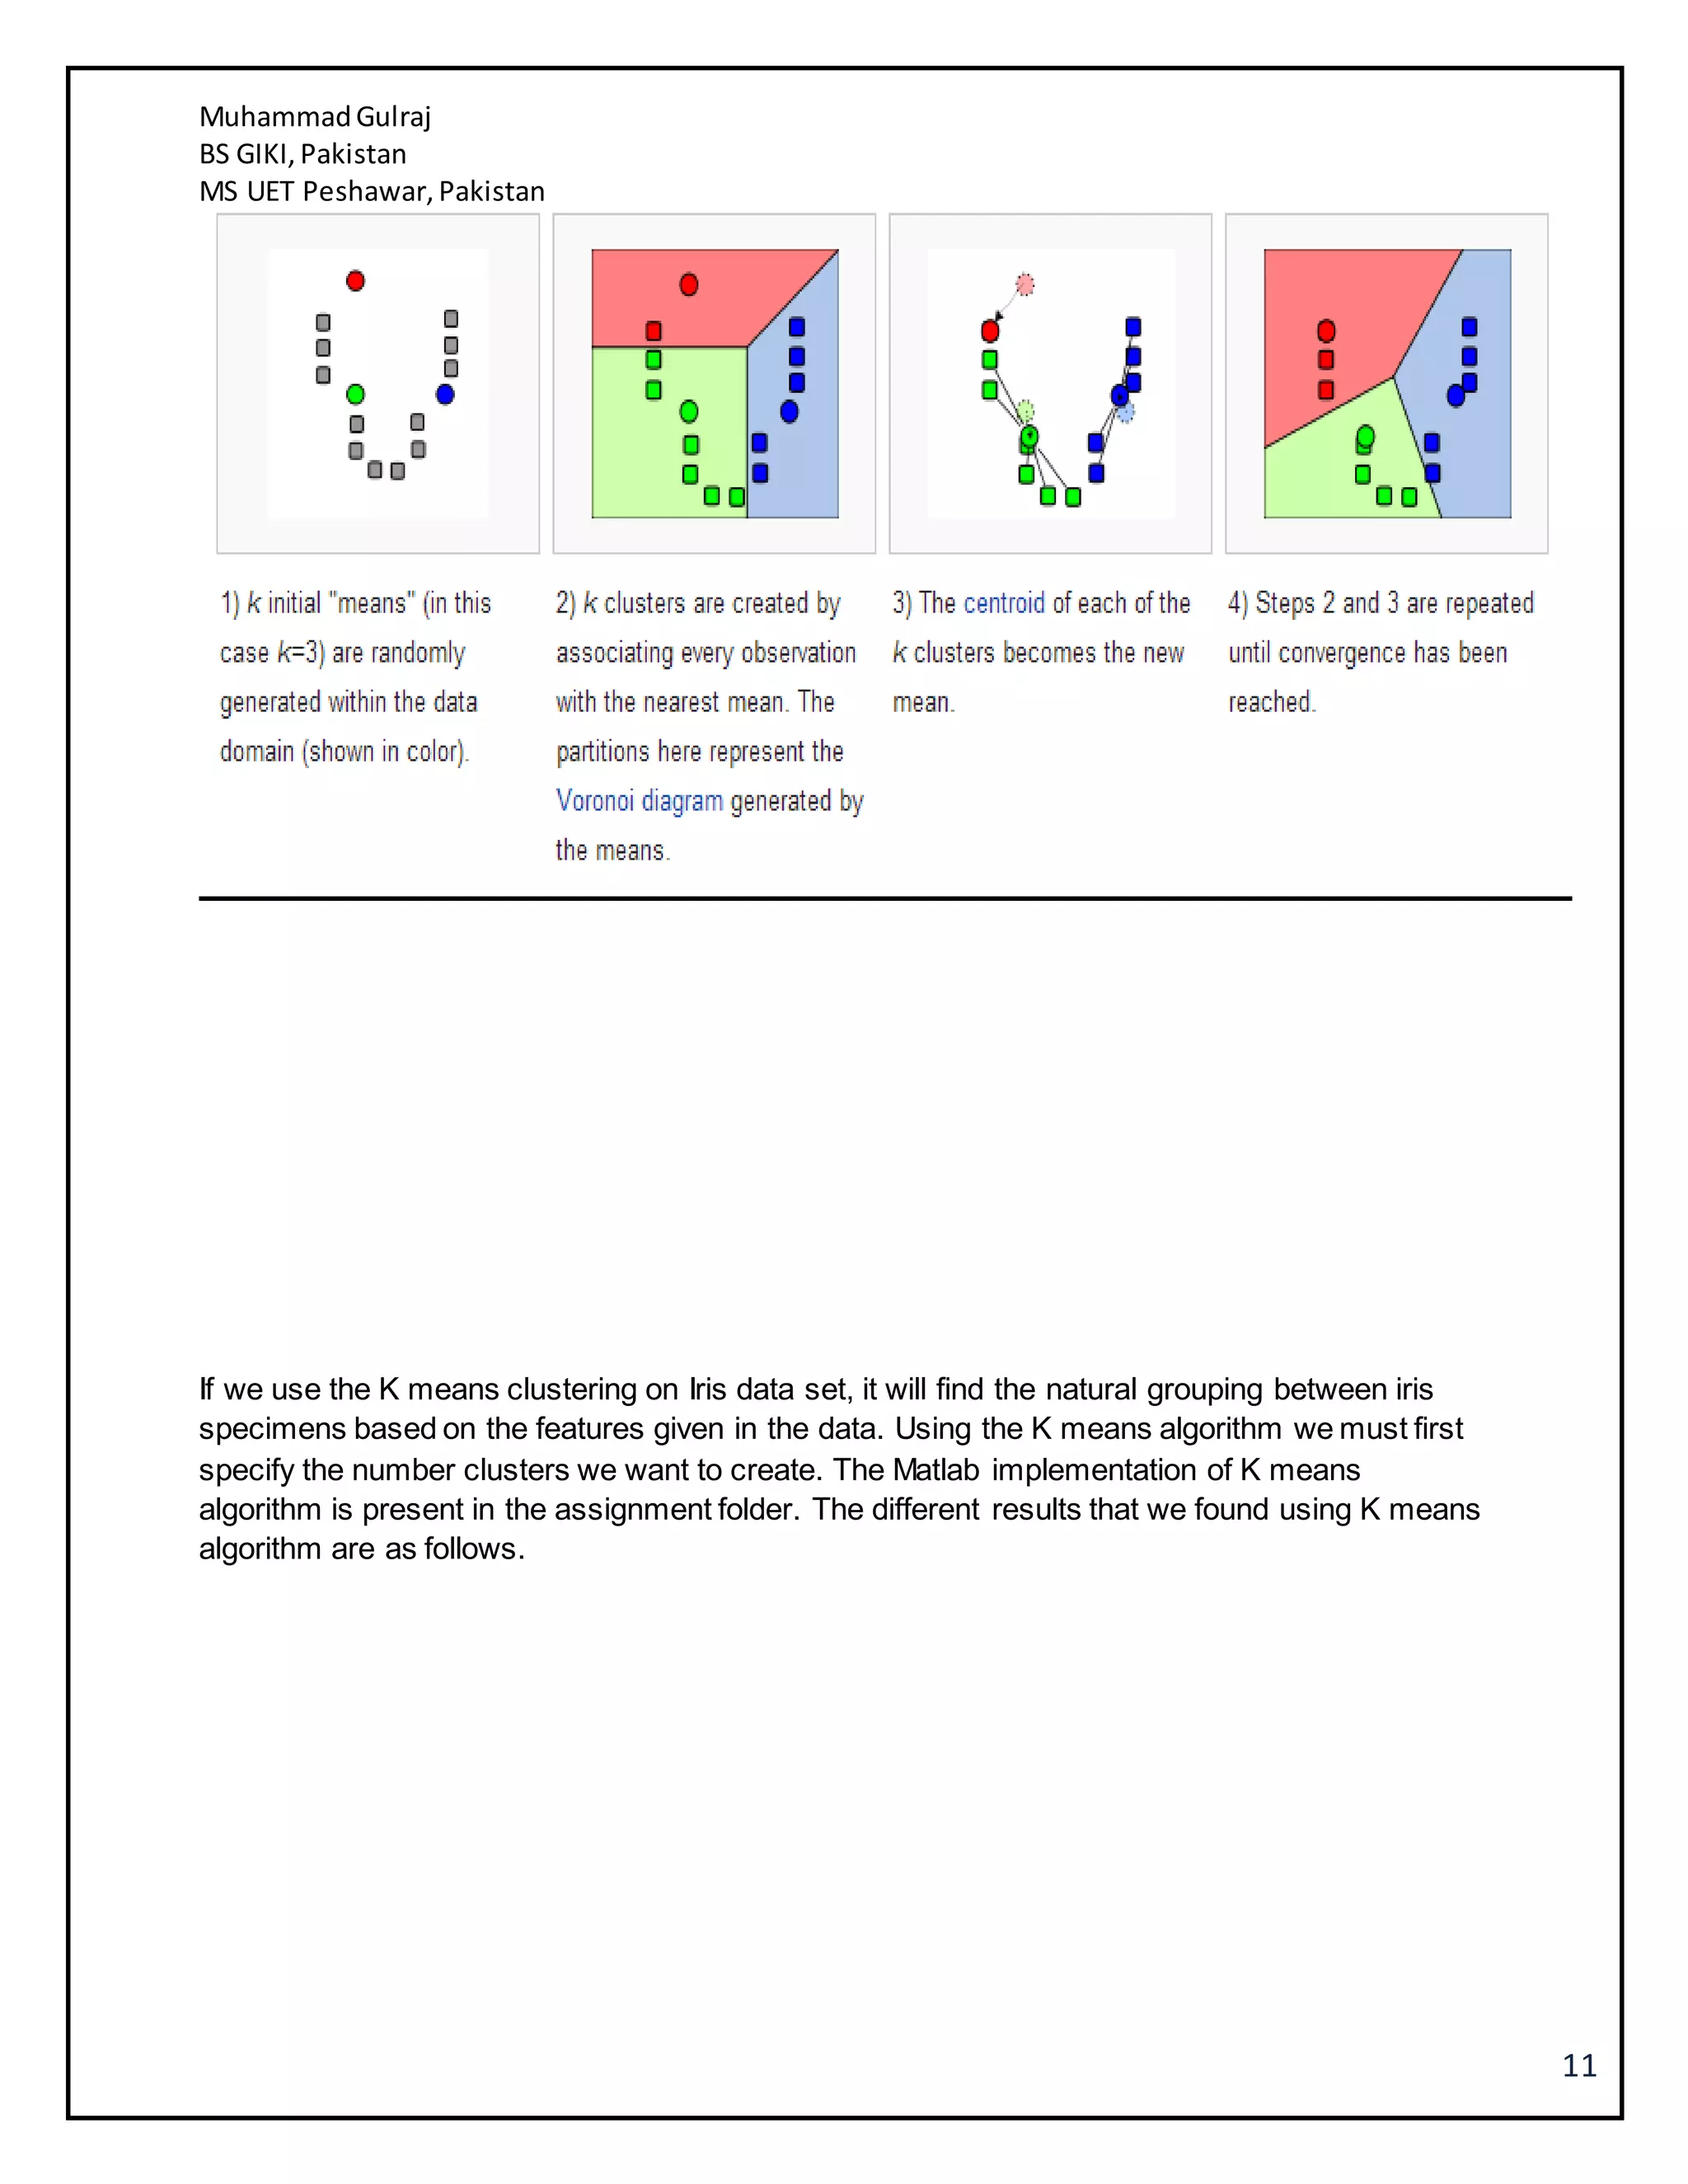
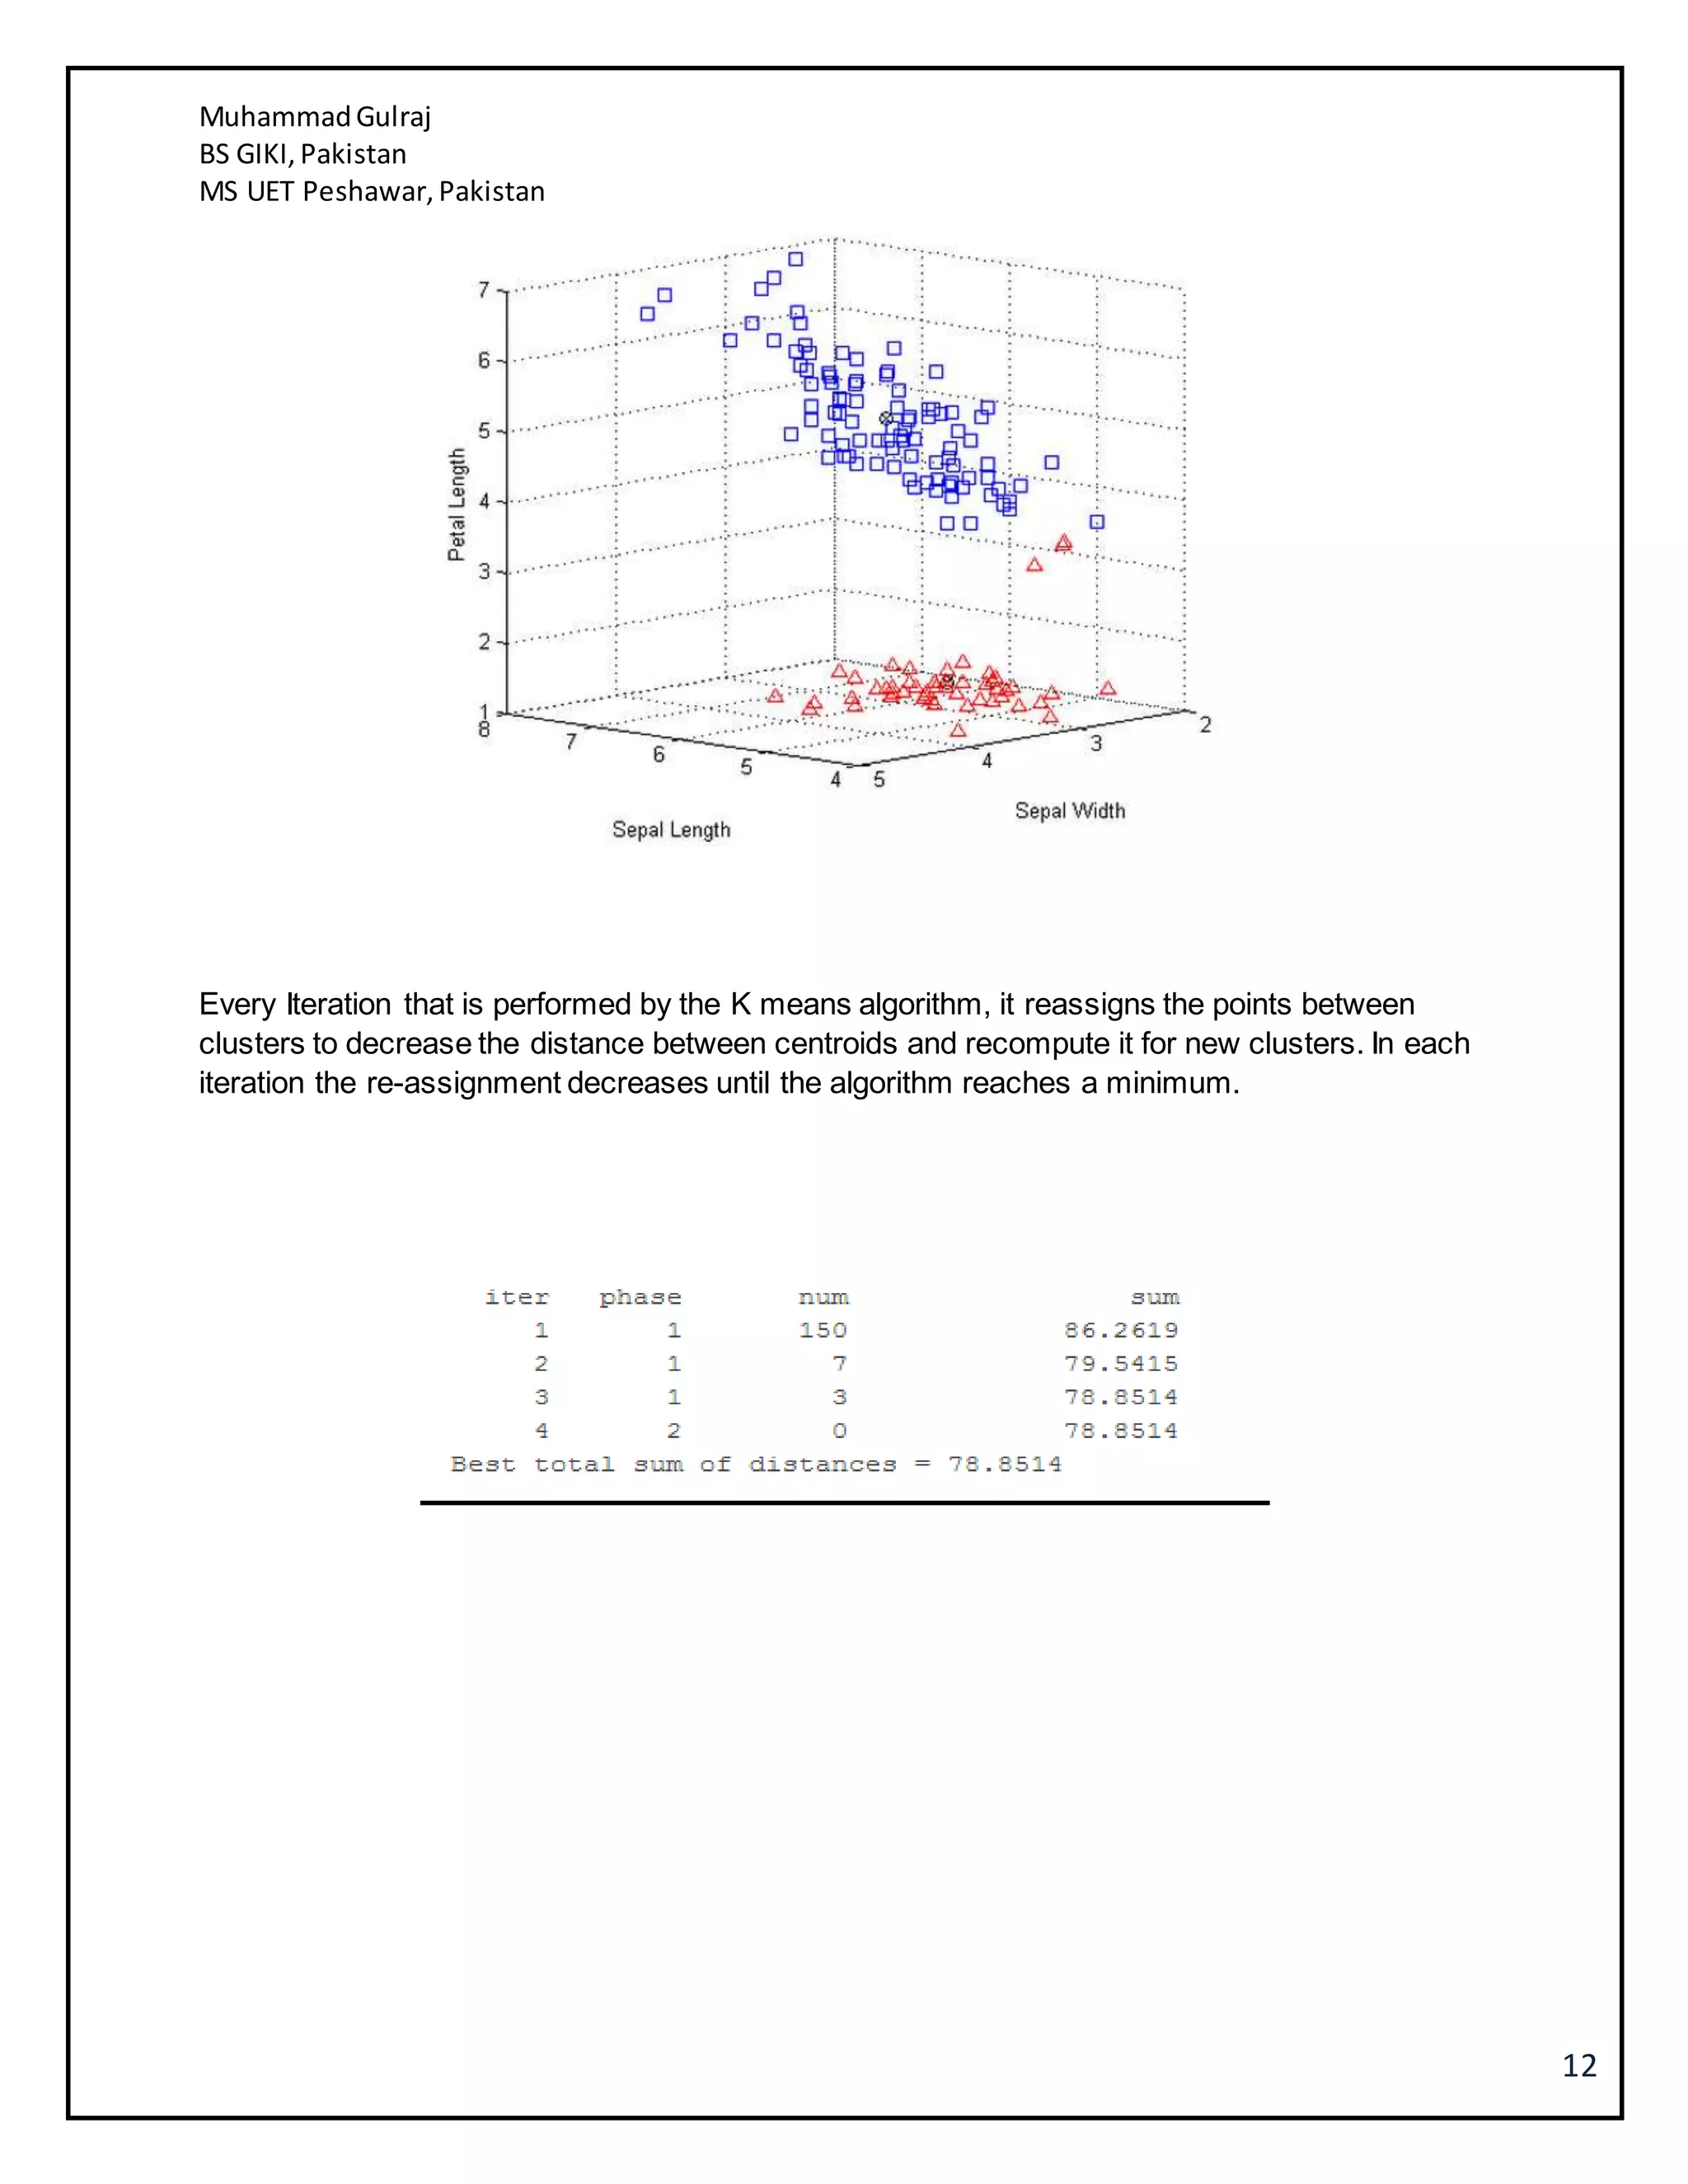
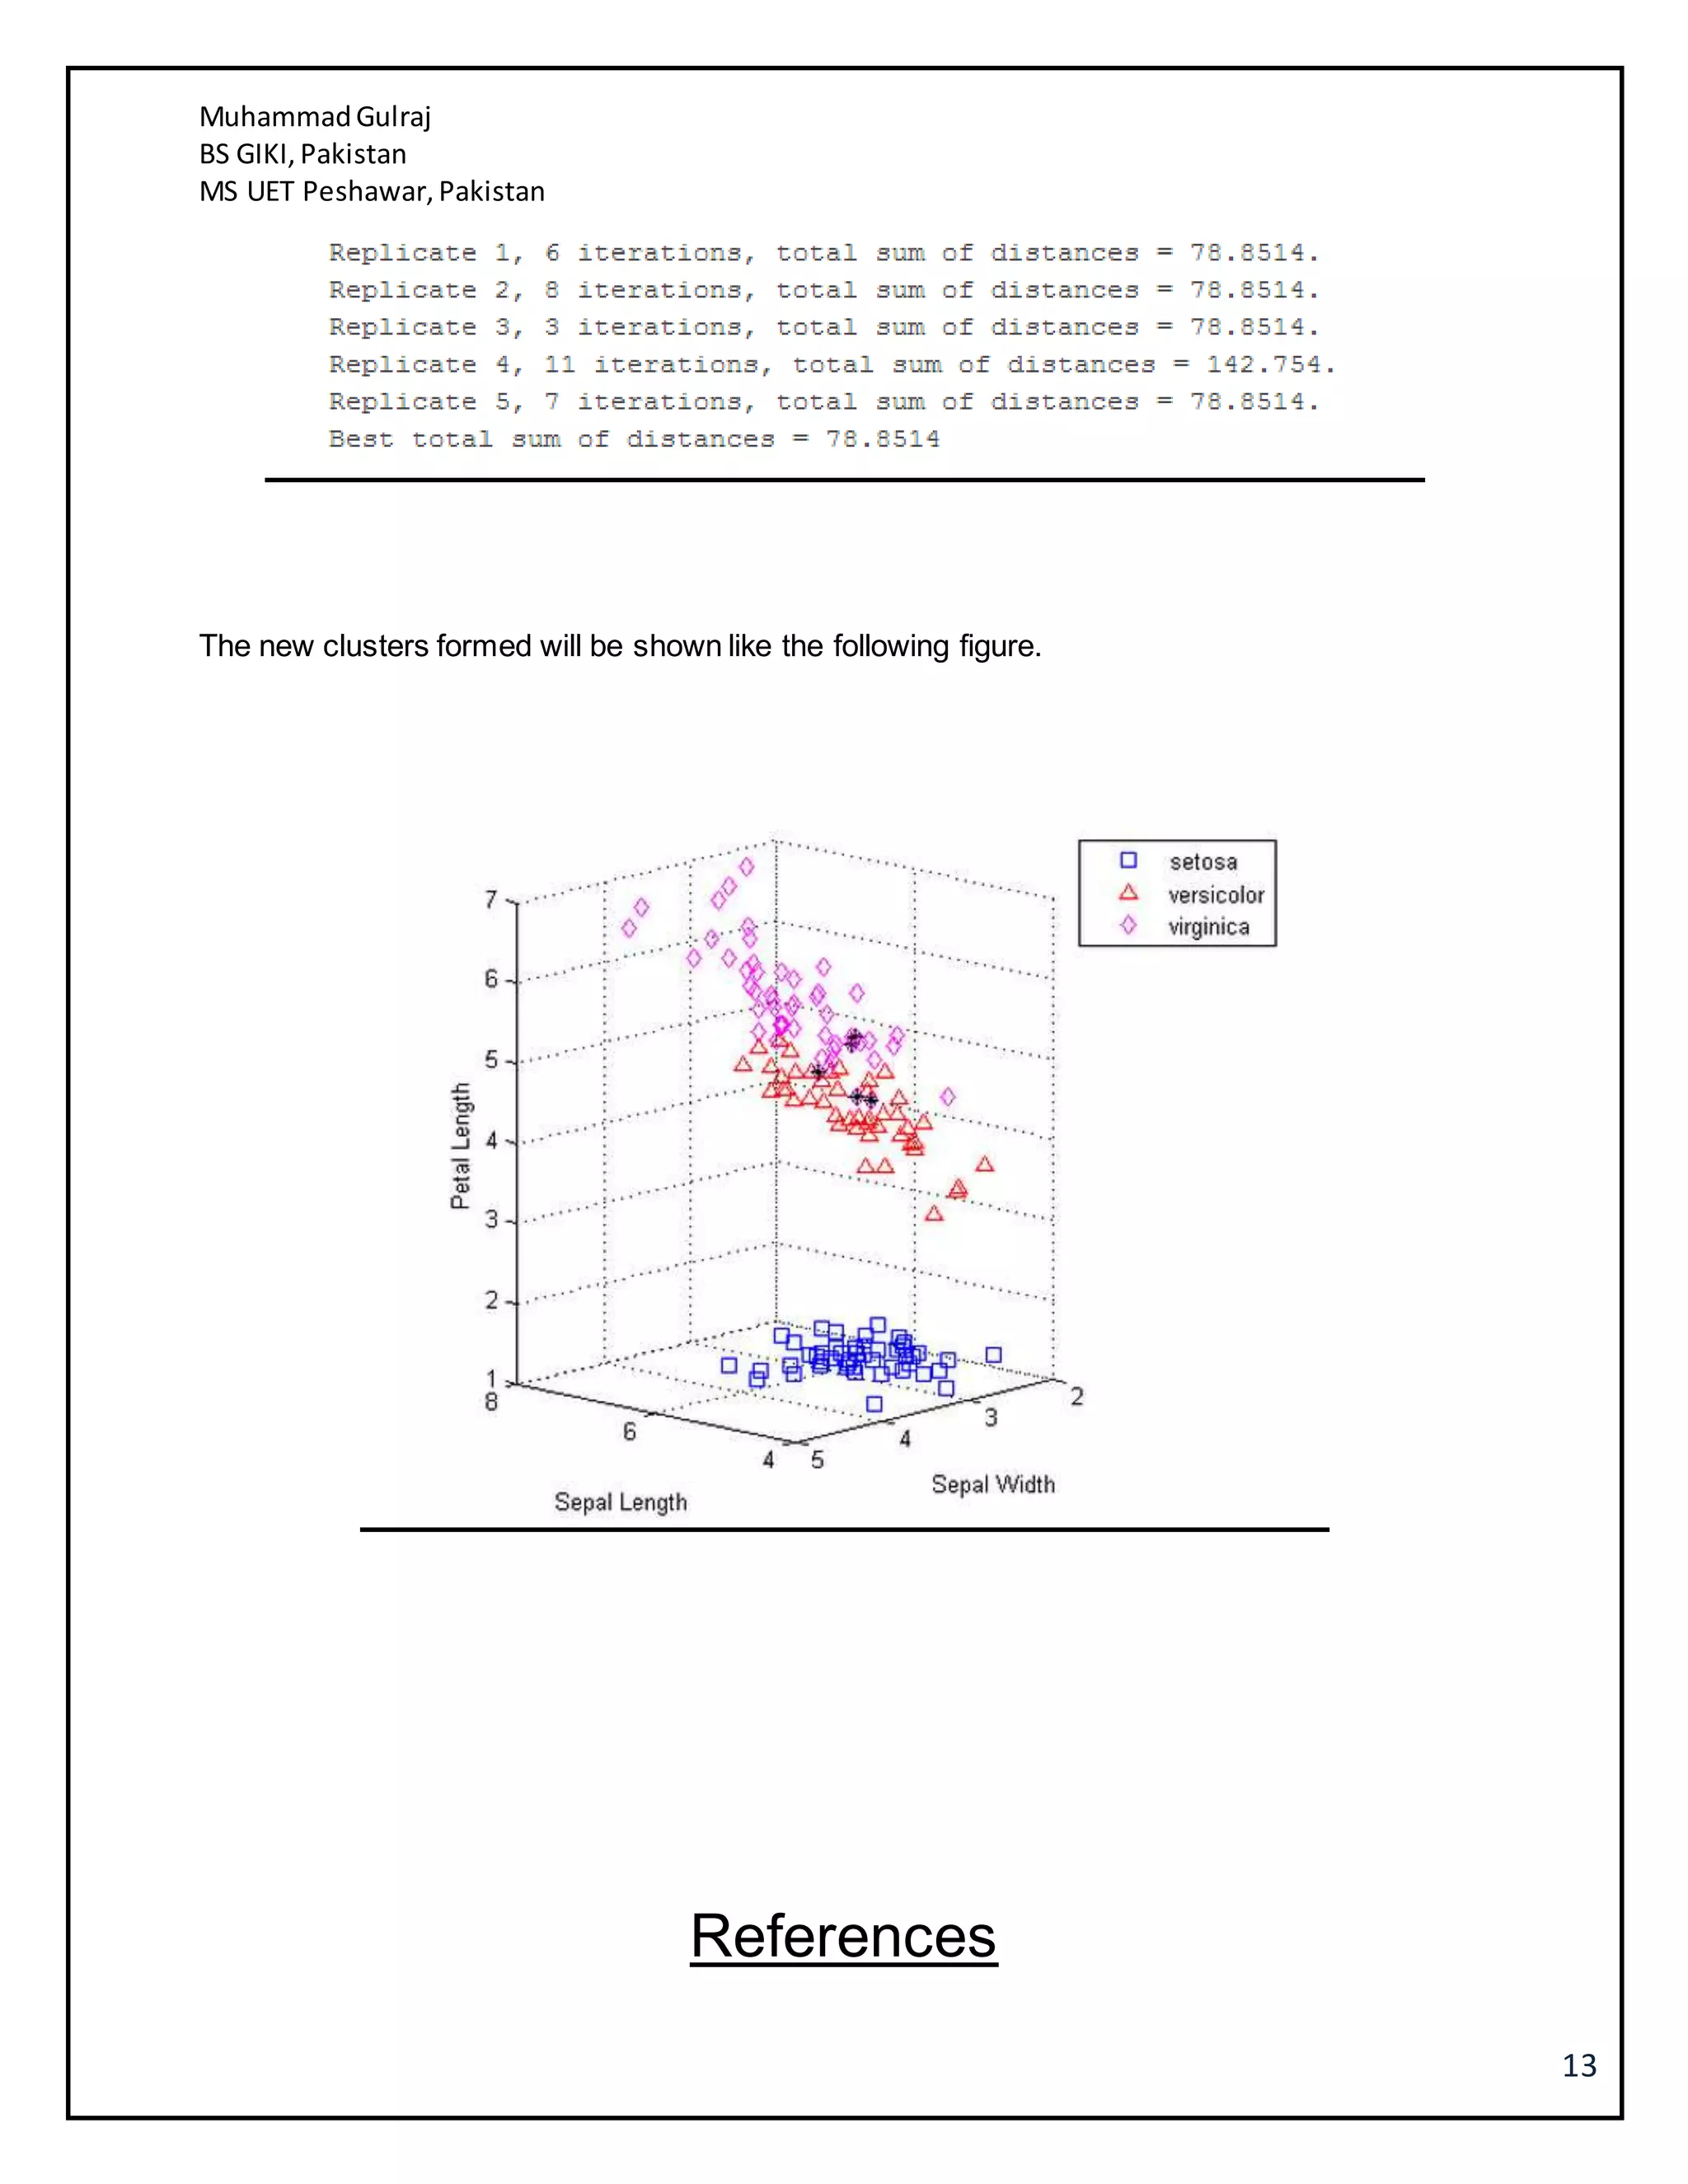
2. MuhammadGulraj
BS GIKI,Pakistan
MS UET Peshawar,Pakistan
2
K–Nearest neighbor (KNN)
In machine learning and pattern recognition K - Nearest neighbor KNN is an algorithm (non-
parametric) that can be used for classification and regression. It is among the simplest
algorithms in machine learning. The output of the KNN depends on whether the algorithm is
used for regression or classification.
KNN classify an object using the majority vote/neighbor. The object is assigned to the class
which has the most members near to the object.
3. MuhammadGulraj
BS GIKI,Pakistan
MS UET Peshawar,Pakistan
3
KNN is instance based learning or lazy learning. KNN is simple but powerful algorithm in which
no training is required and new training example can be added easily. However it is slow and
expensive having computation complexity of O (md). KNN has a slow run time performance but
it can be improved significantly by removing redundant data, computing approximate distance or
using pre-sort training examples into fast data structures.
KNN can be used in handwritten character classification, content based image retrieval,
intrusion detection and fault detection.
Let’s consider a simple example of an object which have many sea bass and salmon as
neighbors. Let’s assume that K = 3 which means that we will consider 3 nearest neighbors of
the object. From the below image it is clear that the object have 2 sea bass and 1 salmon, so
the KNN algorithm will classify the object as sea bass.
4. MuhammadGulraj
BS GIKI,Pakistan
MS UET Peshawar,Pakistan
4
KNN Algorithm is very simple. The training period consist of storing all instances and labels
(Class labels). If feature selection has to be performed then n-fold cross validation should be
used on training set. If we want to test a new instance X given a set Y, the following steps are
needed.
i. Compute the distance of X from each instance in set Y
ii. Sort the distance in increasing order and pick the highest K elements.
iii. Find the most repeated class in K nearest neighbor.
We can implement the KNN algorithm in matlab for IRIS dataset. Summary of the script is as
follows.
i. Load iris data in matlab
ii. Randomize the data for new iteration for new sets of data and training set
iii. For every observation we compute the Euclidean distance
iv. We compute the K nearest neighbor and store it in an array
v. We assign the label for the lowest distance
vi. In case there is a tie we will randomly assign a class label
vii. Return the label of the class
viii. Find confusion matrix
Please find the code knniris.m in the assignment folder. KNN shows very good results with less
number of classes and features.
5. MuhammadGulraj
BS GIKI,Pakistan
MS UET Peshawar,Pakistan
5
Correctly classified 149
Incorrectly classified 1
Mean error 0.008
Relative absolute error 1.9%
Root mean squared error 0.009
Total instances 150
Confusion matrix a b c
setosa 50 0 0
vericolor 0 50 0
virginica 0 0 49
The detailed analysis shows that the KNN classifier makes very few mistakes in a dataset that is
simple, although not linearly separable.
6. MuhammadGulraj
BS GIKI,Pakistan
MS UET Peshawar,Pakistan
6
Bayes Classifier
Bayesian Theorem (Bayes Rule, Bayes Law) is the result of mathematical manipulation of
conditional probabilities in probability and statistics. Bayesian classification rule provides a
mathematical rule for updating the existing belief when find new evidence. Mathematically we
can show it as:
This rule can be explained by a simple example of a new born who observe a sun set and
wonders if the sun will rise again tomorrow. The new born will assign equal probabilities (0.5,
0.5) to both outcomes. When the sun rise next day, the probability of sun rise will increase from
0.5 to 0.66 and thus the child’s belief that the sun will rise again increases. This process will
continue and the child’s belief that the sun will rise again, increases from fifty percent probability
to a universal truth.
Another example is, assume someone told you that he had a nice conversation with someone
on a bus. Knowing nothing about the conversation, the probability that the person had a
conversation with a woman is 50% and the probability that the conversation was with a man is
50%. Suppose that the person also told you that the conversational partner had long hair. Thus
the probability that the conversational partner is a woman increases because most of women
(75%) have long hair. Similarly more features or evidences can increase the existing belief and
can help you in deciding whether the conversational someone was ‘man’ or a ‘woman’.
7. MuhammadGulraj
BS GIKI,Pakistan
MS UET Peshawar,Pakistan
7
We can apply this rule using the above mentioned mathematical formula. Let’s suppose A
represent an event ‘person has cancer’ and even B represent an event ‘person is smoker’. Let’s
suppose the probability of event A, i.e. ‘person has cancer’ P (A) = 0.1 (which means that 10
percent of patients entering the clinic have cancer) and the probability of a patient having cancer
is a smoker is P (B) = 0.5, Using the previous data of patients, we can determined the
probability of smokers having cancer P (B|A) = 0.8, Using these numbers the probability that a
person has cancer and is a smoker increases from 0.1 to 0.16 which is a significant increase.
This shows that after finding new evidence the probability varies significantly.
The given dataset contains 150 instances, corresponding to three equally-recurrent species of iris
plant (setosa, versicolour, virginica).
8. MuhammadGulraj
BS GIKI,Pakistan
MS UET Peshawar,Pakistan
8
The execution and result of bayes classifier is as follows which shows that a Naïve Bayes classifier
makes less mistakes in a dataset that, although simple, is not linearly separable.
9. MuhammadGulraj
BS GIKI,Pakistan
MS UET Peshawar,Pakistan
9
K–Means Clustering
K means clustering is a popular method used for vector quantization. K means clustering is
basically the partition of X observations into K clusters. In K means clustering each observation
belongs to the cluster having the nearest mean. K means clustering is an NP hard problem
(Computationally difficult). Efficient heuristic algorithms can be used which converge rapidly to a
local minimum.
Assume a set of observations x1, x2, x3, x4 …. Xn, every observation is a vector of d-
dimensions. The main aim of K means clustering is to partition the n observations into k sets
(clusters) where (k<=n). S = S1, S2 , … Sk (to minimize the sum of squares within-cluster).
μi is mean of points in Si.
10. MuhammadGulraj
BS GIKI,Pakistan
MS UET Peshawar,Pakistan
10
The algorithm of K means clustering is as follows.
i. Specify K (the number of clusters)
ii. Select K points randomly as cluster centers.
iii. Assign each object/instance to closest cluster center.
iv. Find the centroid or mean for every cluster and use it as new cluster center.
v. Now reassign all the objects/instances to the closest cluster center.
vi. Iterate until the center of the clusters doesn’t change any more.
11. MuhammadGulraj
BS GIKI,Pakistan
MS UET Peshawar,Pakistan
11
If we use the K means clustering on Iris data set, it will find the natural grouping between iris
specimens based on the features given in the data. Using the K means algorithm we must first
specify the number clusters we want to create. The Matlab implementation of K means
algorithm is present in the assignment folder. The different results that we found using K means
algorithm are as follows.
12. MuhammadGulraj
BS GIKI,Pakistan
MS UET Peshawar,Pakistan
12
Every Iteration that is performed by the K means algorithm, it reassigns the points between
clusters to decrease the distance between centroids and recompute it for new clusters. In each
iteration the re-assignment decreases until the algorithm reaches a minimum.
14. MuhammadGulraj
BS GIKI,Pakistan
MS UET Peshawar,Pakistan
14
1. http://documentation.statsoft.com/STATISTICAHelp.aspx?path=MachineLearning/MachineL
earning/NaiveBayes/NaiveBayesClassifierExample1Classification
2. http://www.mathworks.com/help/stats/examples/classification.html
3. Andrew Ng (2013), an online course for Machine learning, Stanford University,
Stanford, https://class.coursera.org/ml-004/class.
4. Duda and Hart, Pattern Classification (2001-2002), Wiley, New York.
5. Ying Cui and Zhong Jin, Facial feature points (2012),
http://www.jprr.org/index.php/jprr
6. Ioannis Dimou and Michalis Zervakis, On the analogy of classifier ensembles,
http://www.jprr.org/index.php/jprr