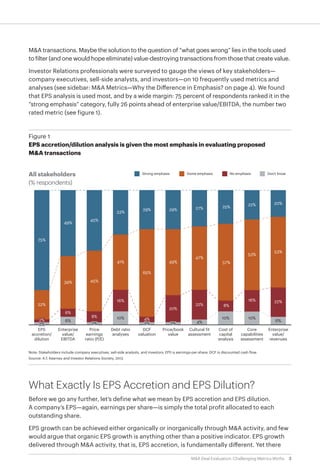
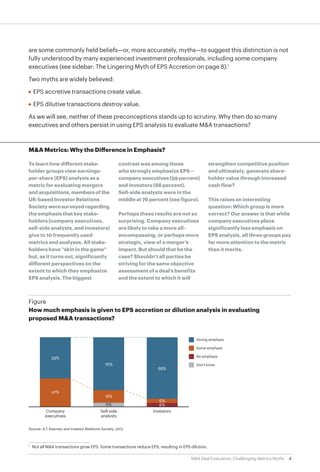
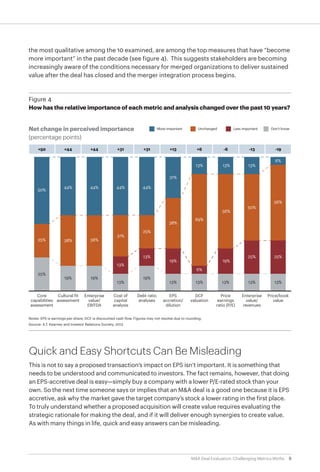
SlideShare a Scribd company logo
1M&A Deal Evaluation: Challenging Metrics Myths
M&A Deal Evaluation:
Challenging
Metrics Myths
In the world of mergers and acquisitions, emphasis
is often placed on evaluation metrics that look as if they
tell the story, but they can be misleading.
2M&A Deal Evaluation: Challenging Metrics Myths
The presentation was over. The CEO of a global business-services group had been part of a due
diligence process to advise on whether or not to proceed with a major European acquisition.
Our job was to help the CEO and the board answer some important questions: Was the target
company a good fit? How did synergies stack up against the risks? Did the target company’s
sector show potential for growth?
Our findings were less than encouraging. They suggested limited growth going forward, and
even though the potential for synergies was good, the risks were significant, and there were
doubts about the company’s ability to deliver those synergies.
As we walked out of the meeting, the CEO was digesting all that he had just heard and contem-
plating the board’s likely reaction to our findings. Then he spoke: “Well, there’s one thing we can
say about this acquisition—it’s highly earnings accretive.”
An argument to support the myth
that EPS accretion equates to value
creation is that “some people believe
it does”—a misperception that
is then priced into the stock.
What does that mean? Does the fact that a deal is accretive necessarily mean that it’s a good
move? Conversely, are deals that dilute earnings per share (EPS) necessarily bad moves?
Should we even use EPS as a measure by which to evaluate an M&A transaction?
In this paper, we discuss findings from our research into the metrics and analyses most frequently
used to evaluate proposed mergers and acquisitions. The research introduced a surprising
insight: The impact on EPS is by far the most emphasized metric used to evaluate proposed
M&A transactions between public companies.
With this in mind, we look at two common and related myths surrounding EPS and demonstrate
why these are at best unhelpful and at worst potentially misleading. We also examine what
business leaders and market analysts should focus on instead. As always, our advice is pragmatic:
Stick to the business fundamentals.
How Do They Get It So Wrong?
It is widely recognized that a significant percentage of M&A transactions fail to deliver value
to shareholders. What goes wrong? How is it that acquisitions on average seem to create
negligible returns? It can be tempting to blame poor merger integration for the meager returns,
and certainly the execution of an integration can have a major impact on whether or not
a transaction is regarded as successful. However, it may also be useful to consider if the deal
was worth doing in the first place. Maybe some transactions should never have happened.
With this in mind, A.T. Kearney joined forces with the UK’s Investor Relations Society (IR Society)
to understand exactly which metrics and analyses get the most emphasis in evaluating proposed
3M&A Deal Evaluation: Challenging Metrics Myths
M&A transactions. Maybe the solution to the question of “what goes wrong” lies in the tools used
to filter (and one would hope eliminate) value-destroying transactions from those that create value.
Investor Relations professionals were surveyed to gauge the views of key stakeholders—
company executives, sell-side analysts, and investors—on 10 frequently used metrics and
analyses (see sidebar: M&A Metrics—Why the Difference in Emphasis? on page 4). We found
that EPS analysis is used most, and by a wide margin: 75 percent of respondents ranked it in the
“strong emphasis” category, fully 26 points ahead of enterprise value/EBITDA, the number two
rated metric (see figure 1).
All stakeholders
(% respondents)
EPS
accretion/
dilution
6%
10%
4%
10% 10%
6%
Enterprise
value/
EBITDA
Price
earnings
ratio (P/E)
Debt ratio
analyses
DCF
valuation
Price/book
value
Cultural fit
assessment
Cost of
capital
analysis
Core
capabilities
assessment
Enterprise
value/
revenues
Note: Stakeholders include company executives, sell-side analysts, and investors; EPS is earnings-per-share; DCF is discounted cash flow.
Source: A.T. Kearney and Investor Relations Society, 2013
Figure 1
EPS accretion/dilution analysis is given the most emphasis in evaluating proposed
M&A transactions
2% 2% 2% 2%
2%
22%
6%
8%
16%
41%
33%
29%
65%
4%
20%
49%
29% 27%
47%
22% 8%
57%
25%
22%
53%
16% 22%
53%
20%
45%
45%
39%
49%
75%
Strong emphasis Some emphasis No emphasis Don’t know
What Exactly Is EPS Accretion and EPS Dilution?
Before we go any further, let’s define what we mean by EPS accretion and EPS dilution.
A company’s EPS—again, earnings per share—is simply the total profit allocated to each
outstanding share.
EPS growth can be achieved either organically or inorganically through M&A activity, and few
would argue that organic EPS growth is anything other than a positive indicator. EPS growth
delivered through M&A activity, that is, EPS accretion, is fundamentally different. Yet there
4M&A Deal Evaluation: Challenging Metrics Myths
are some commonly held beliefs—or, more accurately, myths—to suggest this distinction is not
fully understood by many experienced investment professionals, including some company
executives (see sidebar: The Lingering Myth of EPS Accretion on page 8).1
Two myths are widely believed:
•	 EPS accretive transactions create value.
•	 EPS dilutive transactions destroy value.
As we will see, neither of these preconceptions stands up to scrutiny. Why then do so many
executives and others persist in using EPS analysis to evaluate M&A transactions?
1
		
Not all M&A transactions grow EPS. Some transactions reduce EPS, resulting in EPS dilution.
Company
executives
Sell-side
analysts
Investors
Source: A.T. Kearney and Investor Relations Society, 2013
Figure
How much emphasis is given to EPS accretion or dilution analysis in evaluating
proposed M&A transactions?
41%
88%
18%
76%
59%
Strong emphasis
Some emphasis
No emphasis
Don’t know
6%6%
6%
M&A Metrics: Why the Difference in Emphasis?
To learn how different stake-
holder groups view earnings-
per-share (EPS) analysis as a
metric for evaluating mergers
and acquisitions, members of the
UK-based Investor Relations
Society were surveyed regarding
the emphasis that key stake-
holders (company executives,
sell-side analysts, and investors)
give to 10 frequently used
metrics and analyses. All stake-
holders have “skin in the game”
but, as it turns out, significantly
different perspectives on the
extent to which they emphasize
EPS analysis. The biggest
contrast was among those
who strongly emphasize EPS—
company executives (59 percent)
and investors (88 percent).
Sell-side analysts were in the
middle at 76 percent (see figure).
Perhaps these results are not so
surprising. Company executives
are likely to take a more all-
encompassing, or perhaps more
strategic, view of a merger’s
impact. But should that be the
case? Shouldn’t all parties be
striving for the same objective
assessment of a deal’s benefits
and the extent to which it will
strengthen competitive position
and ultimately, generate share-
holder value through increased
cash flow?
This raises an interesting
question: Which group is more
correct? Our answer is that while
company executives place
significantly less emphasis on
EPS analysis, all three groups pay
far more attention to the metric
than it merits.
5M&A Deal Evaluation: Challenging Metrics Myths
The answer comes down to views about valuation. A company’s stock is frequently valued on
the basis of its EPS by applying a price-to-earnings (P/E) ratio. Based on the assumption that
an acquiring company’s P/E ratio will stay the same after an acquisition, if earnings per share
increase, then the company’s overall value will increase, ostensibly as a result of the deal.
What’s the Catch?
But, there’s a catch. To understand it you need to consider the fundamentals of why one
company has a higher P/E ratio than another in the first place. It is because the market believes
the earnings of the company with the higher P/E ratio—call it Company A—will rise faster than
those of the company with a lower P/E ratio (Company B).2
Now suppose Company A buys
Company B, using its stock as the acquisition currency. As a result of the purchase the EPS of
the combined company will be higher than that of Company A had it not made the acquisition—
thus the transaction is EPS accretive for Company A.
They call it the “bootstrap game.”
If companies can fool investors by buying
a company with lower P/E rated stocks,
then why not continue to do so?
But being EPS accretive comes with a downside—and that’s the catch. The newly combined
company will also have a lower earnings growth rate than Company A would have had as a
standalone company. So while the EPS of the post-acquisition company will be higher than
that of the pre-acquisition Company A, its P/E ratio will be lower due to its acquisition of the
lower-P/E rated Company B.
In fact, the reduction in the P/E ratio, all other things being equal, will exactly counterbalance
the impact of the higher EPS. The result is that the valuation of the newly combined company
will reflect the blended higher EPS and lower P/E ratio of the two original companies. In other
words, no value is created.
A key reason for doing an M&A deal is, of course, the synergies that can result. By increasing
the new entity’s combined earnings, synergies can add enough value to make the combined
company worth more than the two individual companies were before the merger. It is important
to note that the increased value results from the synergies created, not from the deal being EPS
accretive or dilutive. It is quite possible that highly dilutive deals offer the greatest opportunities
for delivering synergies.
An argument sometimes put forward to support the myth that EPS accretion equates to value
creation is that “people believe it does.” This becomes reality as the misperception is priced
into the stock.
2
	 Alternatively, it believes that earnings are more sustainable than the earnings in the lower-rated company. This paper adheres
to the idea that earnings will grow faster in the company with the higher P/E ratio. In reality, the two ideas relate to the same thing—
the strength of the earnings stream a company generates.
6M&A Deal Evaluation: Challenging Metrics Myths
Richard A. Brealey and Stewart C. Myers write about this idea in their seminal textbook, Principles
of Corporate Finance. They call it the “bootstrap game.” If companies can fool investors by buying
a company with lower P/E rated stocks, then why not continue to do so? The flaw in the bootstrap
game is the need to keep the market fooled, hoping it doesn’t notice that the acquiring company’s
earnings growth potential is becoming progressively more diluted.
The inevitable result of pursuing such a strategy to its logical conclusion by continuing to acquire
lower P/E rated companies is clear: In the same way a Ponzi scheme must eventually fail due
to the lack of underlying value creation, the P/E multiple of the acquiring company must fall
as it becomes increasingly evident to the market that no value is created.
What’s the Alternative for Evaluating Proposed Mergers?
Our advice for evaluating a proposed merger is characteristically pragmatic: Stick to the funda-
mentals. M&A can deliver significant competitive advantage and value to shareholders, but the
criteria by which to assess just how much must answer fundamental business questions:
•	 Is the proposed merger strategically logical?
•	 Will it deliver cost, revenue, or other financial synergies?
•	 Will it build management or other capabilities?
•	 Is the combined company capable of delivering the synergies?
A thorough, fact-based due diligence is the best way to answer these questions (see figure 2).
To understand the business
fundamentals of a proposed deal
Activities
and
analysis
Source: A.T. Kearney analysis
Figure 2
Transaction due diligence overview
Strategic
options
Commercial
due diligence
Operational
due diligence
Financial
due diligence
Legal
due diligence
• Market dynamics
• High-level trends
• Business portfolio
analysis
• Target identifi-
cation
• Market and
customer
attractiveness
and dynamics
• Industry structure
and dynamics
• Competitive
position
• Distribution
channel dynamics
• Top-line oppor-
tunities
• Business plan review
• Risks and oppor-
tunities
• Cost structures
and drivers
• Operational
improvement
potential
• Cost synergies
assessment
• Integration
capabilities
• Risks and oppor-
tunities
• Review financial
statements and
management
accounts
• Basis for future
business plans
• Valuation
• Deal financing
• Target liabilities
and potential risks
• Competition
authority
implications
• Transaction
mechanics,
execution, and
closing
Typical
parties
involved
• Senior managers
(CEO, board)
• Strategic advisors
(consultants,
bankers)
• Senior management
(CEO, strategy director, business
development director)
• Consultants
• CFO
• Accountants
• Input from
commercial and
operational due
diligence
• Company general
counsel
• Legal advisors
Fact-based
assessment
of value
creation
potential
7M&A Deal Evaluation: Challenging Metrics Myths
Typical opportunity areas Typical synergy value
Source: A.T. Kearney Merger Integration Framework
Figure 3
Merger synergies originate from three value creation areas
Top-line growth,
commercial
optimization
Operations
productivity
improvement
Asset and capital
investment
rationalization
• Cross selling
• Product development and innovation
• Brand portfolio optimization
• Price realization and service offer
• Combined innovation pipeline
• Leverage sales capabilities
• (Negative synergies: customer retention)
• Capital investment rationalization
• Working capital reduction
• Sale of rationalised assets
• Operations and supply chain
— Manufacturing footprint
— Warehouse and logistics footprint
• Procurement
— Price leveling
— Volume consolidation
— Strategic sourcing
— Procurement transformation
• SG&A
— Office consolidation
— Finance, HR, IT consolidation
— Sales and marketing cost reduction
— Leverage capabilities and best practice
Net 2-3%
of combined
sales year one
10-15%
of combined
cost base
10-15%
excluding
asset sales
Merger
synergies
Accretion or dilution is a fact of
doing deals, but is not a measure
of potential value creation.
For that, you need to examine
the deal’s business fundamentals.
Of course, there is also a role for using many of the M&A metrics and analyses described in
figure 1 as part of an overall assessment. These can play a complementary role in developing
a full perspective on a transaction. Used in isolation, however, and without a clear understanding
of their limitations, they have a tendency to give a very limited view of the real potential for
value creation.
Ultimately, any value an M&A transaction creates must translate into future cash flow, resulting
from synergies in three value-creation areas: topline growth, operations productivity, and asset
and capital investment rationalizations (see figure 3).3
3
	The synergies ultimately delivered in a merger are influenced by a number of factors, including the transaction’s strategic goals
	and the proportion of total spend that is addressable for synergy purposes.
8M&A Deal Evaluation: Challenging Metrics Myths
And then there’s the crucial question of how much to pay for a deal and who will realize the
value it creates. If the net present value (NPV) of future synergies is paid to the selling share-
holders in an acquisition price premium, even the most synergistic of mergers can result in
value destruction for the acquirer’s shareholders.5
Always consider who will be the winners
in an M&A transaction—the final outcome is rarely the same for all parties.
EPS Myths Revisited
The moral of the story is this: Too often, too much emphasis is placed on whether a deal is EPS
accretive or dilutive. These are time-honored metrics that appear sensible but in reality do not
answer the most important question: Should we do the deal? Let’s review the two commonly
held myths and why they don’t work as M&A evaluation measures.
EPS-accretive transactions create value. Not necessarily. Accretion is a relative measure that
simply shows the company being acquired has a lower P/E rated stock.
EPS-dilutive transactions are value destroying. Again, not necessarily. In fact, EPS-dilutive
transactions can increase value when the target company has good growth potential and the
strategic logic for the deal is strong.
The fact is that EPS analysis is not a useful tool for evaluating the merits of proposed M&A
transactions. Accretion or dilution is a fact of doing deals but is not a measure of potential value
creation. For that, you need to examine the deal’s business fundamentals.
Our research reveals one more insight: how the emphasis given to the different metrics and
analyses has changed over the past decade. Two measures, core capabilities and cultural fit,
The Lingering Myth of EPS Accretion
In an examination of 30 acquisi-
tions performed and announced
by publicly owned companies,
68 percent referred to the
merger’s potential impact on
EPS.4
The prominence given to
thismetricattheannouncement
reinforcesthelingeringbeliefthat
EPSisaproxyforvaluecreation.
The EPS accretion myth has
lingered for a long time. Here’s
why. At first glance, EPS accre-
tion appears to be a simple, and
therefore appealing, way to
determine or communicate
whether or not a transaction will
create value. In fact, it is logically
and mathematically flawed.
Large mergers and acquisitions
almost always involve the high
drama of risk and reward for the
parties involved. M&A can
make—or break—an executive’s
reputation or career, and
multimillion-dollar fees and
bonuses can be won or lost.
Given all that, no wonder every
possible argument supporting
M&A deals is applied by those
trying to make them happen.
This is precisely why analysts and
other stakeholders need accurate
evaluation tools: to make sure all
theargumentsformakingthedeal
hold water. Despite the frequency
with which EPS accretion is
alluded to or used to bolster
argumentsforthedeal,themetric
doesn’t stand up to scrutiny.
4
	Companies were randomly selected from a group of transactions in which the acquiring company was U.S.- or UK-based and the 		
	transaction satisfied a set of criteria, including deal value of more than $1 billion and 100 percent of the target was acquired.
The examination included a review of press releases and transcripts of press conferences where the acquirer announced the deal.
5
	 The acquisition price premium is typically 20 to 30 percent over the pre-announcement trading price, although this premium
	is perceived to have fallen in recent years.
9M&A Deal Evaluation: Challenging Metrics Myths
the most qualitative among the 10 examined, are among the top measures that have “become
more important” in the past decade (see figure 4). This suggests stakeholders are becoming
increasingly aware of the conditions necessary for merged organizations to deliver sustained
value after the deal has closed and the merger integration process begins.
Quick and Easy Shortcuts Can Be Misleading
This is not to say a proposed transaction’s impact on EPS isn’t important. It is something that
needs to be understood and communicated to investors. The fact remains, however, that doing
an EPS-accretive deal is easy—simply buy a company with a lower P/E-rated stock than your
own. So the next time someone says or implies that an M&A deal is a good one because it is EPS
accretive, ask why the market gave the target company’s stock a lower rating in the first place.
To truly understand whether a proposed acquisition will create value requires evaluating the
strategic rationale for making the deal, and if it will deliver enough synergies to create value.
As with many things in life, quick and easy answers can be misleading.
Core
capabilities
assessment
19%
13% 13% 13% 13% 13%
Cultural fit
assessment
Enterprise
value/
EBITDA
Cost of
capital
analysis
Debt ratio
analyses
EPS
accretion/
dilution
DCF
valuation
Price
earnings
ratio (P/E)
Enterprise
value/
revenues
Price/book
value
Notes: EPS is earnings-per-share; DCF is discounted cash flow. Figures may not resolve due to rounding.
Source: A.T. Kearney and Investor Relations Society, 2013
Figure 4
How has the relative importance of each metric and analysis changed over the past 10 years?
25%
19%
13%
25%
19%
13%
31%
44% 44%
25%
13%
19%
38%
31%
13%
69%
6%
19%
56%
13% 13%
50%
25% 25%
56%
6%
38%
44%
38%
44%
50%
More important Unchanged Less important Don’t know
+50 +44 +44 +31 +31 +13 +6 -6 -13 -19
Net change in perceived importance
(percentage points)
10M&A Deal Evaluation: Challenging Metrics Myths
Authors
Bob Haas, partner, New York
robert.haas@atkearney.com
Angus Hodgson, principal, London
angus.hodgson@atkearney.com
The authors wish to thank their colleagues Oliver Lawson and Olga Wittig and the Investor Relations Society for their
support in the preparation of this paper. The IR Society is the professional body for those involved in investor relations
and the focal point for investor relations in the United Kingdom. For more information, visit www.irs.org.uk.
A.T. Kearney is a global team of forward-thinking partners that delivers immediate
impact and growing advantage for its clients. We are passionate problem solvers
who excel in collaborating across borders to co-create and realize elegantly simple,
practical, and sustainable results. Since 1926, we have been trusted advisors on the
most mission-critical issues to the world’s leading organizations across all major
industries and service sectors. A.T. Kearney has 59 offices located in major business
centers across 39 countries.
Americas
Europe
Asia Pacific
Middle East
and Africa
Atlanta
Calgary
Chicago
Dallas
Detroit
Houston
Mexico City
New York
San Francisco
São Paulo
Toronto
Washington, D.C.
Bangkok
Beijing
Hong Kong
Jakarta
Kuala Lumpur
Melbourne
Mumbai
New Delhi
Seoul
Shanghai
Singapore
Sydney
Tokyo
Amsterdam
Berlin
Brussels
Bucharest
Budapest
Copenhagen
Düsseldorf
Frankfurt
Helsinki
Istanbul
Kiev
Lisbon
Ljubljana
London
Madrid
Milan
Moscow
Munich
Oslo
Paris
Prague
Rome
Stockholm
Stuttgart
Vienna
Warsaw
Zurich
Abu Dhabi
Dubai
Johannesburg
Manama
Riyadh
A.T. Kearney Korea LLC is a separate and
independent legal entity operating under
the A.T. Kearney name in Korea.
© 2013, A.T. Kearney, Inc. All rights reserved.
The signature of our namesake and founder, Andrew Thomas Kearney, on the cover of this
document represents our pledge to live the values he instilled in our firm and uphold his
commitment to ensuring “essential rightness” in all that we do.
For more information, permission to reprint or translate this work, and all other correspondence,
please email: insight@atkearney.com.

More Related Content

What's hot

Risk Management Framework
Risk Management FrameworkRisk Management Framework
Risk Management Framework
Anand Subramaniam
 
Integrating Risk into your Balanced Scorecard
Integrating Risk into your Balanced Scorecard Integrating Risk into your Balanced Scorecard
Integrating Risk into your Balanced Scorecard
Andrew Smart
 
Business Risk Case Study Ba33
Business Risk Case Study Ba33Business Risk Case Study Ba33
Business Risk Case Study Ba33
Sandip Sen
 
Finance basics ppt @ bec doms mba finance
Finance basics ppt @ bec doms mba financeFinance basics ppt @ bec doms mba finance
Finance basics ppt @ bec doms mba finance
Babasab Patil
 
How to Build an Enterprise Risk Management Framework
How to Build an Enterprise Risk Management FrameworkHow to Build an Enterprise Risk Management Framework
How to Build an Enterprise Risk Management Framework
Colleen Beck-Domanico
 
Startup Valuation
Startup ValuationStartup Valuation
Startup Valuation
Michael Herlache
 
Risk Appetite
Risk AppetiteRisk Appetite
Risk Appetite
Towers Perrin
 
Governance, risk and compliance framework
Governance, risk and compliance frameworkGovernance, risk and compliance framework
Governance, risk and compliance frameworkCeyeap
 
CF_8 UNIT4 Risk Reporting & Risk Mgt
CF_8 UNIT4 Risk Reporting & Risk MgtCF_8 UNIT4 Risk Reporting & Risk Mgt
CF_8 UNIT4 Risk Reporting & Risk MgtDr. Firdaus Khan
 
Module 1 - Introduction to Risk Management.pdf
Module 1 - Introduction to Risk Management.pdfModule 1 - Introduction to Risk Management.pdf
Module 1 - Introduction to Risk Management.pdf
marjondimafilis
 
The valuation of stocks ppt @ bec doms
The valuation of stocks ppt @ bec domsThe valuation of stocks ppt @ bec doms
The valuation of stocks ppt @ bec doms
Babasab Patil
 
Enterprise Risk Management as a Core Management Process
Enterprise Risk Management as a Core Management ProcessEnterprise Risk Management as a Core Management Process
Enterprise Risk Management as a Core Management Processregio12
 
Operational risk management (orm)
Operational risk management (orm)Operational risk management (orm)
Operational risk management (orm)Bushra Angbeen
 
Fm11 ch 11 cash flow estimation and risk analysis
Fm11 ch 11 cash flow estimation and risk analysisFm11 ch 11 cash flow estimation and risk analysis
Fm11 ch 11 cash flow estimation and risk analysisNhu Tuyet Tran
 
127017438_RMA_OperationalRiskAppetite_v1.0
127017438_RMA_OperationalRiskAppetite_v1.0127017438_RMA_OperationalRiskAppetite_v1.0
127017438_RMA_OperationalRiskAppetite_v1.0Rachael Phelan
 
Financial Statement Analysis and Financial Models
Financial Statement Analysis and Financial ModelsFinancial Statement Analysis and Financial Models
Financial Statement Analysis and Financial Models
Maksudul Huq Chowdhury
 
Riskpro - Operational Risk Management
Riskpro - Operational Risk ManagementRiskpro - Operational Risk Management
Riskpro - Operational Risk Management
Manoj Jain
 
Bcg cfa perth presentation
Bcg cfa perth presentationBcg cfa perth presentation
Bcg cfa perth presentation
Felipe Sotelo A.
 
Business Pulse - Dual perspectives on the top 10 risks and opportunities 2013...
Business Pulse - Dual perspectives on the top 10 risks and opportunities 2013...Business Pulse - Dual perspectives on the top 10 risks and opportunities 2013...
Business Pulse - Dual perspectives on the top 10 risks and opportunities 2013...
EY
 
Enterprise Risk Management
Enterprise Risk ManagementEnterprise Risk Management
Enterprise Risk Management
Prof. Akram Hassan PhD,MBA,PMP,OPM3
 

What's hot (20)

Risk Management Framework
Risk Management FrameworkRisk Management Framework
Risk Management Framework
 
Integrating Risk into your Balanced Scorecard
Integrating Risk into your Balanced Scorecard Integrating Risk into your Balanced Scorecard
Integrating Risk into your Balanced Scorecard
 
Business Risk Case Study Ba33
Business Risk Case Study Ba33Business Risk Case Study Ba33
Business Risk Case Study Ba33
 
Finance basics ppt @ bec doms mba finance
Finance basics ppt @ bec doms mba financeFinance basics ppt @ bec doms mba finance
Finance basics ppt @ bec doms mba finance
 
How to Build an Enterprise Risk Management Framework
How to Build an Enterprise Risk Management FrameworkHow to Build an Enterprise Risk Management Framework
How to Build an Enterprise Risk Management Framework
 
Startup Valuation
Startup ValuationStartup Valuation
Startup Valuation
 
Risk Appetite
Risk AppetiteRisk Appetite
Risk Appetite
 
Governance, risk and compliance framework
Governance, risk and compliance frameworkGovernance, risk and compliance framework
Governance, risk and compliance framework
 
CF_8 UNIT4 Risk Reporting & Risk Mgt
CF_8 UNIT4 Risk Reporting & Risk MgtCF_8 UNIT4 Risk Reporting & Risk Mgt
CF_8 UNIT4 Risk Reporting & Risk Mgt
 
Module 1 - Introduction to Risk Management.pdf
Module 1 - Introduction to Risk Management.pdfModule 1 - Introduction to Risk Management.pdf
Module 1 - Introduction to Risk Management.pdf
 
The valuation of stocks ppt @ bec doms
The valuation of stocks ppt @ bec domsThe valuation of stocks ppt @ bec doms
The valuation of stocks ppt @ bec doms
 
Enterprise Risk Management as a Core Management Process
Enterprise Risk Management as a Core Management ProcessEnterprise Risk Management as a Core Management Process
Enterprise Risk Management as a Core Management Process
 
Operational risk management (orm)
Operational risk management (orm)Operational risk management (orm)
Operational risk management (orm)
 
Fm11 ch 11 cash flow estimation and risk analysis
Fm11 ch 11 cash flow estimation and risk analysisFm11 ch 11 cash flow estimation and risk analysis
Fm11 ch 11 cash flow estimation and risk analysis
 
127017438_RMA_OperationalRiskAppetite_v1.0
127017438_RMA_OperationalRiskAppetite_v1.0127017438_RMA_OperationalRiskAppetite_v1.0
127017438_RMA_OperationalRiskAppetite_v1.0
 
Financial Statement Analysis and Financial Models
Financial Statement Analysis and Financial ModelsFinancial Statement Analysis and Financial Models
Financial Statement Analysis and Financial Models
 
Riskpro - Operational Risk Management
Riskpro - Operational Risk ManagementRiskpro - Operational Risk Management
Riskpro - Operational Risk Management
 
Bcg cfa perth presentation
Bcg cfa perth presentationBcg cfa perth presentation
Bcg cfa perth presentation
 
Business Pulse - Dual perspectives on the top 10 risks and opportunities 2013...
Business Pulse - Dual perspectives on the top 10 risks and opportunities 2013...Business Pulse - Dual perspectives on the top 10 risks and opportunities 2013...
Business Pulse - Dual perspectives on the top 10 risks and opportunities 2013...
 
Enterprise Risk Management
Enterprise Risk ManagementEnterprise Risk Management
Enterprise Risk Management
 

Viewers also liked

Secrets of Breaking the Glass Ceiling for Women Entrepreneurs
Secrets of Breaking the Glass Ceiling for Women EntrepreneursSecrets of Breaking the Glass Ceiling for Women Entrepreneurs
Secrets of Breaking the Glass Ceiling for Women Entrepreneurs
VerticalResponse
 
What is coaching?
What is coaching?What is coaching?
What is coaching?
Alphaeus Consulting LLP
 
How Your Email is Impacted by SPAM Laws
How Your Email is Impacted by SPAM LawsHow Your Email is Impacted by SPAM Laws
How Your Email is Impacted by SPAM Laws
VerticalResponse
 
Faruq, Wei Jian and Jer
Faruq, Wei Jian and JerFaruq, Wei Jian and Jer
Faruq, Wei Jian and Jerrastelas
 
Espectrofotómetros
EspectrofotómetrosEspectrofotómetros
Espectrofotómetrosguest91b7258
 
"The Year of Nu Tau"
"The Year of Nu Tau""The Year of Nu Tau"
"The Year of Nu Tau"
crlymangood
 
Mexico's Infrastructure Creation and Why it Matters for North American Compet...
Mexico's Infrastructure Creation and Why it Matters for North American Compet...Mexico's Infrastructure Creation and Why it Matters for North American Compet...
Mexico's Infrastructure Creation and Why it Matters for North American Compet...
Omar Del Valle Colosio
 
The Good, The Bad and The Ugly of SEO
The Good, The Bad and The Ugly of SEOThe Good, The Bad and The Ugly of SEO
The Good, The Bad and The Ugly of SEOVerticalResponse
 
icomplete CRM - The New Way To Make Small Business Grow!
icomplete CRM - The New Way To Make Small Business Grow!icomplete CRM - The New Way To Make Small Business Grow!
icomplete CRM - The New Way To Make Small Business Grow!
myleshantler
 
Water Infrastructure in Latin America
Water Infrastructure in Latin AmericaWater Infrastructure in Latin America
Water Infrastructure in Latin America
Omar Del Valle Colosio
 
2014 lims presentation portuguese
2014 lims presentation portuguese2014 lims presentation portuguese
2014 lims presentation portuguese
LIMS Brazil
 
How to Be Good Studentpreneur - Akademi Berbagi Bekasi
How to Be Good Studentpreneur - Akademi Berbagi BekasiHow to Be Good Studentpreneur - Akademi Berbagi Bekasi
How to Be Good Studentpreneur - Akademi Berbagi Bekasi
Arry Rahmawan
 
Lotus notes-703-1232746032205457-2
Lotus notes-703-1232746032205457-2Lotus notes-703-1232746032205457-2
Lotus notes-703-1232746032205457-2IN023227
 
America Means Business Presentation: 4 Quick Ways to Make the Most out of Ema...
America Means Business Presentation: 4 Quick Ways to Make the Most out of Ema...America Means Business Presentation: 4 Quick Ways to Make the Most out of Ema...
America Means Business Presentation: 4 Quick Ways to Make the Most out of Ema...
VerticalResponse
 
6 langkah lebih maju tentang category management
6 langkah lebih maju tentang category management6 langkah lebih maju tentang category management
6 langkah lebih maju tentang category management
Yayan Mulyana
 
Cpa society branding
Cpa society brandingCpa society branding
Cpa society branding
guestc6dde06
 
Agile2010
Agile2010Agile2010
Agile2010Damian
 
Twitter For Your Business: Getting Started
Twitter For Your Business: Getting StartedTwitter For Your Business: Getting Started
Twitter For Your Business: Getting Started
VerticalResponse
 
KomenLINK eNews Nov | jennifer glasgow
KomenLINK eNews Nov | jennifer glasgowKomenLINK eNews Nov | jennifer glasgow
KomenLINK eNews Nov | jennifer glasgow
Jennifer Glasgow
 

Viewers also liked (20)

Secrets of Breaking the Glass Ceiling for Women Entrepreneurs
Secrets of Breaking the Glass Ceiling for Women EntrepreneursSecrets of Breaking the Glass Ceiling for Women Entrepreneurs
Secrets of Breaking the Glass Ceiling for Women Entrepreneurs
 
What is coaching?
What is coaching?What is coaching?
What is coaching?
 
How Your Email is Impacted by SPAM Laws
How Your Email is Impacted by SPAM LawsHow Your Email is Impacted by SPAM Laws
How Your Email is Impacted by SPAM Laws
 
Email for Mobile Phones
Email for Mobile PhonesEmail for Mobile Phones
Email for Mobile Phones
 
Faruq, Wei Jian and Jer
Faruq, Wei Jian and JerFaruq, Wei Jian and Jer
Faruq, Wei Jian and Jer
 
Espectrofotómetros
EspectrofotómetrosEspectrofotómetros
Espectrofotómetros
 
"The Year of Nu Tau"
"The Year of Nu Tau""The Year of Nu Tau"
"The Year of Nu Tau"
 
Mexico's Infrastructure Creation and Why it Matters for North American Compet...
Mexico's Infrastructure Creation and Why it Matters for North American Compet...Mexico's Infrastructure Creation and Why it Matters for North American Compet...
Mexico's Infrastructure Creation and Why it Matters for North American Compet...
 
The Good, The Bad and The Ugly of SEO
The Good, The Bad and The Ugly of SEOThe Good, The Bad and The Ugly of SEO
The Good, The Bad and The Ugly of SEO
 
icomplete CRM - The New Way To Make Small Business Grow!
icomplete CRM - The New Way To Make Small Business Grow!icomplete CRM - The New Way To Make Small Business Grow!
icomplete CRM - The New Way To Make Small Business Grow!
 
Water Infrastructure in Latin America
Water Infrastructure in Latin AmericaWater Infrastructure in Latin America
Water Infrastructure in Latin America
 
2014 lims presentation portuguese
2014 lims presentation portuguese2014 lims presentation portuguese
2014 lims presentation portuguese
 
How to Be Good Studentpreneur - Akademi Berbagi Bekasi
How to Be Good Studentpreneur - Akademi Berbagi BekasiHow to Be Good Studentpreneur - Akademi Berbagi Bekasi
How to Be Good Studentpreneur - Akademi Berbagi Bekasi
 
Lotus notes-703-1232746032205457-2
Lotus notes-703-1232746032205457-2Lotus notes-703-1232746032205457-2
Lotus notes-703-1232746032205457-2
 
America Means Business Presentation: 4 Quick Ways to Make the Most out of Ema...
America Means Business Presentation: 4 Quick Ways to Make the Most out of Ema...America Means Business Presentation: 4 Quick Ways to Make the Most out of Ema...
America Means Business Presentation: 4 Quick Ways to Make the Most out of Ema...
 
6 langkah lebih maju tentang category management
6 langkah lebih maju tentang category management6 langkah lebih maju tentang category management
6 langkah lebih maju tentang category management
 
Cpa society branding
Cpa society brandingCpa society branding
Cpa society branding
 
Agile2010
Agile2010Agile2010
Agile2010
 
Twitter For Your Business: Getting Started
Twitter For Your Business: Getting StartedTwitter For Your Business: Getting Started
Twitter For Your Business: Getting Started
 
KomenLINK eNews Nov | jennifer glasgow
KomenLINK eNews Nov | jennifer glasgowKomenLINK eNews Nov | jennifer glasgow
KomenLINK eNews Nov | jennifer glasgow
 

Similar to M&A deal evaluation

This discussion has 2 partsYou are working as a financial.docx
This discussion has 2 partsYou are working as a financial.docxThis discussion has 2 partsYou are working as a financial.docx
This discussion has 2 partsYou are working as a financial.docx
jwilliam16
 
Explain the various categories of ratio analysis and provide example.pdf
Explain the various categories of ratio analysis and provide example.pdfExplain the various categories of ratio analysis and provide example.pdf
Explain the various categories of ratio analysis and provide example.pdf
archanenterprises
 
DIAS PRESENTATION.pptx
DIAS PRESENTATION.pptxDIAS PRESENTATION.pptx
DIAS PRESENTATION.pptx
HaritikaChhatwal1
 
Corporate finance for ce os
Corporate finance for ce osCorporate finance for ce os
Corporate finance for ce os
Bharath Ram Srinivasan
 
Relative valuation and private company valuation
Relative valuation and private company valuationRelative valuation and private company valuation
Relative valuation and private company valuation
Babasab Patil
 
PEI October - Interview with Jim Corey
PEI October -  Interview with Jim CoreyPEI October -  Interview with Jim Corey
PEI October - Interview with Jim CoreyCorey Torrence
 
There are many different things that can cause a company’s actual .docx
There are many different things that can cause a company’s actual .docxThere are many different things that can cause a company’s actual .docx
There are many different things that can cause a company’s actual .docx
rorye
 
Panel Data Regression Analysis on Factors Affecting Firm Value in Manufacturi...
Panel Data Regression Analysis on Factors Affecting Firm Value in Manufacturi...Panel Data Regression Analysis on Factors Affecting Firm Value in Manufacturi...
Panel Data Regression Analysis on Factors Affecting Firm Value in Manufacturi...
Trisnadi Wijaya
 
All You Need To Know About Equity Valuation Methods
All You Need To Know About Equity Valuation MethodsAll You Need To Know About Equity Valuation Methods
All You Need To Know About Equity Valuation Methods
United States Private Equity Council
 
How to Grow a Business - Summary
How to Grow a Business - SummaryHow to Grow a Business - Summary
How to Grow a Business - SummaryBob Kacergis
 
Introduction to fundamental analysis project
Introduction to fundamental analysis   projectIntroduction to fundamental analysis   project
Introduction to fundamental analysis project
Afzalshah Sayed
 
Value stock drivers
Value stock driversValue stock drivers
Value stock driversgoplaninick
 
Valuation presentation
Valuation presentationValuation presentation
Valuation presentation
Majd Ghanem,MBA
 
How to read financial results like a veteran
How to read financial results like a veteranHow to read financial results like a veteran
How to read financial results like a veteran
Vunani Private Clients
 
Value Creation And Measurment.docx
Value Creation And Measurment.docxValue Creation And Measurment.docx
Value Creation And Measurment.docx
ahmedsaeed514734
 
Valuation Basics
Valuation BasicsValuation Basics
Valuation Basics
Anjana Vivek
 
The objective of the firm
The objective of the firmThe objective of the firm
The objective of the firm
Babasab Patil
 
The objective of the firm
The objective of the firmThe objective of the firm
The objective of the firm
Babasab Patil
 
Corporate finance notes
Corporate finance notes Corporate finance notes
Corporate finance notes
Babasab Patil
 

Similar to M&A deal evaluation (20)

This discussion has 2 partsYou are working as a financial.docx
This discussion has 2 partsYou are working as a financial.docxThis discussion has 2 partsYou are working as a financial.docx
This discussion has 2 partsYou are working as a financial.docx
 
Explain the various categories of ratio analysis and provide example.pdf
Explain the various categories of ratio analysis and provide example.pdfExplain the various categories of ratio analysis and provide example.pdf
Explain the various categories of ratio analysis and provide example.pdf
 
DIAS PRESENTATION.pptx
DIAS PRESENTATION.pptxDIAS PRESENTATION.pptx
DIAS PRESENTATION.pptx
 
Corporate finance for ce os
Corporate finance for ce osCorporate finance for ce os
Corporate finance for ce os
 
Relative valuation and private company valuation
Relative valuation and private company valuationRelative valuation and private company valuation
Relative valuation and private company valuation
 
PEI October - Interview with Jim Corey
PEI October -  Interview with Jim CoreyPEI October -  Interview with Jim Corey
PEI October - Interview with Jim Corey
 
There are many different things that can cause a company’s actual .docx
There are many different things that can cause a company’s actual .docxThere are many different things that can cause a company’s actual .docx
There are many different things that can cause a company’s actual .docx
 
Panel Data Regression Analysis on Factors Affecting Firm Value in Manufacturi...
Panel Data Regression Analysis on Factors Affecting Firm Value in Manufacturi...Panel Data Regression Analysis on Factors Affecting Firm Value in Manufacturi...
Panel Data Regression Analysis on Factors Affecting Firm Value in Manufacturi...
 
All You Need To Know About Equity Valuation Methods
All You Need To Know About Equity Valuation MethodsAll You Need To Know About Equity Valuation Methods
All You Need To Know About Equity Valuation Methods
 
How to Grow a Business - Summary
How to Grow a Business - SummaryHow to Grow a Business - Summary
How to Grow a Business - Summary
 
Introduction to fundamental analysis project
Introduction to fundamental analysis   projectIntroduction to fundamental analysis   project
Introduction to fundamental analysis project
 
Value stock drivers
Value stock driversValue stock drivers
Value stock drivers
 
Valuation presentation
Valuation presentationValuation presentation
Valuation presentation
 
How to read financial results like a veteran
How to read financial results like a veteranHow to read financial results like a veteran
How to read financial results like a veteran
 
Value Creation And Measurment.docx
Value Creation And Measurment.docxValue Creation And Measurment.docx
Value Creation And Measurment.docx
 
Valuation Basics
Valuation BasicsValuation Basics
Valuation Basics
 
FM1.docx
FM1.docxFM1.docx
FM1.docx
 
The objective of the firm
The objective of the firmThe objective of the firm
The objective of the firm
 
The objective of the firm
The objective of the firmThe objective of the firm
The objective of the firm
 
Corporate finance notes
Corporate finance notes Corporate finance notes
Corporate finance notes
 

Recently uploaded

Organizational Change Leadership Agile Tour Geneve 2024
Organizational Change Leadership Agile Tour Geneve 2024Organizational Change Leadership Agile Tour Geneve 2024
Organizational Change Leadership Agile Tour Geneve 2024
Kirill Klimov
 
Authentically Social Presented by Corey Perlman
Authentically Social Presented by Corey PerlmanAuthentically Social Presented by Corey Perlman
Authentically Social Presented by Corey Perlman
Corey Perlman, Social Media Speaker and Consultant
 
Auditing study material for b.com final year students
Auditing study material for b.com final year  studentsAuditing study material for b.com final year  students
Auditing study material for b.com final year students
narasimhamurthyh4
 
Agency Managed Advisory Board As a Solution To Career Path Defining Business ...
Agency Managed Advisory Board As a Solution To Career Path Defining Business ...Agency Managed Advisory Board As a Solution To Career Path Defining Business ...
Agency Managed Advisory Board As a Solution To Career Path Defining Business ...
Boris Ziegler
 
The effects of customers service quality and online reviews on customer loyal...
The effects of customers service quality and online reviews on customer loyal...The effects of customers service quality and online reviews on customer loyal...
The effects of customers service quality and online reviews on customer loyal...
balatucanapplelovely
 
Building Your Employer Brand with Social Media
Building Your Employer Brand with Social MediaBuilding Your Employer Brand with Social Media
Building Your Employer Brand with Social Media
LuanWise
 
ikea_woodgreen_petscharity_dog-alogue_digital.pdf
ikea_woodgreen_petscharity_dog-alogue_digital.pdfikea_woodgreen_petscharity_dog-alogue_digital.pdf
ikea_woodgreen_petscharity_dog-alogue_digital.pdf
agatadrynko
 
Buy Verified PayPal Account | Buy Google 5 Star Reviews
Buy Verified PayPal Account | Buy Google 5 Star ReviewsBuy Verified PayPal Account | Buy Google 5 Star Reviews
Buy Verified PayPal Account | Buy Google 5 Star Reviews
usawebmarket
 
Company Valuation webinar series - Tuesday, 4 June 2024
Company Valuation webinar series - Tuesday, 4 June 2024Company Valuation webinar series - Tuesday, 4 June 2024
Company Valuation webinar series - Tuesday, 4 June 2024
FelixPerez547899
 
Affordable Stationery Printing Services in Jaipur | Navpack n Print
Affordable Stationery Printing Services in Jaipur | Navpack n PrintAffordable Stationery Printing Services in Jaipur | Navpack n Print
Affordable Stationery Printing Services in Jaipur | Navpack n Print
Navpack & Print
 
Evgen Osmak: Methods of key project parameters estimation: from the shaman-in...
Evgen Osmak: Methods of key project parameters estimation: from the shaman-in...Evgen Osmak: Methods of key project parameters estimation: from the shaman-in...
Evgen Osmak: Methods of key project parameters estimation: from the shaman-in...
Lviv Startup Club
 
Authentically Social by Corey Perlman - EO Puerto Rico
Authentically Social by Corey Perlman - EO Puerto RicoAuthentically Social by Corey Perlman - EO Puerto Rico
Authentically Social by Corey Perlman - EO Puerto Rico
Corey Perlman, Social Media Speaker and Consultant
 
BeMetals Investor Presentation_June 1, 2024.pdf
BeMetals Investor Presentation_June 1, 2024.pdfBeMetals Investor Presentation_June 1, 2024.pdf
BeMetals Investor Presentation_June 1, 2024.pdf
DerekIwanaka1
 
Training my puppy and implementation in this story
Training my puppy and implementation in this storyTraining my puppy and implementation in this story
Training my puppy and implementation in this story
WilliamRodrigues148
 
Project File Report BBA 6th semester.pdf
Project File Report BBA 6th semester.pdfProject File Report BBA 6th semester.pdf
Project File Report BBA 6th semester.pdf
RajPriye
 
The Influence of Marketing Strategy and Market Competition on Business Perfor...
The Influence of Marketing Strategy and Market Competition on Business Perfor...The Influence of Marketing Strategy and Market Competition on Business Perfor...
The Influence of Marketing Strategy and Market Competition on Business Perfor...
Adam Smith
 
Meas_Dylan_DMBS_PB1_2024-05XX_Revised.pdf
Meas_Dylan_DMBS_PB1_2024-05XX_Revised.pdfMeas_Dylan_DMBS_PB1_2024-05XX_Revised.pdf
Meas_Dylan_DMBS_PB1_2024-05XX_Revised.pdf
dylandmeas
 
Cracking the Workplace Discipline Code Main.pptx
Cracking the Workplace Discipline Code Main.pptxCracking the Workplace Discipline Code Main.pptx
Cracking the Workplace Discipline Code Main.pptx
Workforce Group
 
Enterprise Excellence is Inclusive Excellence.pdf
Enterprise Excellence is Inclusive Excellence.pdfEnterprise Excellence is Inclusive Excellence.pdf
Enterprise Excellence is Inclusive Excellence.pdf
KaiNexus
 
Business Valuation Principles for Entrepreneurs
Business Valuation Principles for EntrepreneursBusiness Valuation Principles for Entrepreneurs
Business Valuation Principles for Entrepreneurs
Ben Wann
 

Recently uploaded (20)

Organizational Change Leadership Agile Tour Geneve 2024
Organizational Change Leadership Agile Tour Geneve 2024Organizational Change Leadership Agile Tour Geneve 2024
Organizational Change Leadership Agile Tour Geneve 2024
 
Authentically Social Presented by Corey Perlman
Authentically Social Presented by Corey PerlmanAuthentically Social Presented by Corey Perlman
Authentically Social Presented by Corey Perlman
 
Auditing study material for b.com final year students
Auditing study material for b.com final year  studentsAuditing study material for b.com final year  students
Auditing study material for b.com final year students
 
Agency Managed Advisory Board As a Solution To Career Path Defining Business ...
Agency Managed Advisory Board As a Solution To Career Path Defining Business ...Agency Managed Advisory Board As a Solution To Career Path Defining Business ...
Agency Managed Advisory Board As a Solution To Career Path Defining Business ...
 
The effects of customers service quality and online reviews on customer loyal...
The effects of customers service quality and online reviews on customer loyal...The effects of customers service quality and online reviews on customer loyal...
The effects of customers service quality and online reviews on customer loyal...
 
Building Your Employer Brand with Social Media
Building Your Employer Brand with Social MediaBuilding Your Employer Brand with Social Media
Building Your Employer Brand with Social Media
 
ikea_woodgreen_petscharity_dog-alogue_digital.pdf
ikea_woodgreen_petscharity_dog-alogue_digital.pdfikea_woodgreen_petscharity_dog-alogue_digital.pdf
ikea_woodgreen_petscharity_dog-alogue_digital.pdf
 
Buy Verified PayPal Account | Buy Google 5 Star Reviews
Buy Verified PayPal Account | Buy Google 5 Star ReviewsBuy Verified PayPal Account | Buy Google 5 Star Reviews
Buy Verified PayPal Account | Buy Google 5 Star Reviews
 
Company Valuation webinar series - Tuesday, 4 June 2024
Company Valuation webinar series - Tuesday, 4 June 2024Company Valuation webinar series - Tuesday, 4 June 2024
Company Valuation webinar series - Tuesday, 4 June 2024
 
Affordable Stationery Printing Services in Jaipur | Navpack n Print
Affordable Stationery Printing Services in Jaipur | Navpack n PrintAffordable Stationery Printing Services in Jaipur | Navpack n Print
Affordable Stationery Printing Services in Jaipur | Navpack n Print
 
Evgen Osmak: Methods of key project parameters estimation: from the shaman-in...
Evgen Osmak: Methods of key project parameters estimation: from the shaman-in...Evgen Osmak: Methods of key project parameters estimation: from the shaman-in...
Evgen Osmak: Methods of key project parameters estimation: from the shaman-in...
 
Authentically Social by Corey Perlman - EO Puerto Rico
Authentically Social by Corey Perlman - EO Puerto RicoAuthentically Social by Corey Perlman - EO Puerto Rico
Authentically Social by Corey Perlman - EO Puerto Rico
 
BeMetals Investor Presentation_June 1, 2024.pdf
BeMetals Investor Presentation_June 1, 2024.pdfBeMetals Investor Presentation_June 1, 2024.pdf
BeMetals Investor Presentation_June 1, 2024.pdf
 
Training my puppy and implementation in this story
Training my puppy and implementation in this storyTraining my puppy and implementation in this story
Training my puppy and implementation in this story
 
Project File Report BBA 6th semester.pdf
Project File Report BBA 6th semester.pdfProject File Report BBA 6th semester.pdf
Project File Report BBA 6th semester.pdf
 
The Influence of Marketing Strategy and Market Competition on Business Perfor...
The Influence of Marketing Strategy and Market Competition on Business Perfor...The Influence of Marketing Strategy and Market Competition on Business Perfor...
The Influence of Marketing Strategy and Market Competition on Business Perfor...
 
Meas_Dylan_DMBS_PB1_2024-05XX_Revised.pdf
Meas_Dylan_DMBS_PB1_2024-05XX_Revised.pdfMeas_Dylan_DMBS_PB1_2024-05XX_Revised.pdf
Meas_Dylan_DMBS_PB1_2024-05XX_Revised.pdf
 
Cracking the Workplace Discipline Code Main.pptx
Cracking the Workplace Discipline Code Main.pptxCracking the Workplace Discipline Code Main.pptx
Cracking the Workplace Discipline Code Main.pptx
 
Enterprise Excellence is Inclusive Excellence.pdf
Enterprise Excellence is Inclusive Excellence.pdfEnterprise Excellence is Inclusive Excellence.pdf
Enterprise Excellence is Inclusive Excellence.pdf
 
Business Valuation Principles for Entrepreneurs
Business Valuation Principles for EntrepreneursBusiness Valuation Principles for Entrepreneurs
Business Valuation Principles for Entrepreneurs
 

M&A deal evaluation

  • 1. 1M&A Deal Evaluation: Challenging Metrics Myths M&A Deal Evaluation: Challenging Metrics Myths In the world of mergers and acquisitions, emphasis is often placed on evaluation metrics that look as if they tell the story, but they can be misleading.
  • 2. 2M&A Deal Evaluation: Challenging Metrics Myths The presentation was over. The CEO of a global business-services group had been part of a due diligence process to advise on whether or not to proceed with a major European acquisition. Our job was to help the CEO and the board answer some important questions: Was the target company a good fit? How did synergies stack up against the risks? Did the target company’s sector show potential for growth? Our findings were less than encouraging. They suggested limited growth going forward, and even though the potential for synergies was good, the risks were significant, and there were doubts about the company’s ability to deliver those synergies. As we walked out of the meeting, the CEO was digesting all that he had just heard and contem- plating the board’s likely reaction to our findings. Then he spoke: “Well, there’s one thing we can say about this acquisition—it’s highly earnings accretive.” An argument to support the myth that EPS accretion equates to value creation is that “some people believe it does”—a misperception that is then priced into the stock. What does that mean? Does the fact that a deal is accretive necessarily mean that it’s a good move? Conversely, are deals that dilute earnings per share (EPS) necessarily bad moves? Should we even use EPS as a measure by which to evaluate an M&A transaction? In this paper, we discuss findings from our research into the metrics and analyses most frequently used to evaluate proposed mergers and acquisitions. The research introduced a surprising insight: The impact on EPS is by far the most emphasized metric used to evaluate proposed M&A transactions between public companies. With this in mind, we look at two common and related myths surrounding EPS and demonstrate why these are at best unhelpful and at worst potentially misleading. We also examine what business leaders and market analysts should focus on instead. As always, our advice is pragmatic: Stick to the business fundamentals. How Do They Get It So Wrong? It is widely recognized that a significant percentage of M&A transactions fail to deliver value to shareholders. What goes wrong? How is it that acquisitions on average seem to create negligible returns? It can be tempting to blame poor merger integration for the meager returns, and certainly the execution of an integration can have a major impact on whether or not a transaction is regarded as successful. However, it may also be useful to consider if the deal was worth doing in the first place. Maybe some transactions should never have happened. With this in mind, A.T. Kearney joined forces with the UK’s Investor Relations Society (IR Society) to understand exactly which metrics and analyses get the most emphasis in evaluating proposed
  • 3. 3M&A Deal Evaluation: Challenging Metrics Myths M&A transactions. Maybe the solution to the question of “what goes wrong” lies in the tools used to filter (and one would hope eliminate) value-destroying transactions from those that create value. Investor Relations professionals were surveyed to gauge the views of key stakeholders— company executives, sell-side analysts, and investors—on 10 frequently used metrics and analyses (see sidebar: M&A Metrics—Why the Difference in Emphasis? on page 4). We found that EPS analysis is used most, and by a wide margin: 75 percent of respondents ranked it in the “strong emphasis” category, fully 26 points ahead of enterprise value/EBITDA, the number two rated metric (see figure 1). All stakeholders (% respondents) EPS accretion/ dilution 6% 10% 4% 10% 10% 6% Enterprise value/ EBITDA Price earnings ratio (P/E) Debt ratio analyses DCF valuation Price/book value Cultural fit assessment Cost of capital analysis Core capabilities assessment Enterprise value/ revenues Note: Stakeholders include company executives, sell-side analysts, and investors; EPS is earnings-per-share; DCF is discounted cash flow. Source: A.T. Kearney and Investor Relations Society, 2013 Figure 1 EPS accretion/dilution analysis is given the most emphasis in evaluating proposed M&A transactions 2% 2% 2% 2% 2% 22% 6% 8% 16% 41% 33% 29% 65% 4% 20% 49% 29% 27% 47% 22% 8% 57% 25% 22% 53% 16% 22% 53% 20% 45% 45% 39% 49% 75% Strong emphasis Some emphasis No emphasis Don’t know What Exactly Is EPS Accretion and EPS Dilution? Before we go any further, let’s define what we mean by EPS accretion and EPS dilution. A company’s EPS—again, earnings per share—is simply the total profit allocated to each outstanding share. EPS growth can be achieved either organically or inorganically through M&A activity, and few would argue that organic EPS growth is anything other than a positive indicator. EPS growth delivered through M&A activity, that is, EPS accretion, is fundamentally different. Yet there
  • 4. 4M&A Deal Evaluation: Challenging Metrics Myths are some commonly held beliefs—or, more accurately, myths—to suggest this distinction is not fully understood by many experienced investment professionals, including some company executives (see sidebar: The Lingering Myth of EPS Accretion on page 8).1 Two myths are widely believed: • EPS accretive transactions create value. • EPS dilutive transactions destroy value. As we will see, neither of these preconceptions stands up to scrutiny. Why then do so many executives and others persist in using EPS analysis to evaluate M&A transactions? 1 Not all M&A transactions grow EPS. Some transactions reduce EPS, resulting in EPS dilution. Company executives Sell-side analysts Investors Source: A.T. Kearney and Investor Relations Society, 2013 Figure How much emphasis is given to EPS accretion or dilution analysis in evaluating proposed M&A transactions? 41% 88% 18% 76% 59% Strong emphasis Some emphasis No emphasis Don’t know 6%6% 6% M&A Metrics: Why the Difference in Emphasis? To learn how different stake- holder groups view earnings- per-share (EPS) analysis as a metric for evaluating mergers and acquisitions, members of the UK-based Investor Relations Society were surveyed regarding the emphasis that key stake- holders (company executives, sell-side analysts, and investors) give to 10 frequently used metrics and analyses. All stake- holders have “skin in the game” but, as it turns out, significantly different perspectives on the extent to which they emphasize EPS analysis. The biggest contrast was among those who strongly emphasize EPS— company executives (59 percent) and investors (88 percent). Sell-side analysts were in the middle at 76 percent (see figure). Perhaps these results are not so surprising. Company executives are likely to take a more all- encompassing, or perhaps more strategic, view of a merger’s impact. But should that be the case? Shouldn’t all parties be striving for the same objective assessment of a deal’s benefits and the extent to which it will strengthen competitive position and ultimately, generate share- holder value through increased cash flow? This raises an interesting question: Which group is more correct? Our answer is that while company executives place significantly less emphasis on EPS analysis, all three groups pay far more attention to the metric than it merits.
  • 5. 5M&A Deal Evaluation: Challenging Metrics Myths The answer comes down to views about valuation. A company’s stock is frequently valued on the basis of its EPS by applying a price-to-earnings (P/E) ratio. Based on the assumption that an acquiring company’s P/E ratio will stay the same after an acquisition, if earnings per share increase, then the company’s overall value will increase, ostensibly as a result of the deal. What’s the Catch? But, there’s a catch. To understand it you need to consider the fundamentals of why one company has a higher P/E ratio than another in the first place. It is because the market believes the earnings of the company with the higher P/E ratio—call it Company A—will rise faster than those of the company with a lower P/E ratio (Company B).2 Now suppose Company A buys Company B, using its stock as the acquisition currency. As a result of the purchase the EPS of the combined company will be higher than that of Company A had it not made the acquisition— thus the transaction is EPS accretive for Company A. They call it the “bootstrap game.” If companies can fool investors by buying a company with lower P/E rated stocks, then why not continue to do so? But being EPS accretive comes with a downside—and that’s the catch. The newly combined company will also have a lower earnings growth rate than Company A would have had as a standalone company. So while the EPS of the post-acquisition company will be higher than that of the pre-acquisition Company A, its P/E ratio will be lower due to its acquisition of the lower-P/E rated Company B. In fact, the reduction in the P/E ratio, all other things being equal, will exactly counterbalance the impact of the higher EPS. The result is that the valuation of the newly combined company will reflect the blended higher EPS and lower P/E ratio of the two original companies. In other words, no value is created. A key reason for doing an M&A deal is, of course, the synergies that can result. By increasing the new entity’s combined earnings, synergies can add enough value to make the combined company worth more than the two individual companies were before the merger. It is important to note that the increased value results from the synergies created, not from the deal being EPS accretive or dilutive. It is quite possible that highly dilutive deals offer the greatest opportunities for delivering synergies. An argument sometimes put forward to support the myth that EPS accretion equates to value creation is that “people believe it does.” This becomes reality as the misperception is priced into the stock. 2 Alternatively, it believes that earnings are more sustainable than the earnings in the lower-rated company. This paper adheres to the idea that earnings will grow faster in the company with the higher P/E ratio. In reality, the two ideas relate to the same thing— the strength of the earnings stream a company generates.
  • 6. 6M&A Deal Evaluation: Challenging Metrics Myths Richard A. Brealey and Stewart C. Myers write about this idea in their seminal textbook, Principles of Corporate Finance. They call it the “bootstrap game.” If companies can fool investors by buying a company with lower P/E rated stocks, then why not continue to do so? The flaw in the bootstrap game is the need to keep the market fooled, hoping it doesn’t notice that the acquiring company’s earnings growth potential is becoming progressively more diluted. The inevitable result of pursuing such a strategy to its logical conclusion by continuing to acquire lower P/E rated companies is clear: In the same way a Ponzi scheme must eventually fail due to the lack of underlying value creation, the P/E multiple of the acquiring company must fall as it becomes increasingly evident to the market that no value is created. What’s the Alternative for Evaluating Proposed Mergers? Our advice for evaluating a proposed merger is characteristically pragmatic: Stick to the funda- mentals. M&A can deliver significant competitive advantage and value to shareholders, but the criteria by which to assess just how much must answer fundamental business questions: • Is the proposed merger strategically logical? • Will it deliver cost, revenue, or other financial synergies? • Will it build management or other capabilities? • Is the combined company capable of delivering the synergies? A thorough, fact-based due diligence is the best way to answer these questions (see figure 2). To understand the business fundamentals of a proposed deal Activities and analysis Source: A.T. Kearney analysis Figure 2 Transaction due diligence overview Strategic options Commercial due diligence Operational due diligence Financial due diligence Legal due diligence • Market dynamics • High-level trends • Business portfolio analysis • Target identifi- cation • Market and customer attractiveness and dynamics • Industry structure and dynamics • Competitive position • Distribution channel dynamics • Top-line oppor- tunities • Business plan review • Risks and oppor- tunities • Cost structures and drivers • Operational improvement potential • Cost synergies assessment • Integration capabilities • Risks and oppor- tunities • Review financial statements and management accounts • Basis for future business plans • Valuation • Deal financing • Target liabilities and potential risks • Competition authority implications • Transaction mechanics, execution, and closing Typical parties involved • Senior managers (CEO, board) • Strategic advisors (consultants, bankers) • Senior management (CEO, strategy director, business development director) • Consultants • CFO • Accountants • Input from commercial and operational due diligence • Company general counsel • Legal advisors Fact-based assessment of value creation potential
  • 7. 7M&A Deal Evaluation: Challenging Metrics Myths Typical opportunity areas Typical synergy value Source: A.T. Kearney Merger Integration Framework Figure 3 Merger synergies originate from three value creation areas Top-line growth, commercial optimization Operations productivity improvement Asset and capital investment rationalization • Cross selling • Product development and innovation • Brand portfolio optimization • Price realization and service offer • Combined innovation pipeline • Leverage sales capabilities • (Negative synergies: customer retention) • Capital investment rationalization • Working capital reduction • Sale of rationalised assets • Operations and supply chain — Manufacturing footprint — Warehouse and logistics footprint • Procurement — Price leveling — Volume consolidation — Strategic sourcing — Procurement transformation • SG&A — Office consolidation — Finance, HR, IT consolidation — Sales and marketing cost reduction — Leverage capabilities and best practice Net 2-3% of combined sales year one 10-15% of combined cost base 10-15% excluding asset sales Merger synergies Accretion or dilution is a fact of doing deals, but is not a measure of potential value creation. For that, you need to examine the deal’s business fundamentals. Of course, there is also a role for using many of the M&A metrics and analyses described in figure 1 as part of an overall assessment. These can play a complementary role in developing a full perspective on a transaction. Used in isolation, however, and without a clear understanding of their limitations, they have a tendency to give a very limited view of the real potential for value creation. Ultimately, any value an M&A transaction creates must translate into future cash flow, resulting from synergies in three value-creation areas: topline growth, operations productivity, and asset and capital investment rationalizations (see figure 3).3 3 The synergies ultimately delivered in a merger are influenced by a number of factors, including the transaction’s strategic goals and the proportion of total spend that is addressable for synergy purposes.
  • 8. 8M&A Deal Evaluation: Challenging Metrics Myths And then there’s the crucial question of how much to pay for a deal and who will realize the value it creates. If the net present value (NPV) of future synergies is paid to the selling share- holders in an acquisition price premium, even the most synergistic of mergers can result in value destruction for the acquirer’s shareholders.5 Always consider who will be the winners in an M&A transaction—the final outcome is rarely the same for all parties. EPS Myths Revisited The moral of the story is this: Too often, too much emphasis is placed on whether a deal is EPS accretive or dilutive. These are time-honored metrics that appear sensible but in reality do not answer the most important question: Should we do the deal? Let’s review the two commonly held myths and why they don’t work as M&A evaluation measures. EPS-accretive transactions create value. Not necessarily. Accretion is a relative measure that simply shows the company being acquired has a lower P/E rated stock. EPS-dilutive transactions are value destroying. Again, not necessarily. In fact, EPS-dilutive transactions can increase value when the target company has good growth potential and the strategic logic for the deal is strong. The fact is that EPS analysis is not a useful tool for evaluating the merits of proposed M&A transactions. Accretion or dilution is a fact of doing deals but is not a measure of potential value creation. For that, you need to examine the deal’s business fundamentals. Our research reveals one more insight: how the emphasis given to the different metrics and analyses has changed over the past decade. Two measures, core capabilities and cultural fit, The Lingering Myth of EPS Accretion In an examination of 30 acquisi- tions performed and announced by publicly owned companies, 68 percent referred to the merger’s potential impact on EPS.4 The prominence given to thismetricattheannouncement reinforcesthelingeringbeliefthat EPSisaproxyforvaluecreation. The EPS accretion myth has lingered for a long time. Here’s why. At first glance, EPS accre- tion appears to be a simple, and therefore appealing, way to determine or communicate whether or not a transaction will create value. In fact, it is logically and mathematically flawed. Large mergers and acquisitions almost always involve the high drama of risk and reward for the parties involved. M&A can make—or break—an executive’s reputation or career, and multimillion-dollar fees and bonuses can be won or lost. Given all that, no wonder every possible argument supporting M&A deals is applied by those trying to make them happen. This is precisely why analysts and other stakeholders need accurate evaluation tools: to make sure all theargumentsformakingthedeal hold water. Despite the frequency with which EPS accretion is alluded to or used to bolster argumentsforthedeal,themetric doesn’t stand up to scrutiny. 4 Companies were randomly selected from a group of transactions in which the acquiring company was U.S.- or UK-based and the transaction satisfied a set of criteria, including deal value of more than $1 billion and 100 percent of the target was acquired. The examination included a review of press releases and transcripts of press conferences where the acquirer announced the deal. 5 The acquisition price premium is typically 20 to 30 percent over the pre-announcement trading price, although this premium is perceived to have fallen in recent years.
  • 9. 9M&A Deal Evaluation: Challenging Metrics Myths the most qualitative among the 10 examined, are among the top measures that have “become more important” in the past decade (see figure 4). This suggests stakeholders are becoming increasingly aware of the conditions necessary for merged organizations to deliver sustained value after the deal has closed and the merger integration process begins. Quick and Easy Shortcuts Can Be Misleading This is not to say a proposed transaction’s impact on EPS isn’t important. It is something that needs to be understood and communicated to investors. The fact remains, however, that doing an EPS-accretive deal is easy—simply buy a company with a lower P/E-rated stock than your own. So the next time someone says or implies that an M&A deal is a good one because it is EPS accretive, ask why the market gave the target company’s stock a lower rating in the first place. To truly understand whether a proposed acquisition will create value requires evaluating the strategic rationale for making the deal, and if it will deliver enough synergies to create value. As with many things in life, quick and easy answers can be misleading. Core capabilities assessment 19% 13% 13% 13% 13% 13% Cultural fit assessment Enterprise value/ EBITDA Cost of capital analysis Debt ratio analyses EPS accretion/ dilution DCF valuation Price earnings ratio (P/E) Enterprise value/ revenues Price/book value Notes: EPS is earnings-per-share; DCF is discounted cash flow. Figures may not resolve due to rounding. Source: A.T. Kearney and Investor Relations Society, 2013 Figure 4 How has the relative importance of each metric and analysis changed over the past 10 years? 25% 19% 13% 25% 19% 13% 31% 44% 44% 25% 13% 19% 38% 31% 13% 69% 6% 19% 56% 13% 13% 50% 25% 25% 56% 6% 38% 44% 38% 44% 50% More important Unchanged Less important Don’t know +50 +44 +44 +31 +31 +13 +6 -6 -13 -19 Net change in perceived importance (percentage points)
  • 10. 10M&A Deal Evaluation: Challenging Metrics Myths Authors Bob Haas, partner, New York robert.haas@atkearney.com Angus Hodgson, principal, London angus.hodgson@atkearney.com The authors wish to thank their colleagues Oliver Lawson and Olga Wittig and the Investor Relations Society for their support in the preparation of this paper. The IR Society is the professional body for those involved in investor relations and the focal point for investor relations in the United Kingdom. For more information, visit www.irs.org.uk.
  • 11. A.T. Kearney is a global team of forward-thinking partners that delivers immediate impact and growing advantage for its clients. We are passionate problem solvers who excel in collaborating across borders to co-create and realize elegantly simple, practical, and sustainable results. Since 1926, we have been trusted advisors on the most mission-critical issues to the world’s leading organizations across all major industries and service sectors. A.T. Kearney has 59 offices located in major business centers across 39 countries. Americas Europe Asia Pacific Middle East and Africa Atlanta Calgary Chicago Dallas Detroit Houston Mexico City New York San Francisco São Paulo Toronto Washington, D.C. Bangkok Beijing Hong Kong Jakarta Kuala Lumpur Melbourne Mumbai New Delhi Seoul Shanghai Singapore Sydney Tokyo Amsterdam Berlin Brussels Bucharest Budapest Copenhagen Düsseldorf Frankfurt Helsinki Istanbul Kiev Lisbon Ljubljana London Madrid Milan Moscow Munich Oslo Paris Prague Rome Stockholm Stuttgart Vienna Warsaw Zurich Abu Dhabi Dubai Johannesburg Manama Riyadh A.T. Kearney Korea LLC is a separate and independent legal entity operating under the A.T. Kearney name in Korea. © 2013, A.T. Kearney, Inc. All rights reserved. The signature of our namesake and founder, Andrew Thomas Kearney, on the cover of this document represents our pledge to live the values he instilled in our firm and uphold his commitment to ensuring “essential rightness” in all that we do. For more information, permission to reprint or translate this work, and all other correspondence, please email: insight@atkearney.com.