Download to read offline

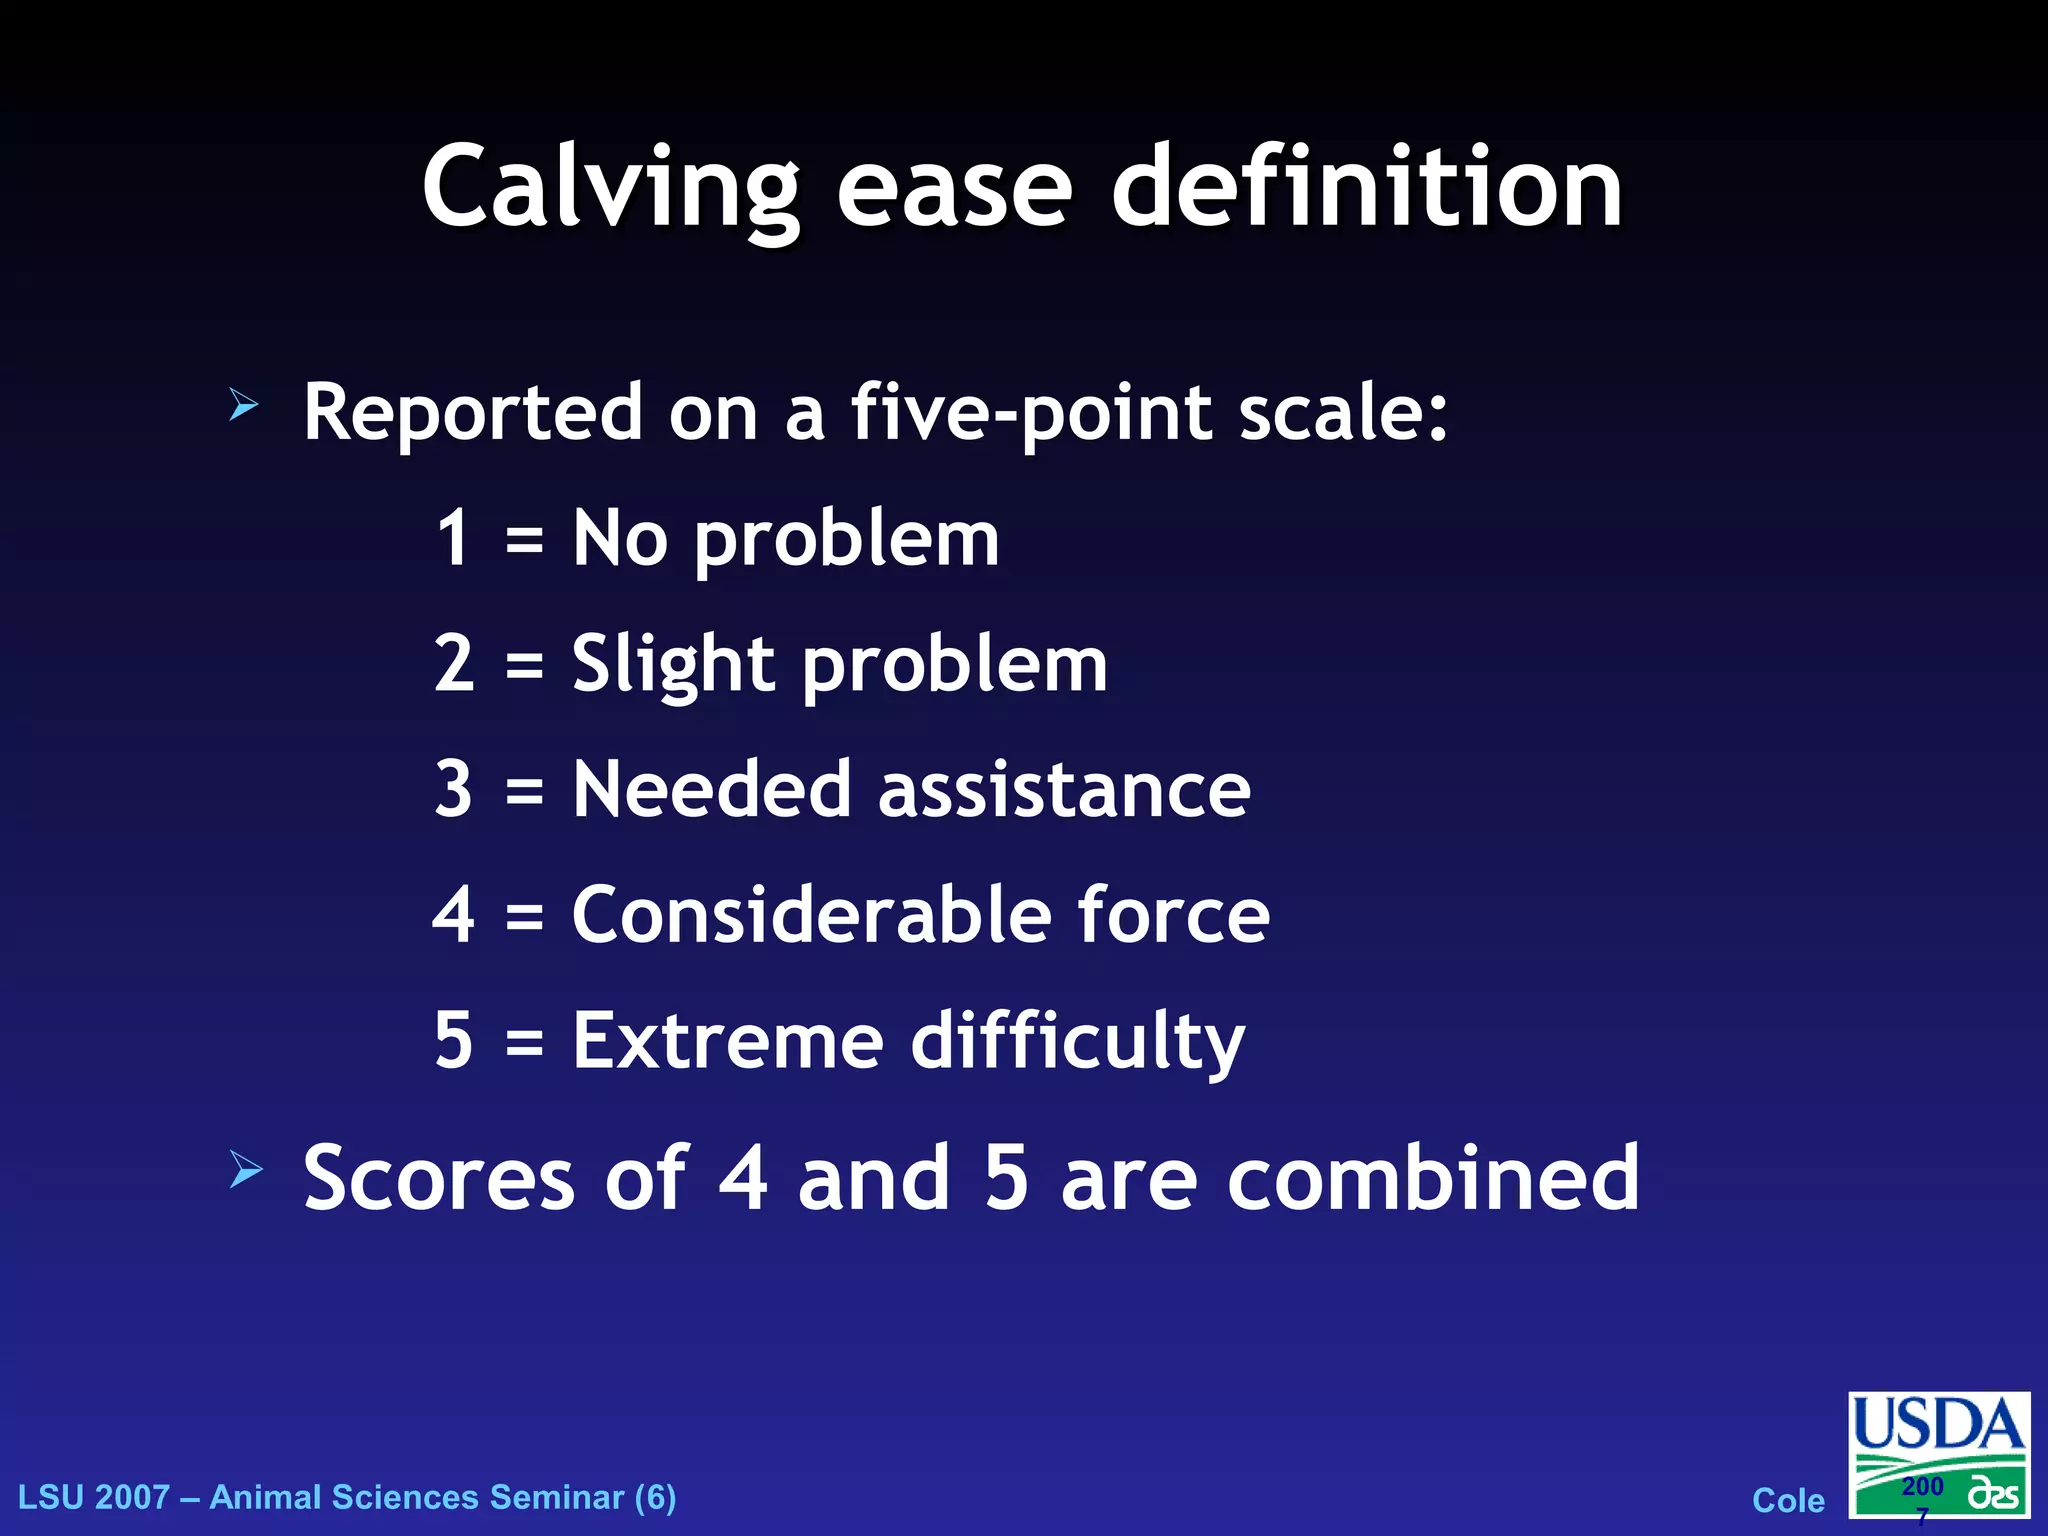
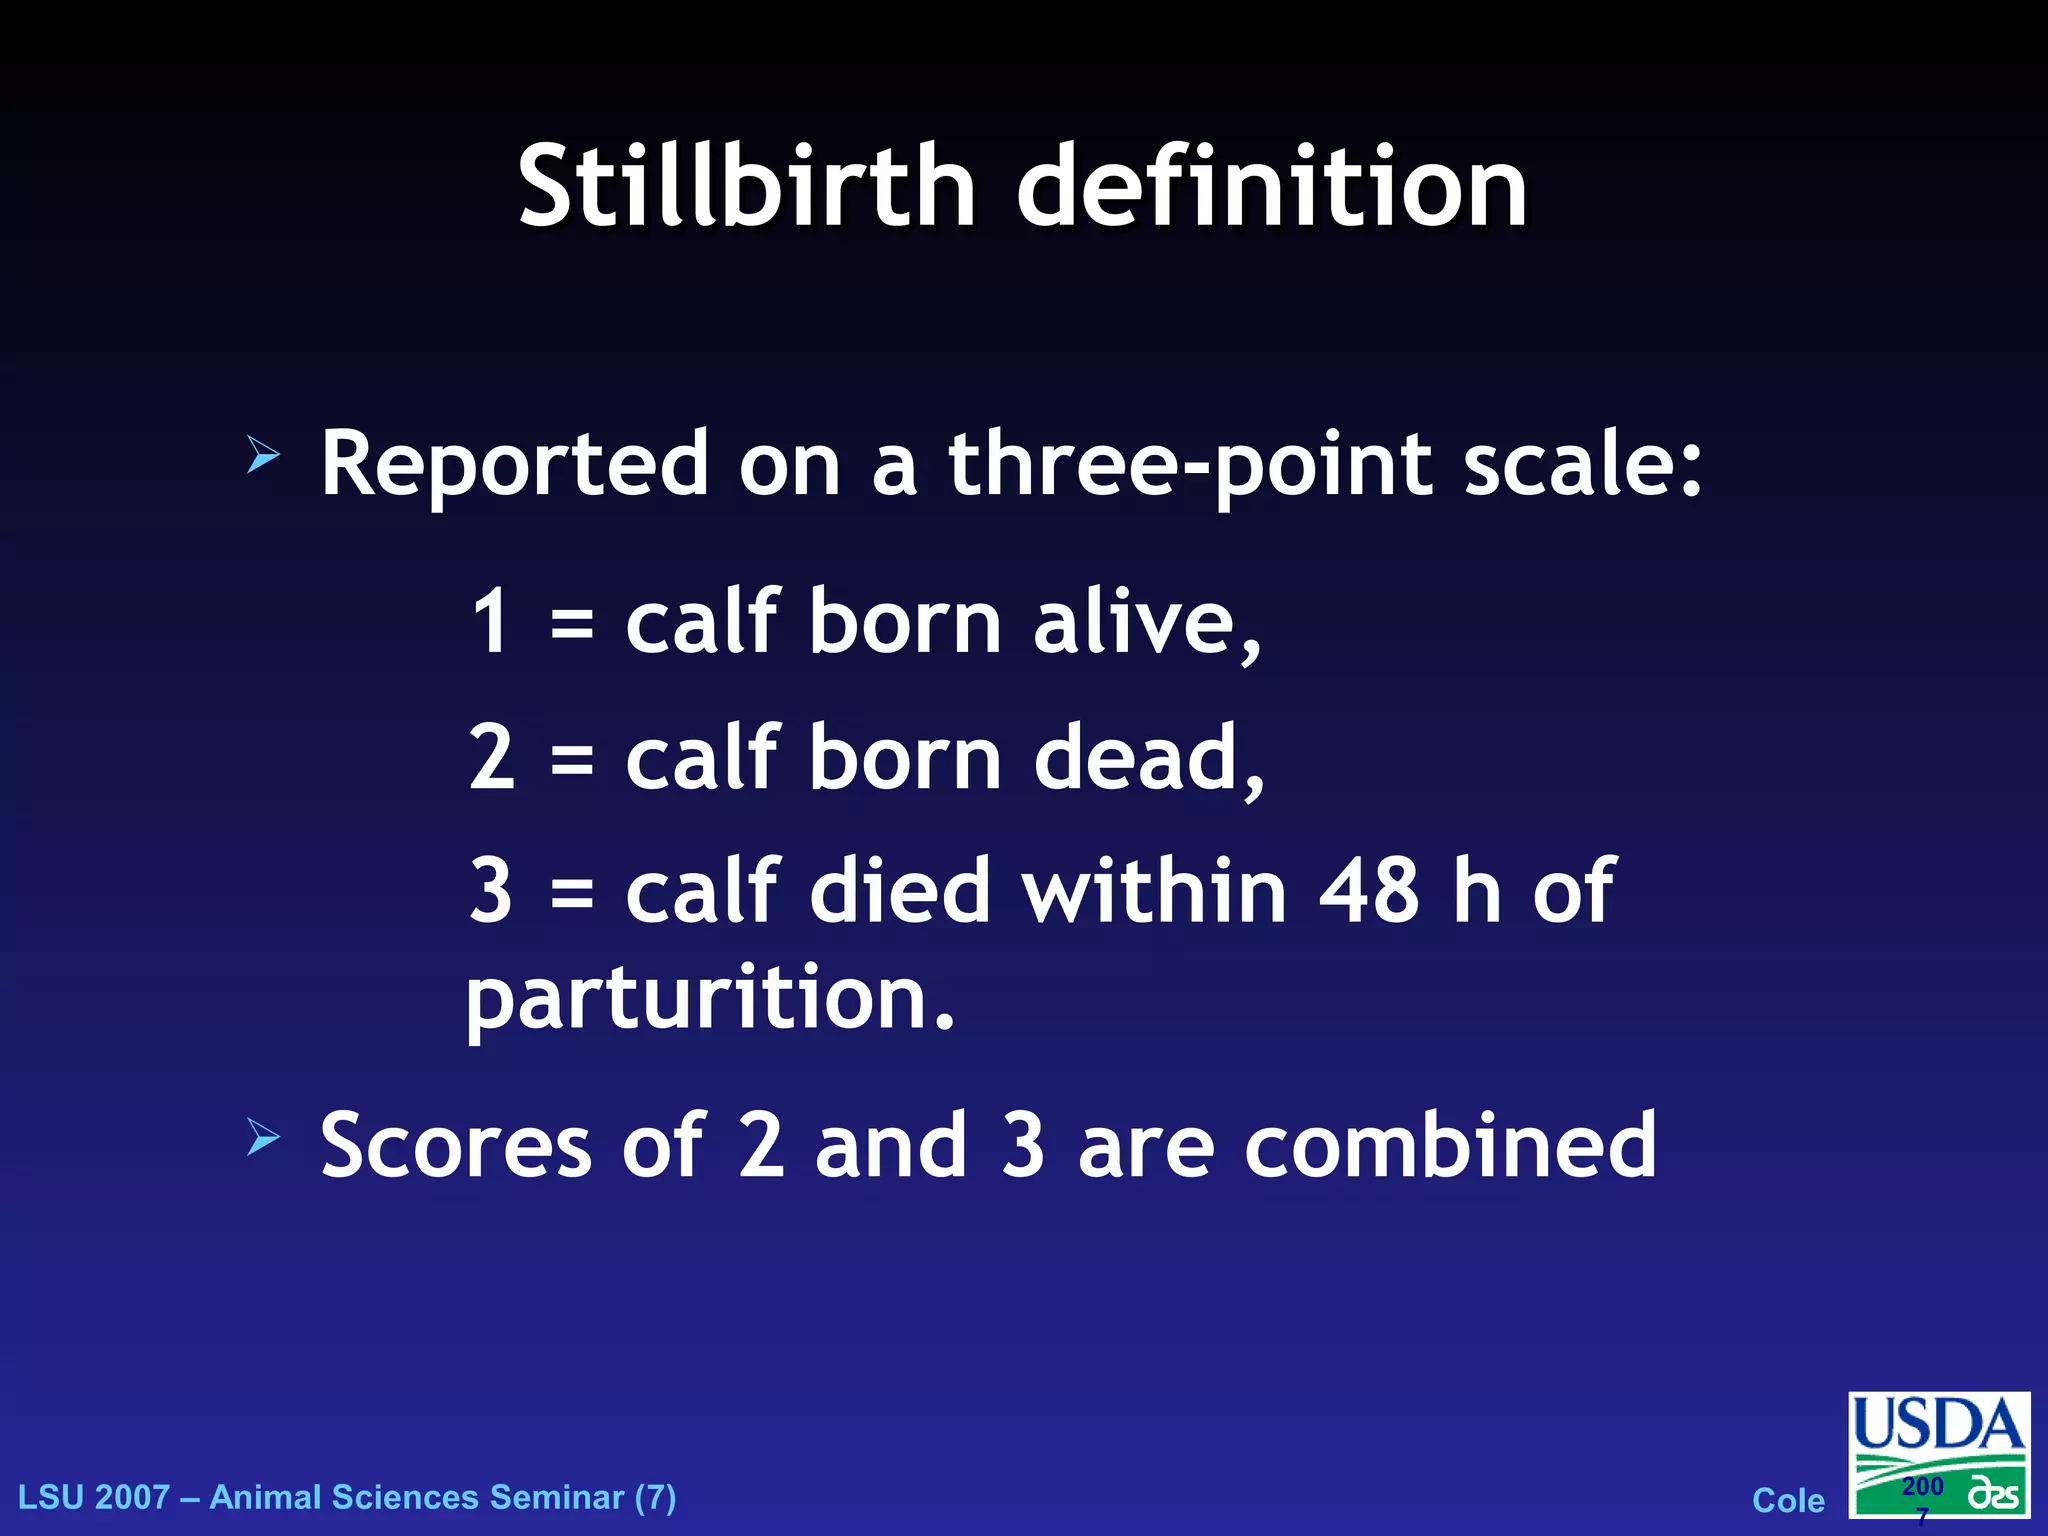
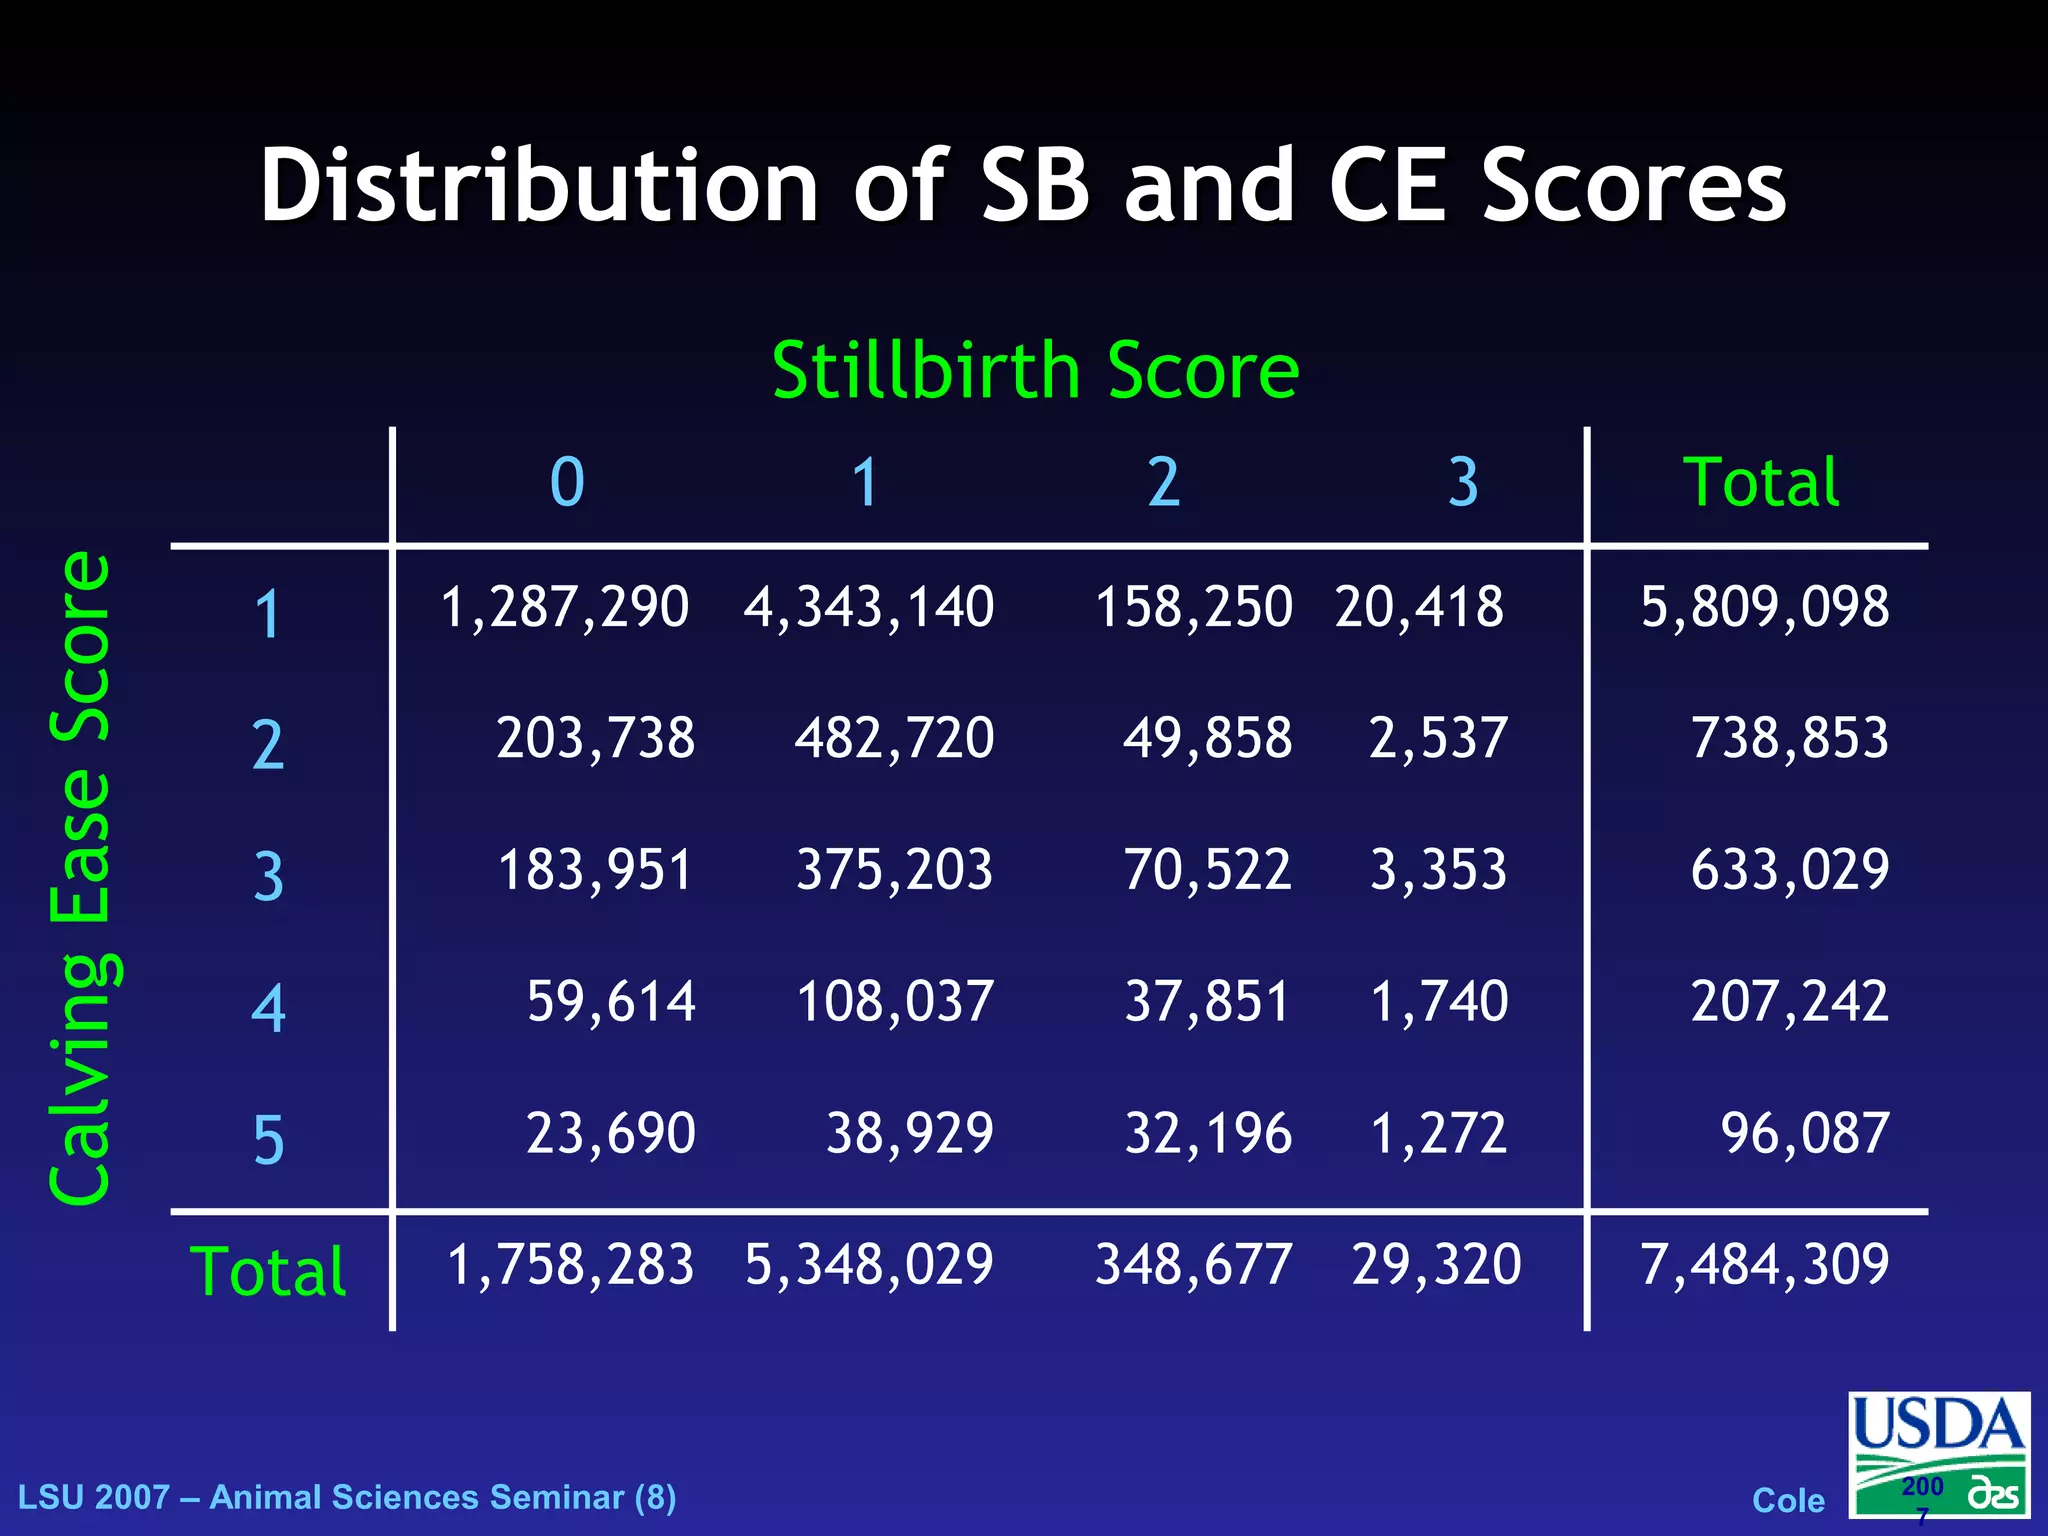
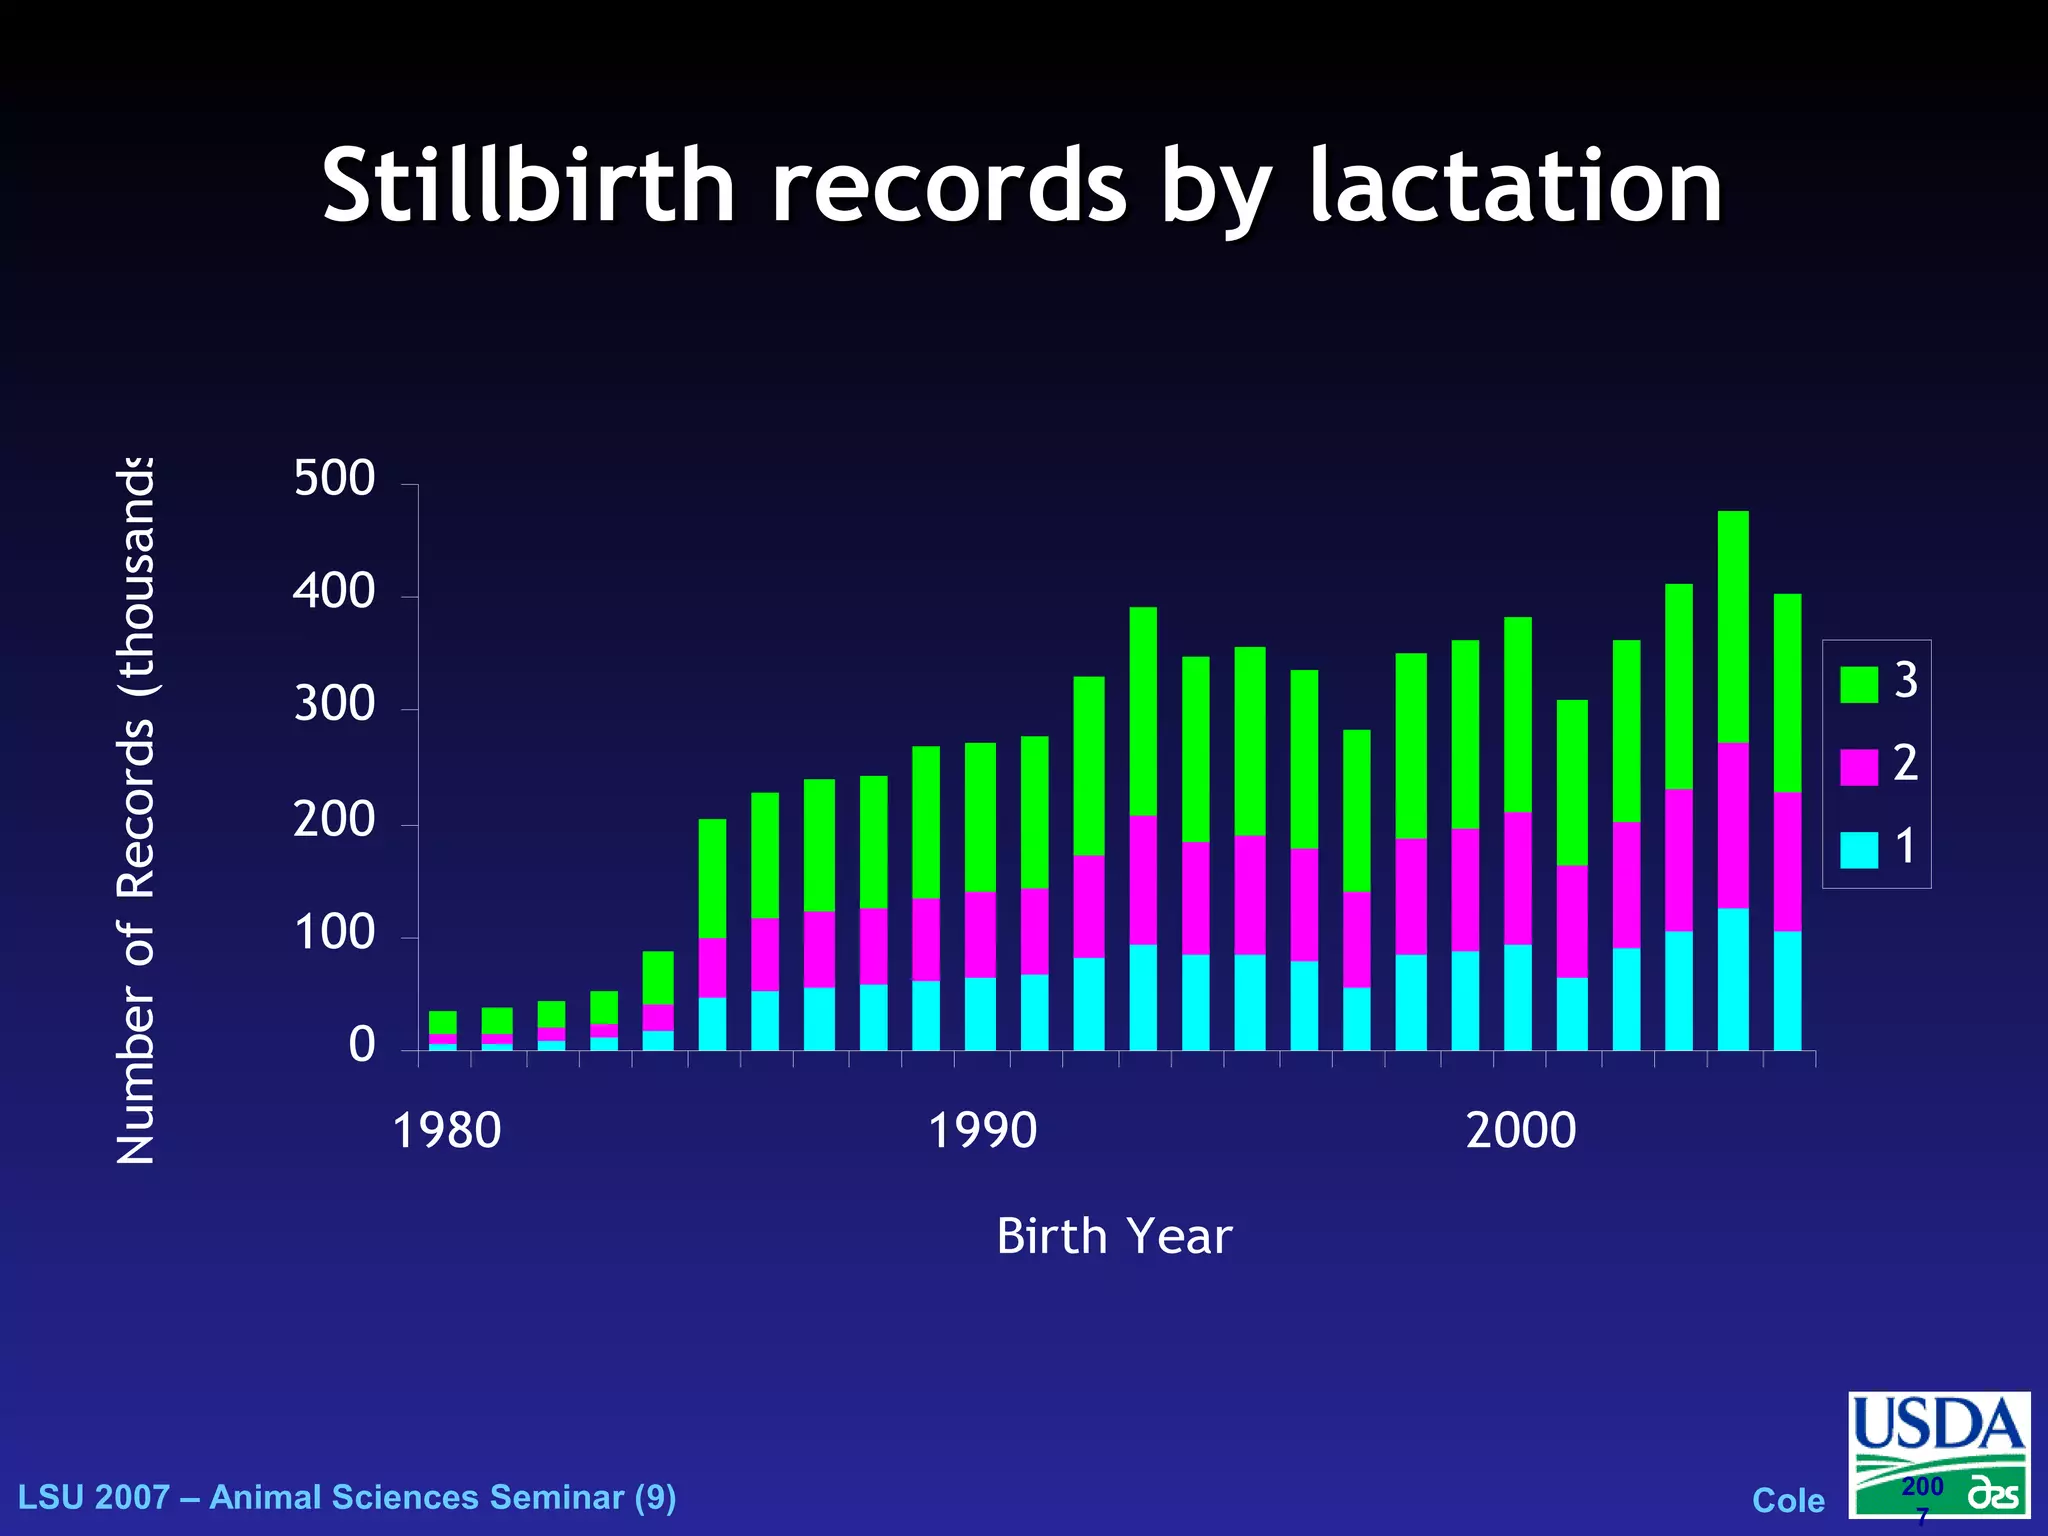
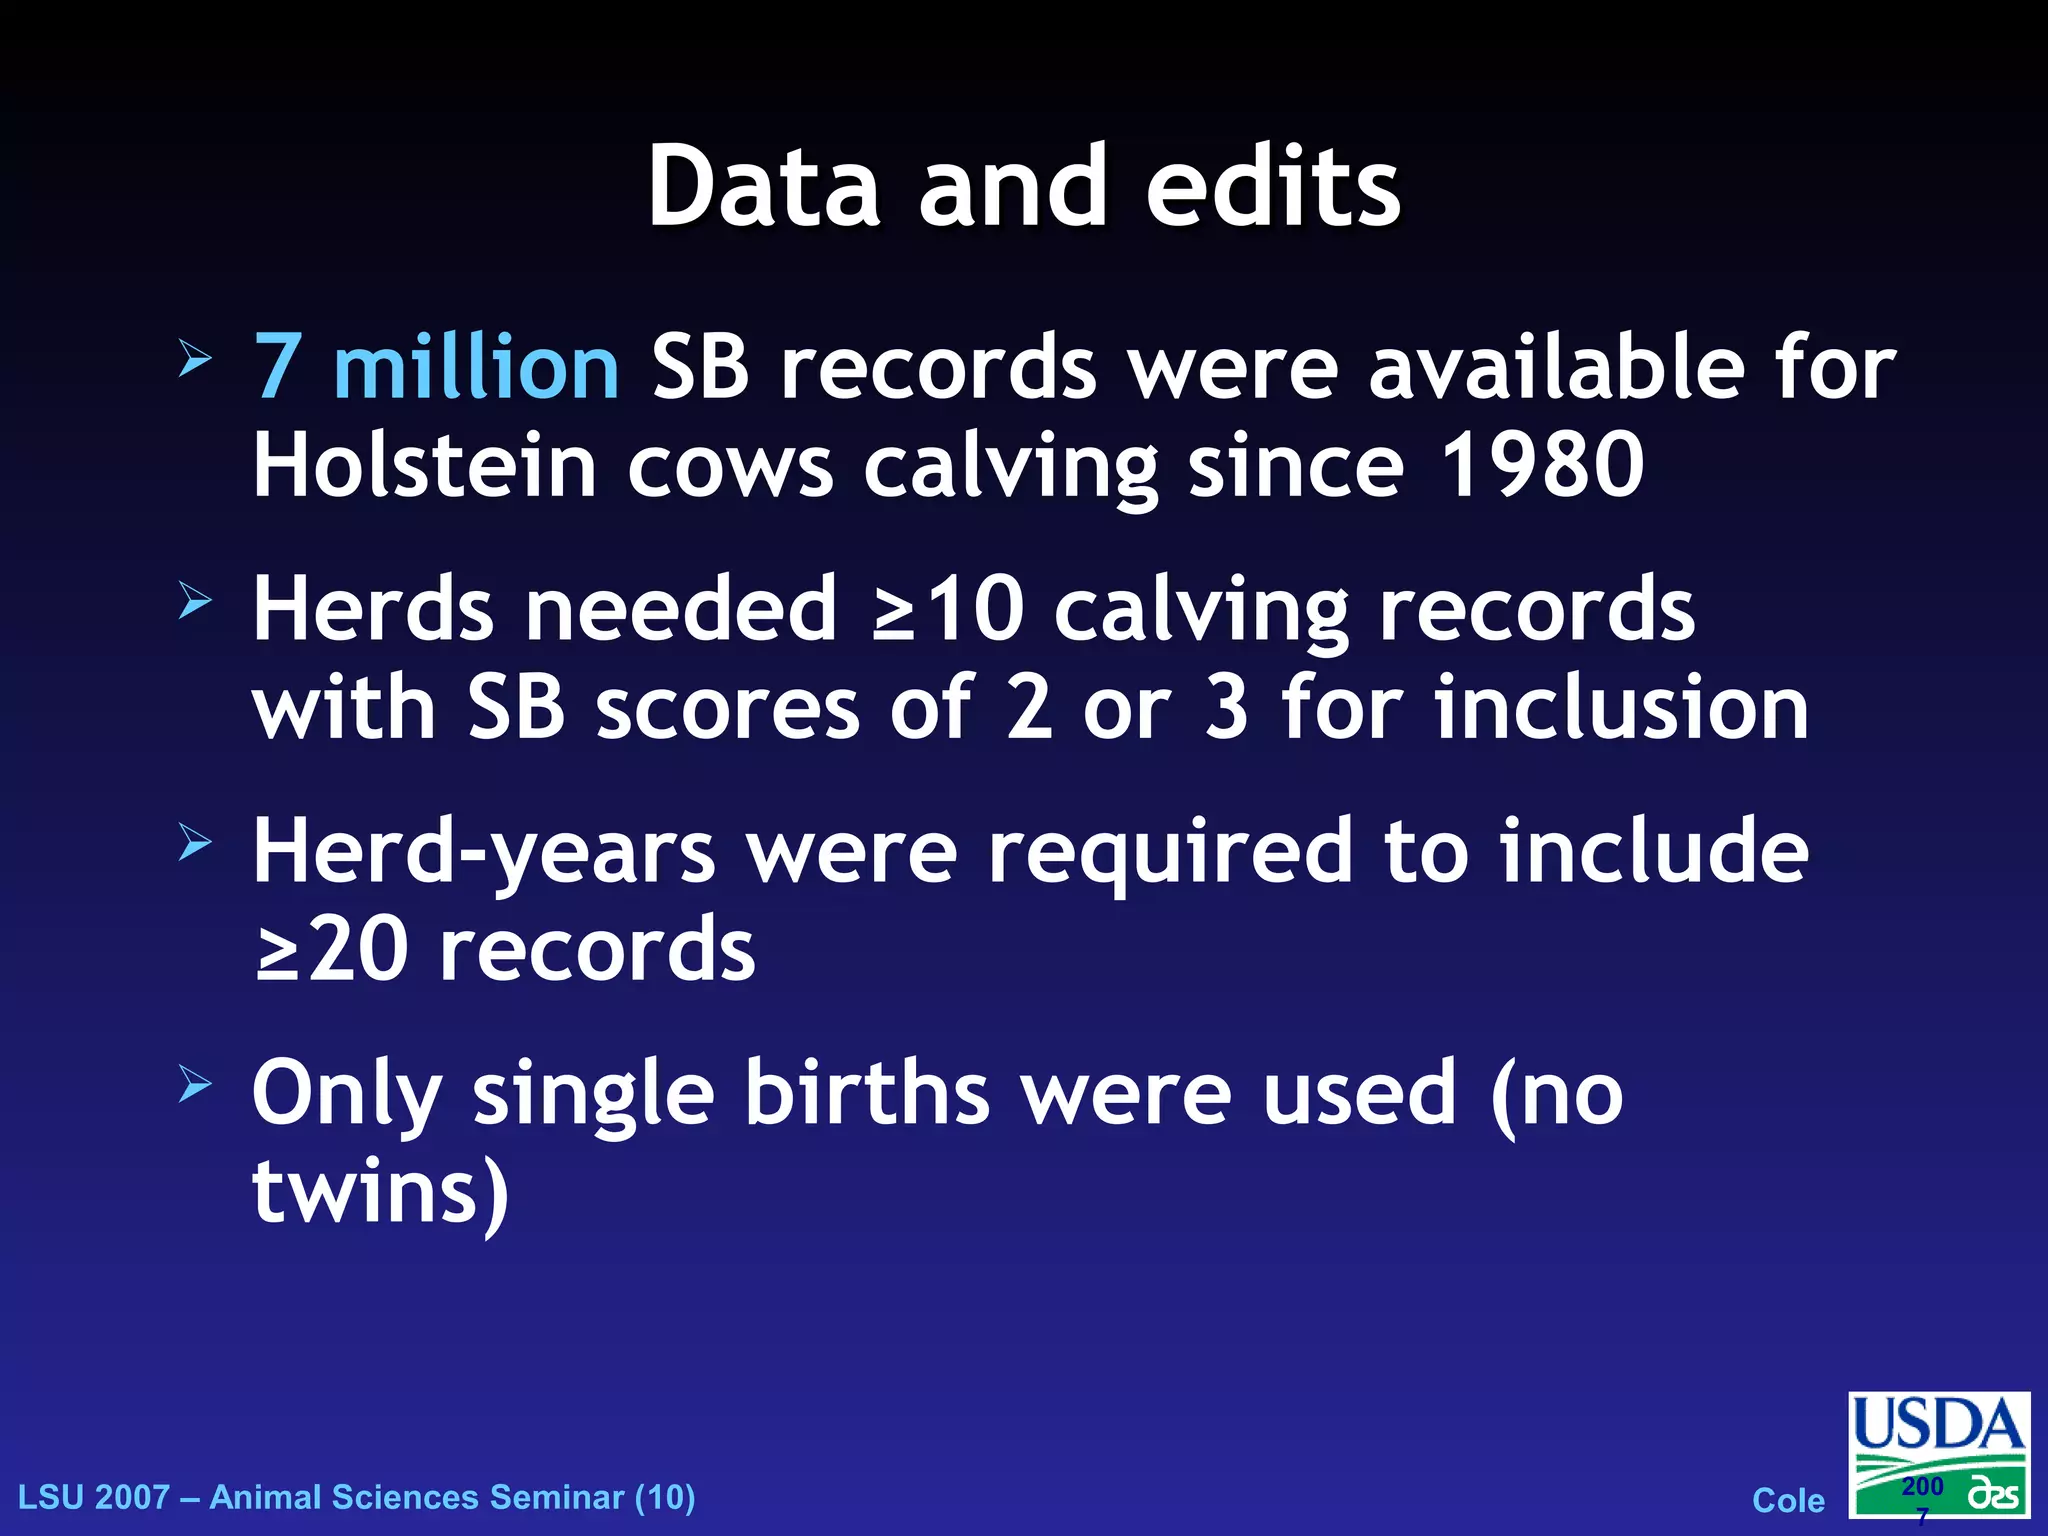
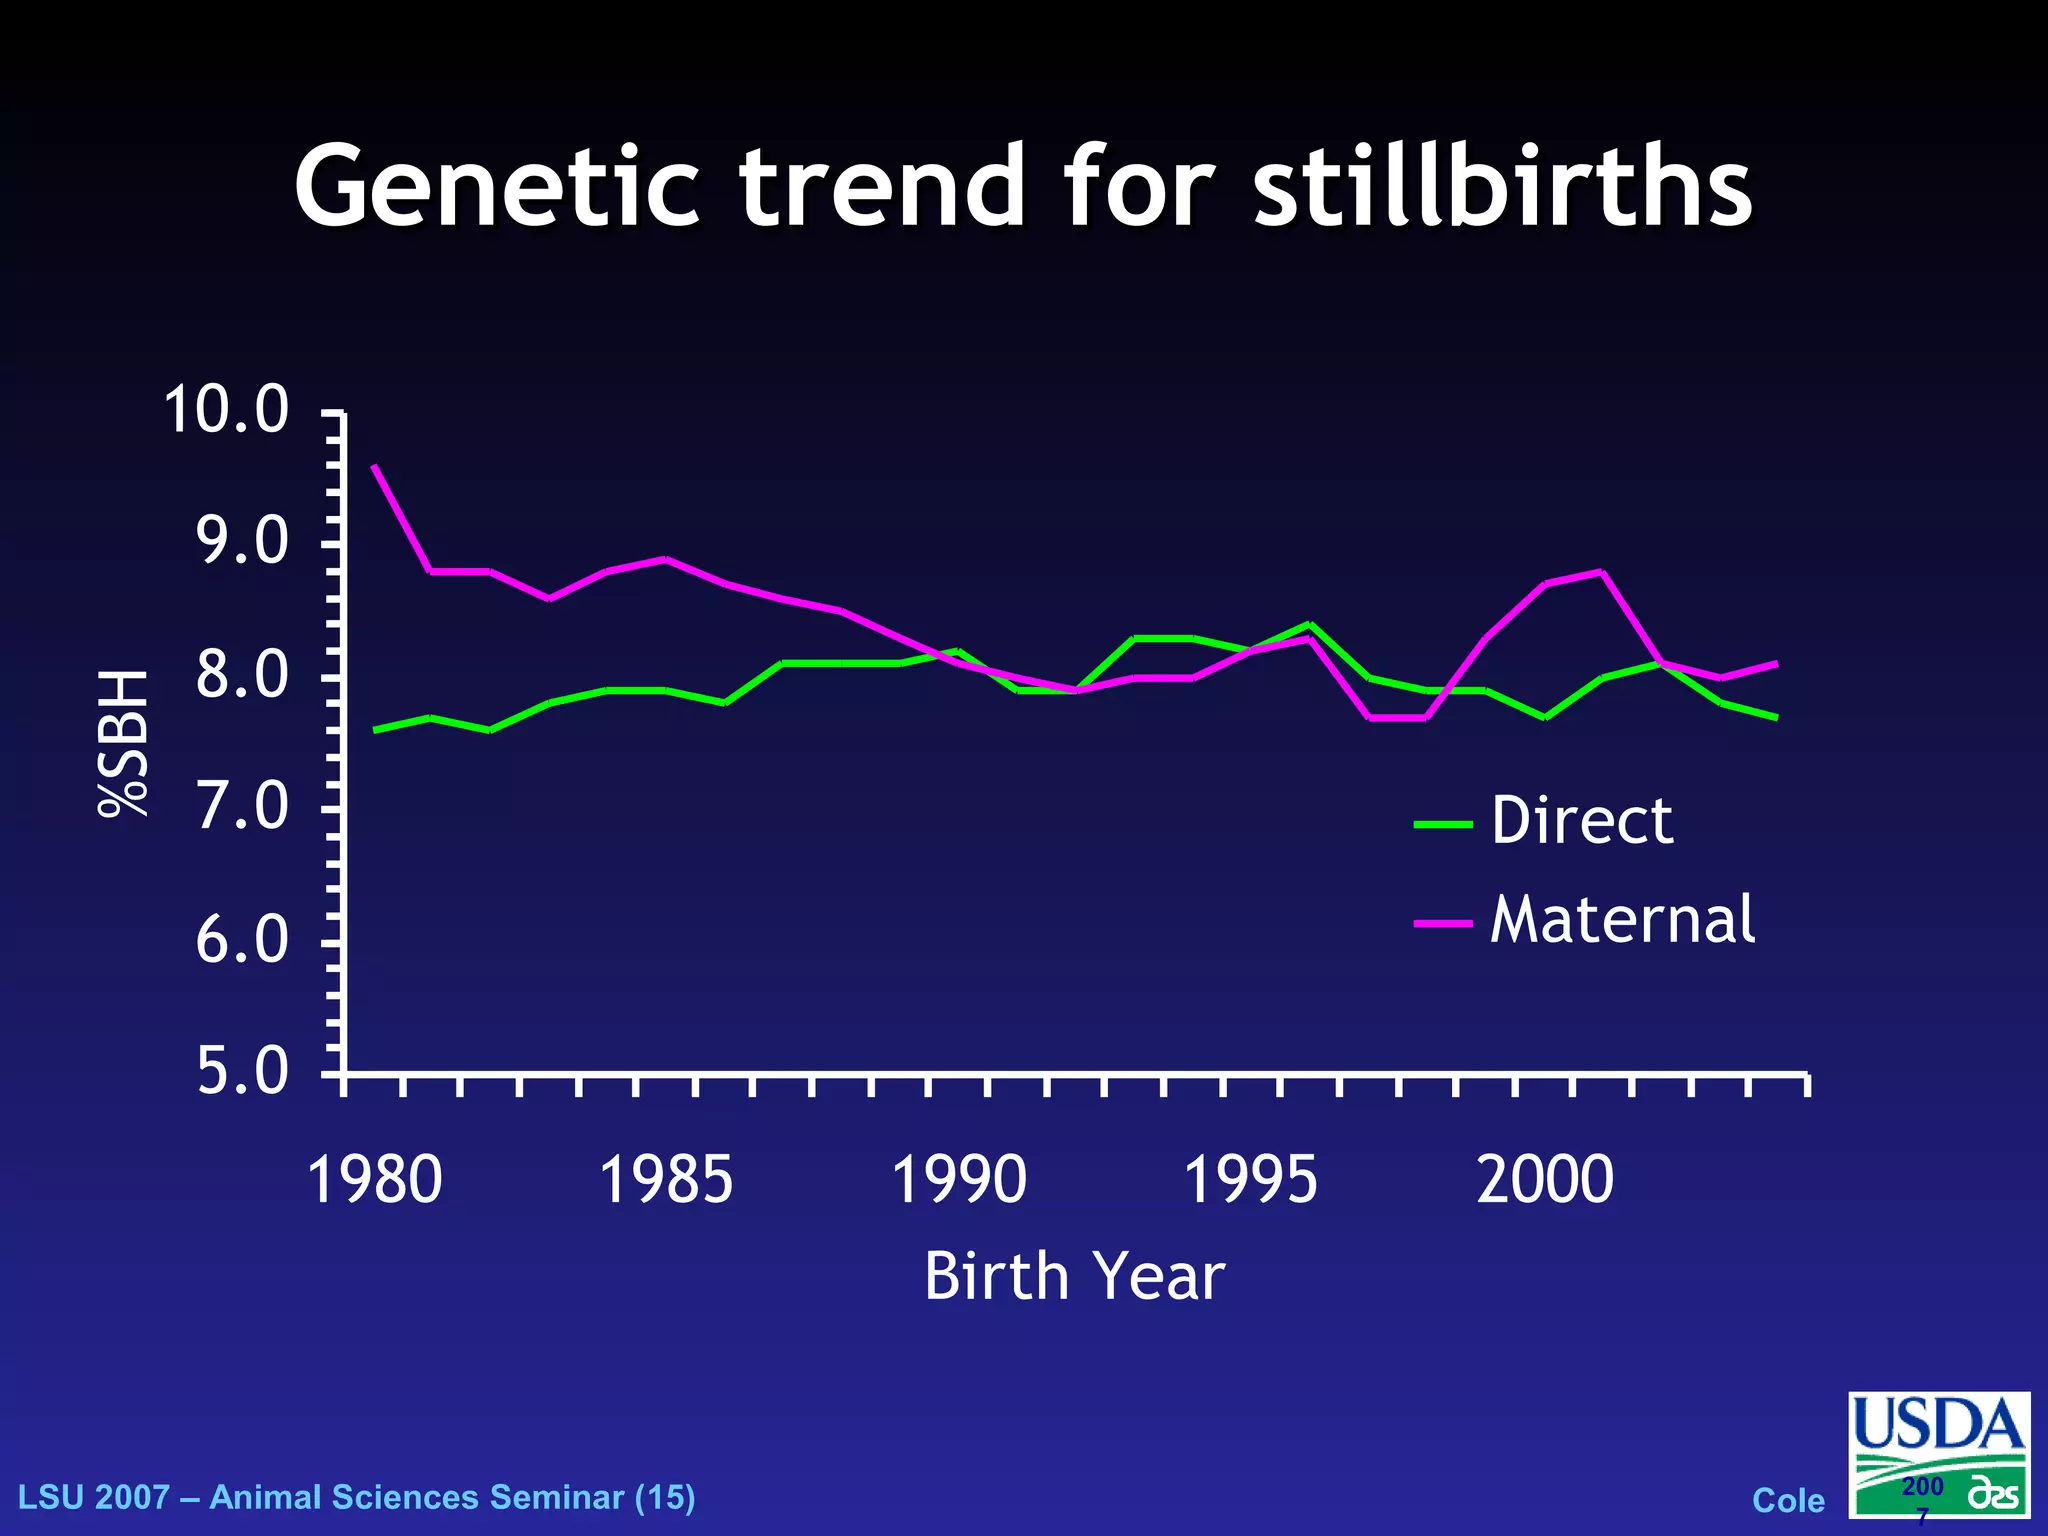
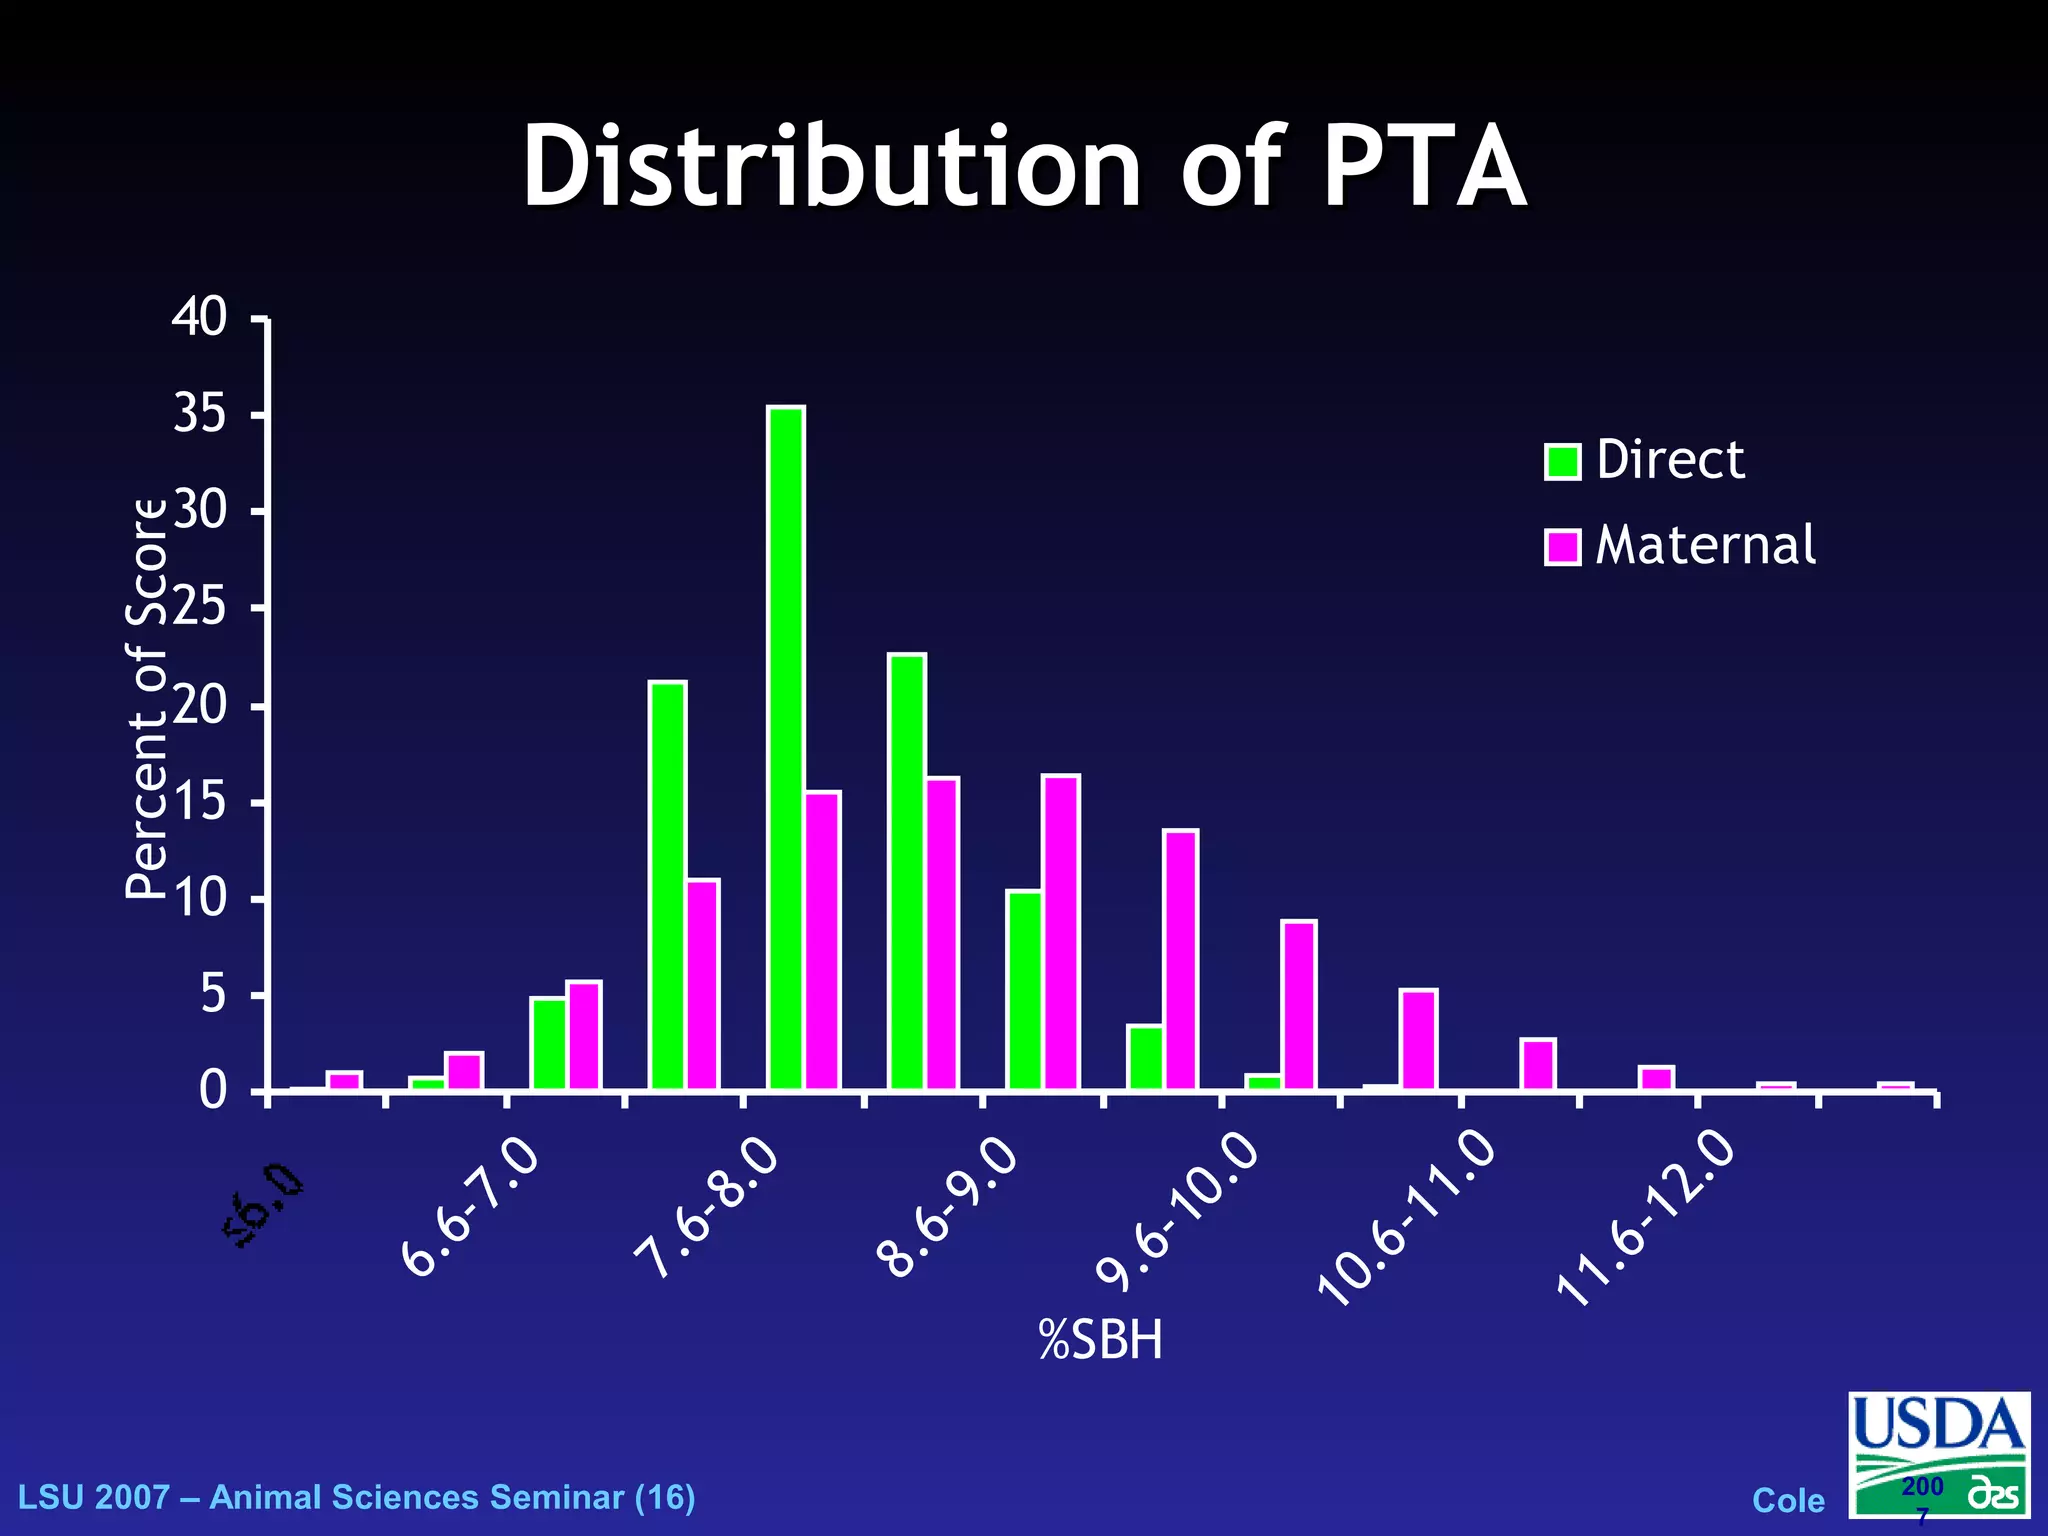
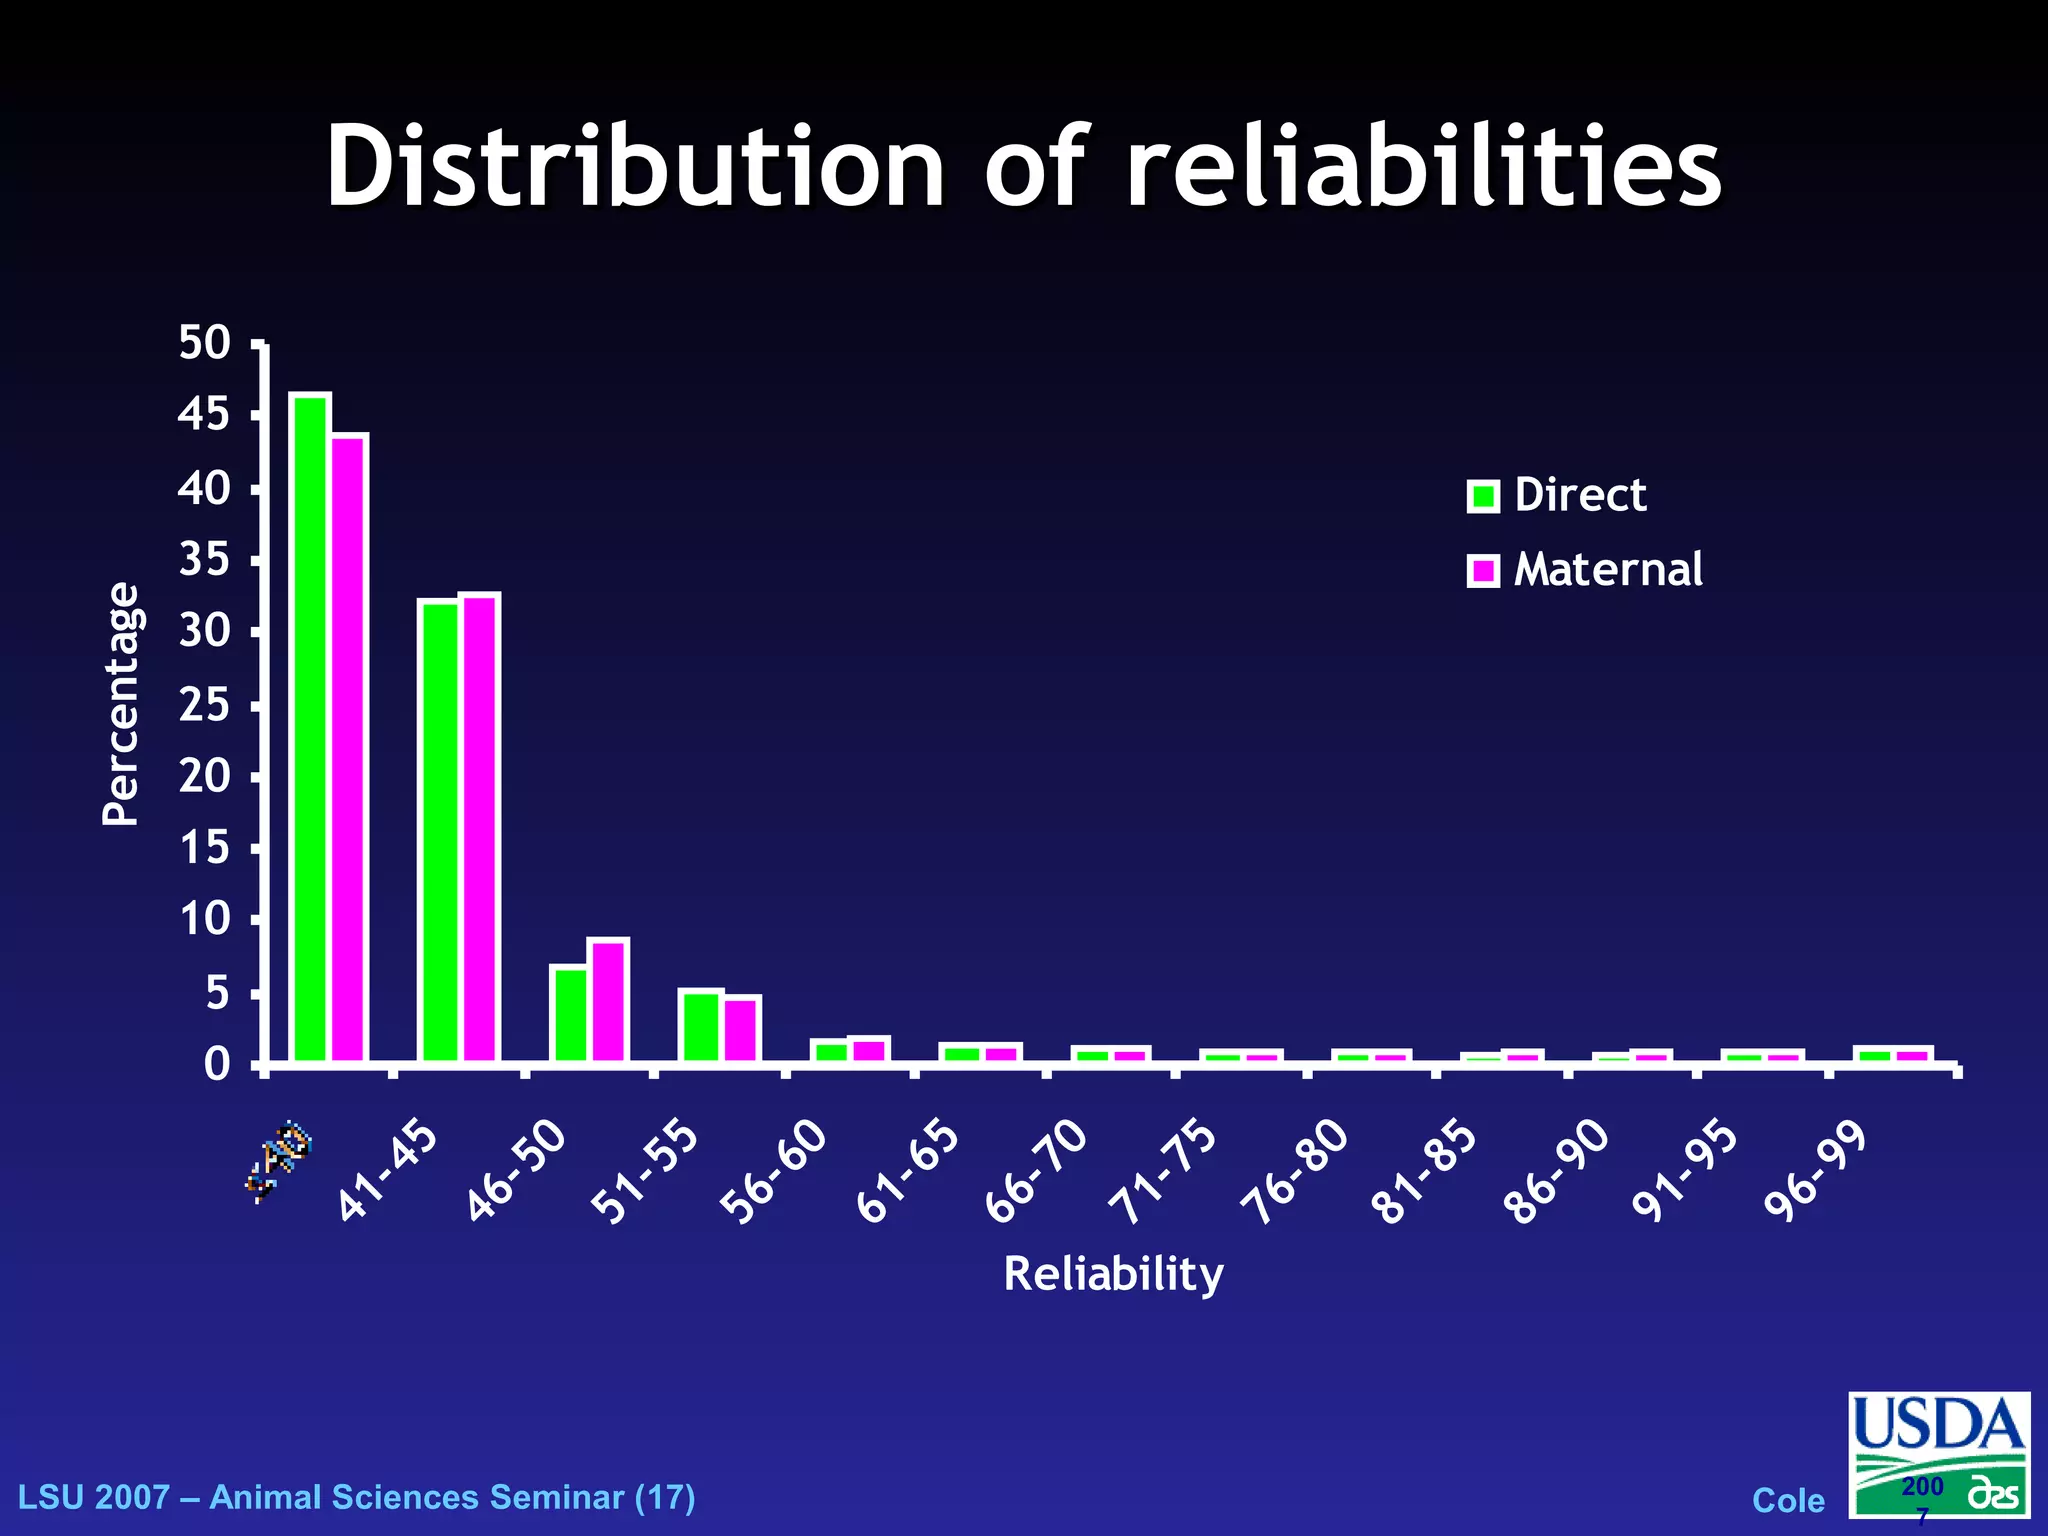
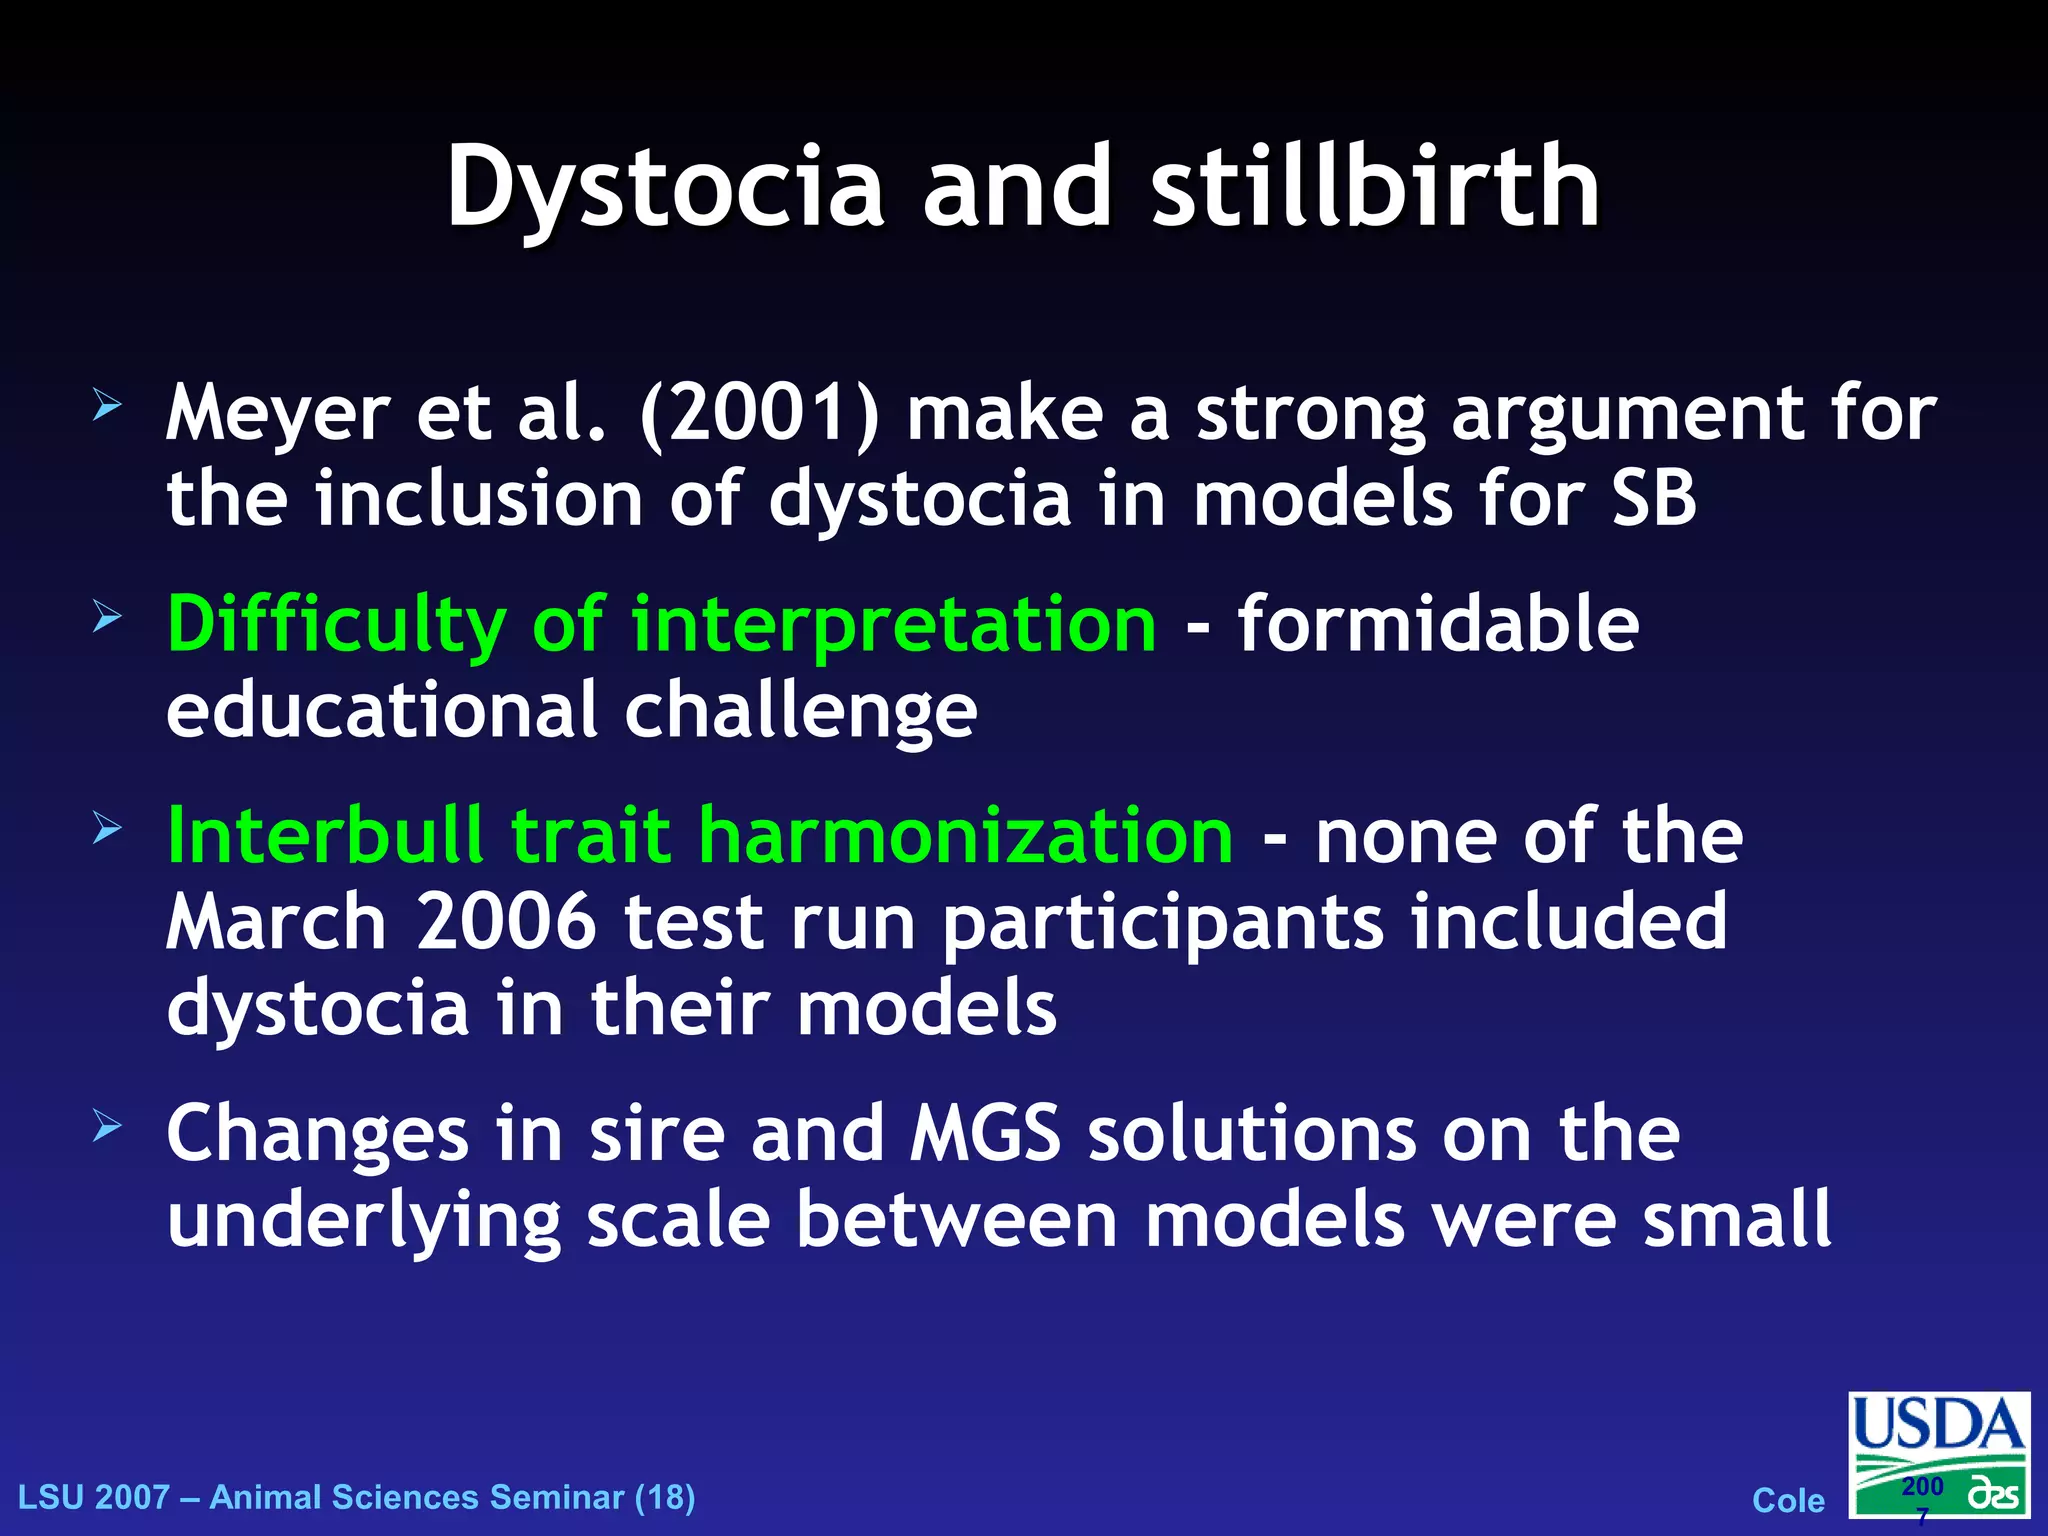
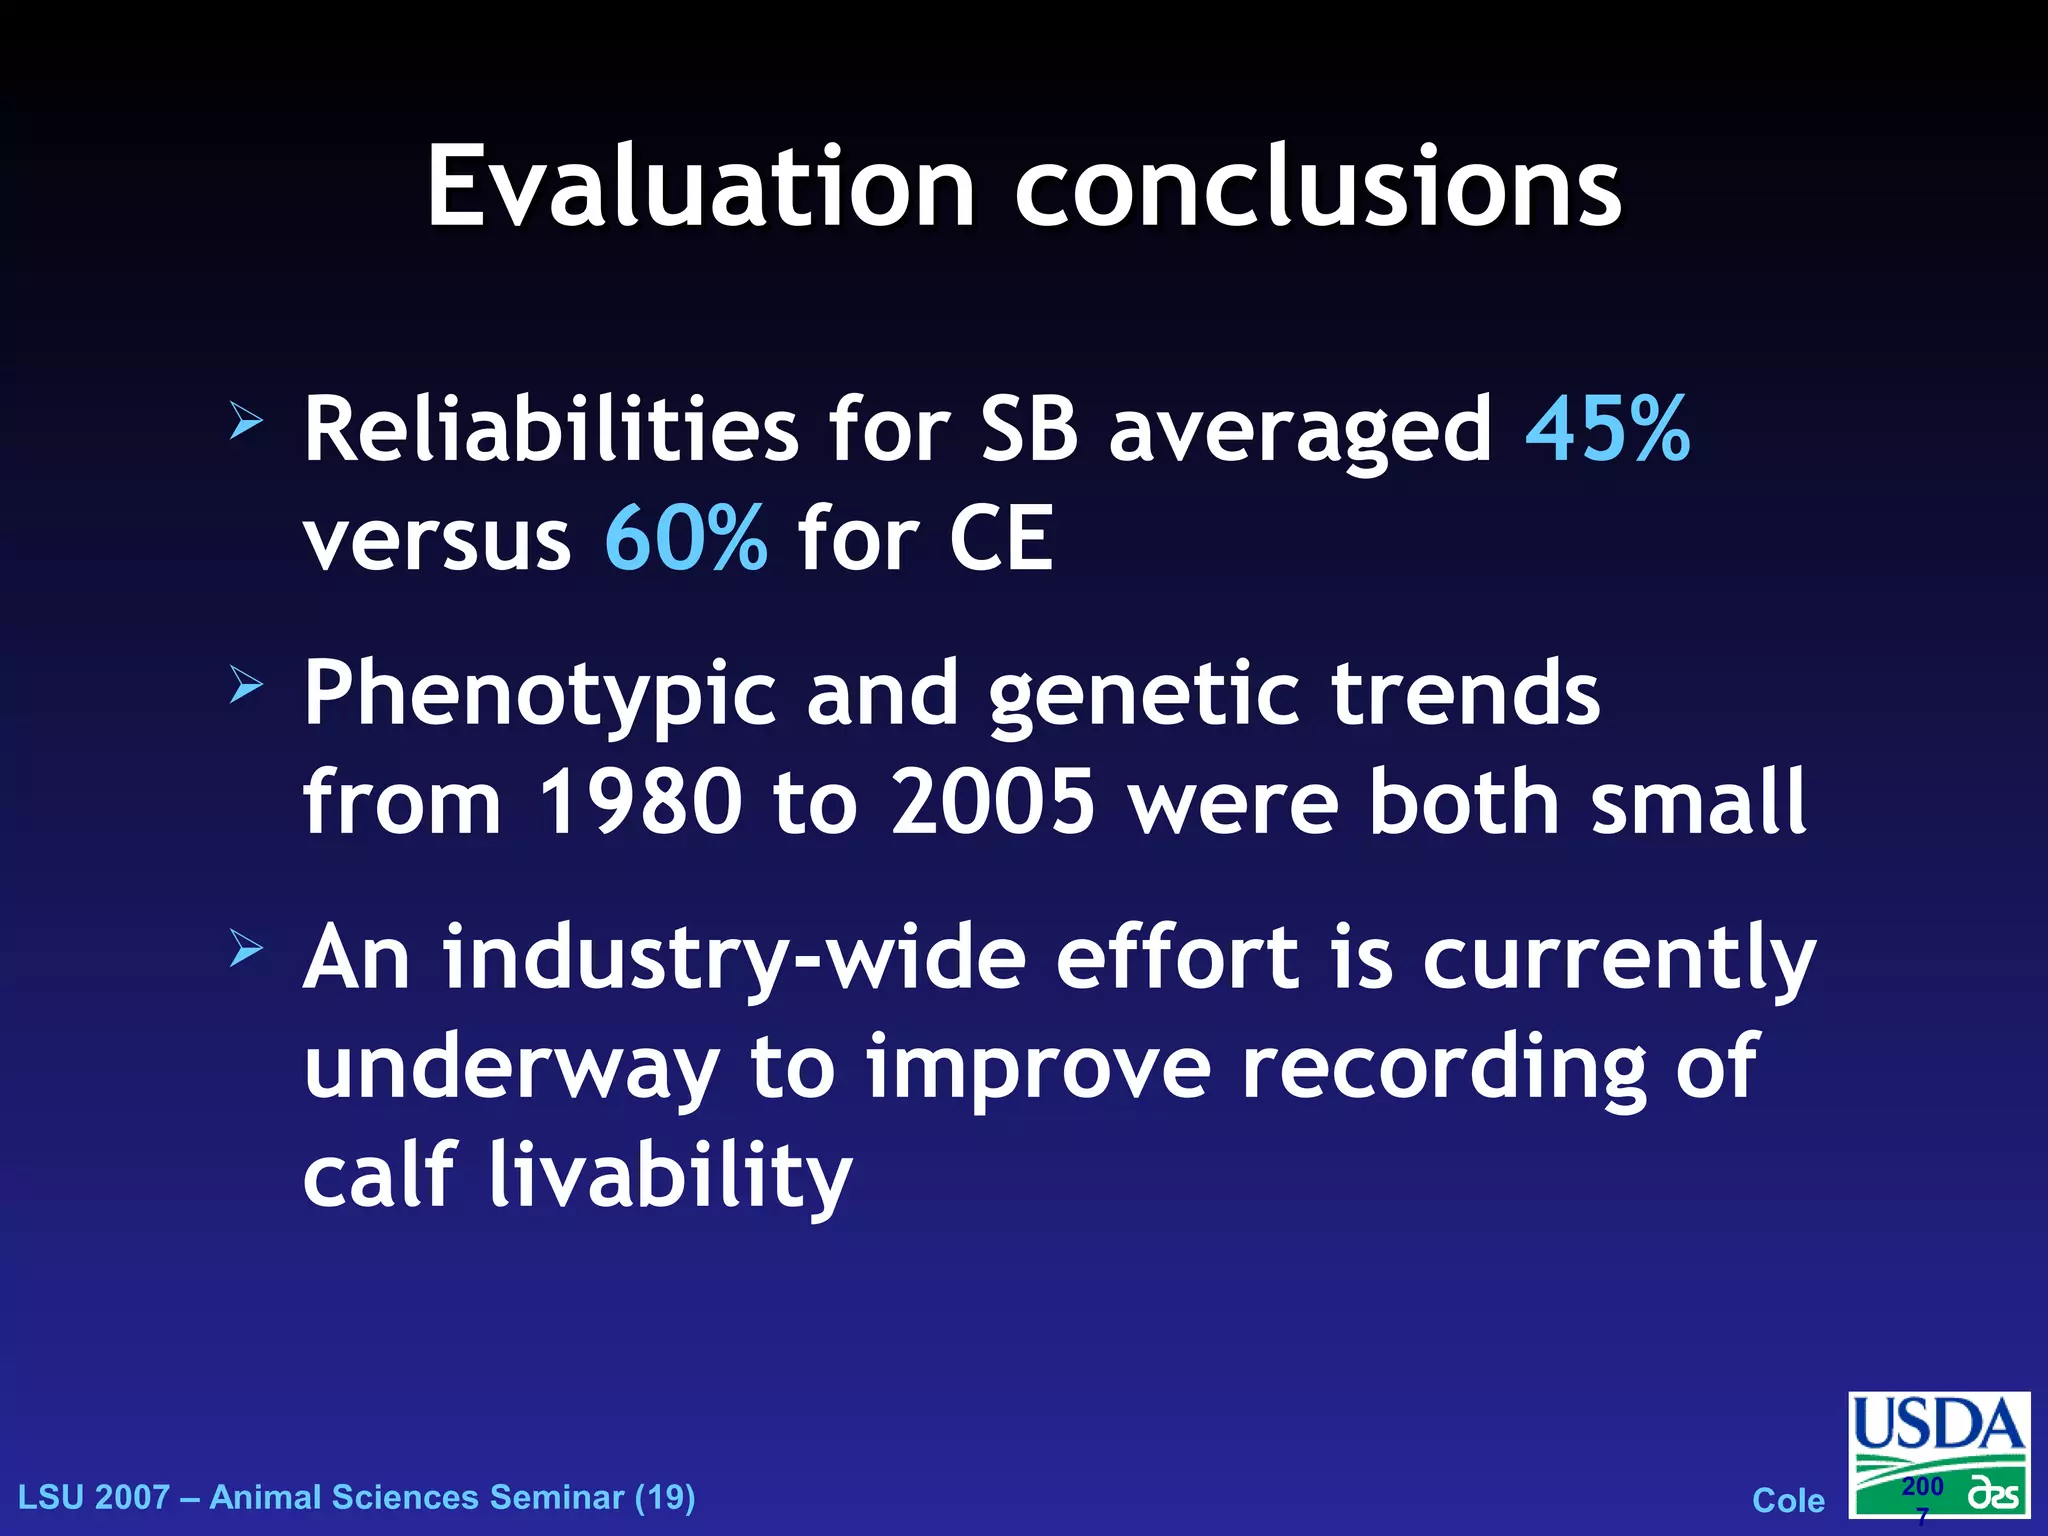
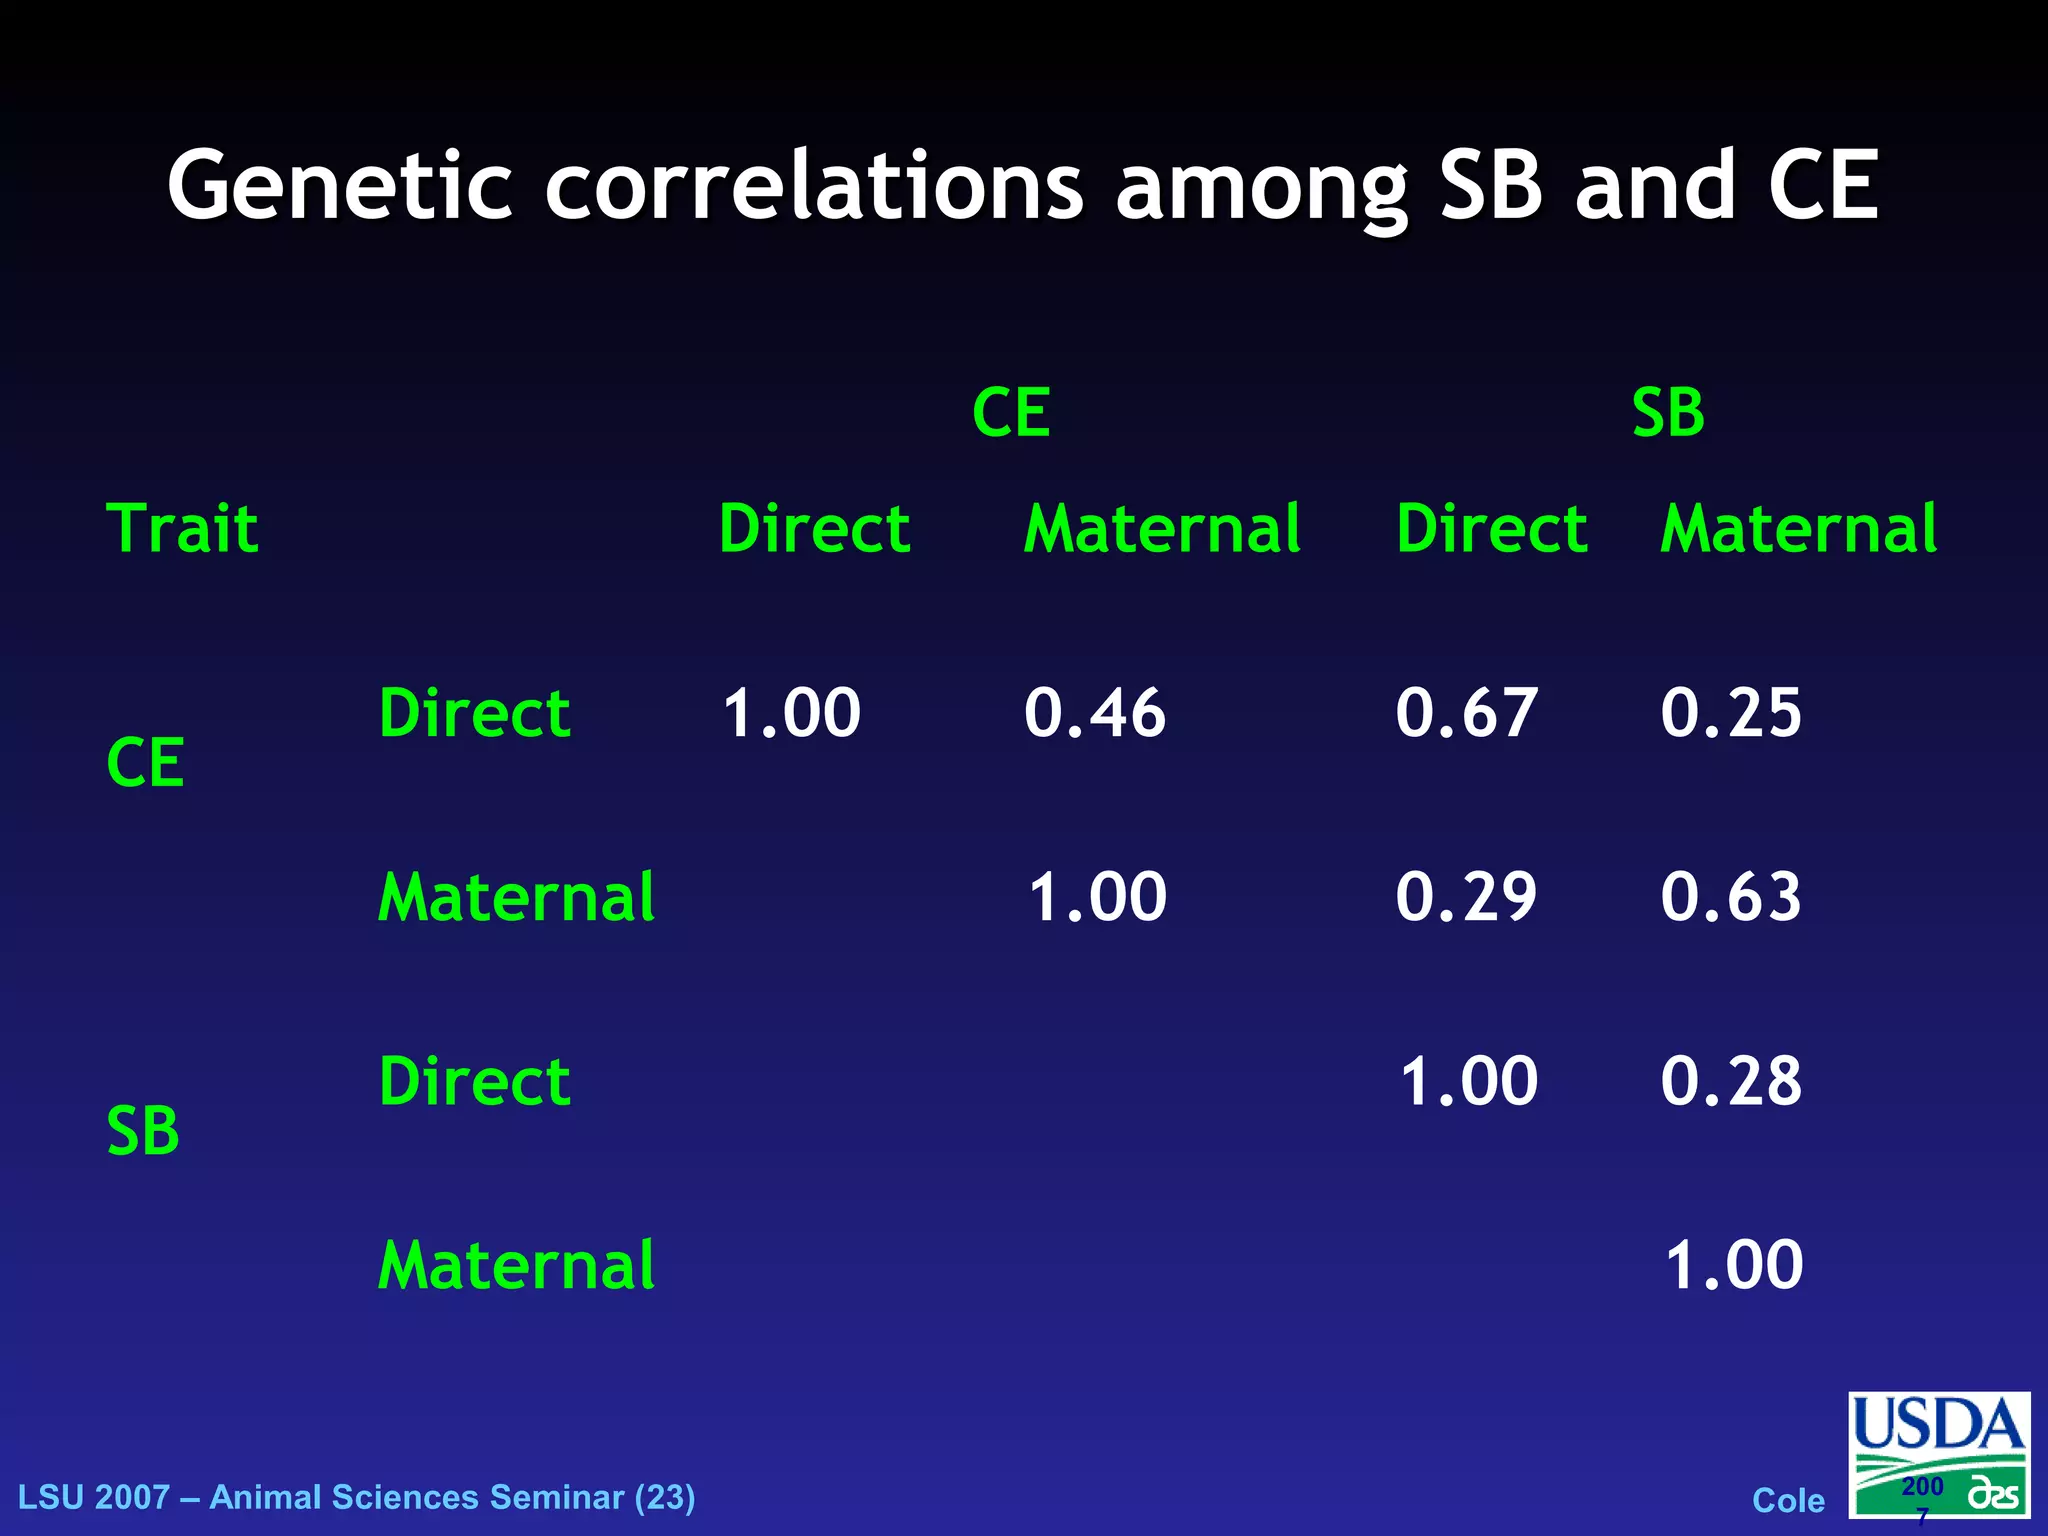
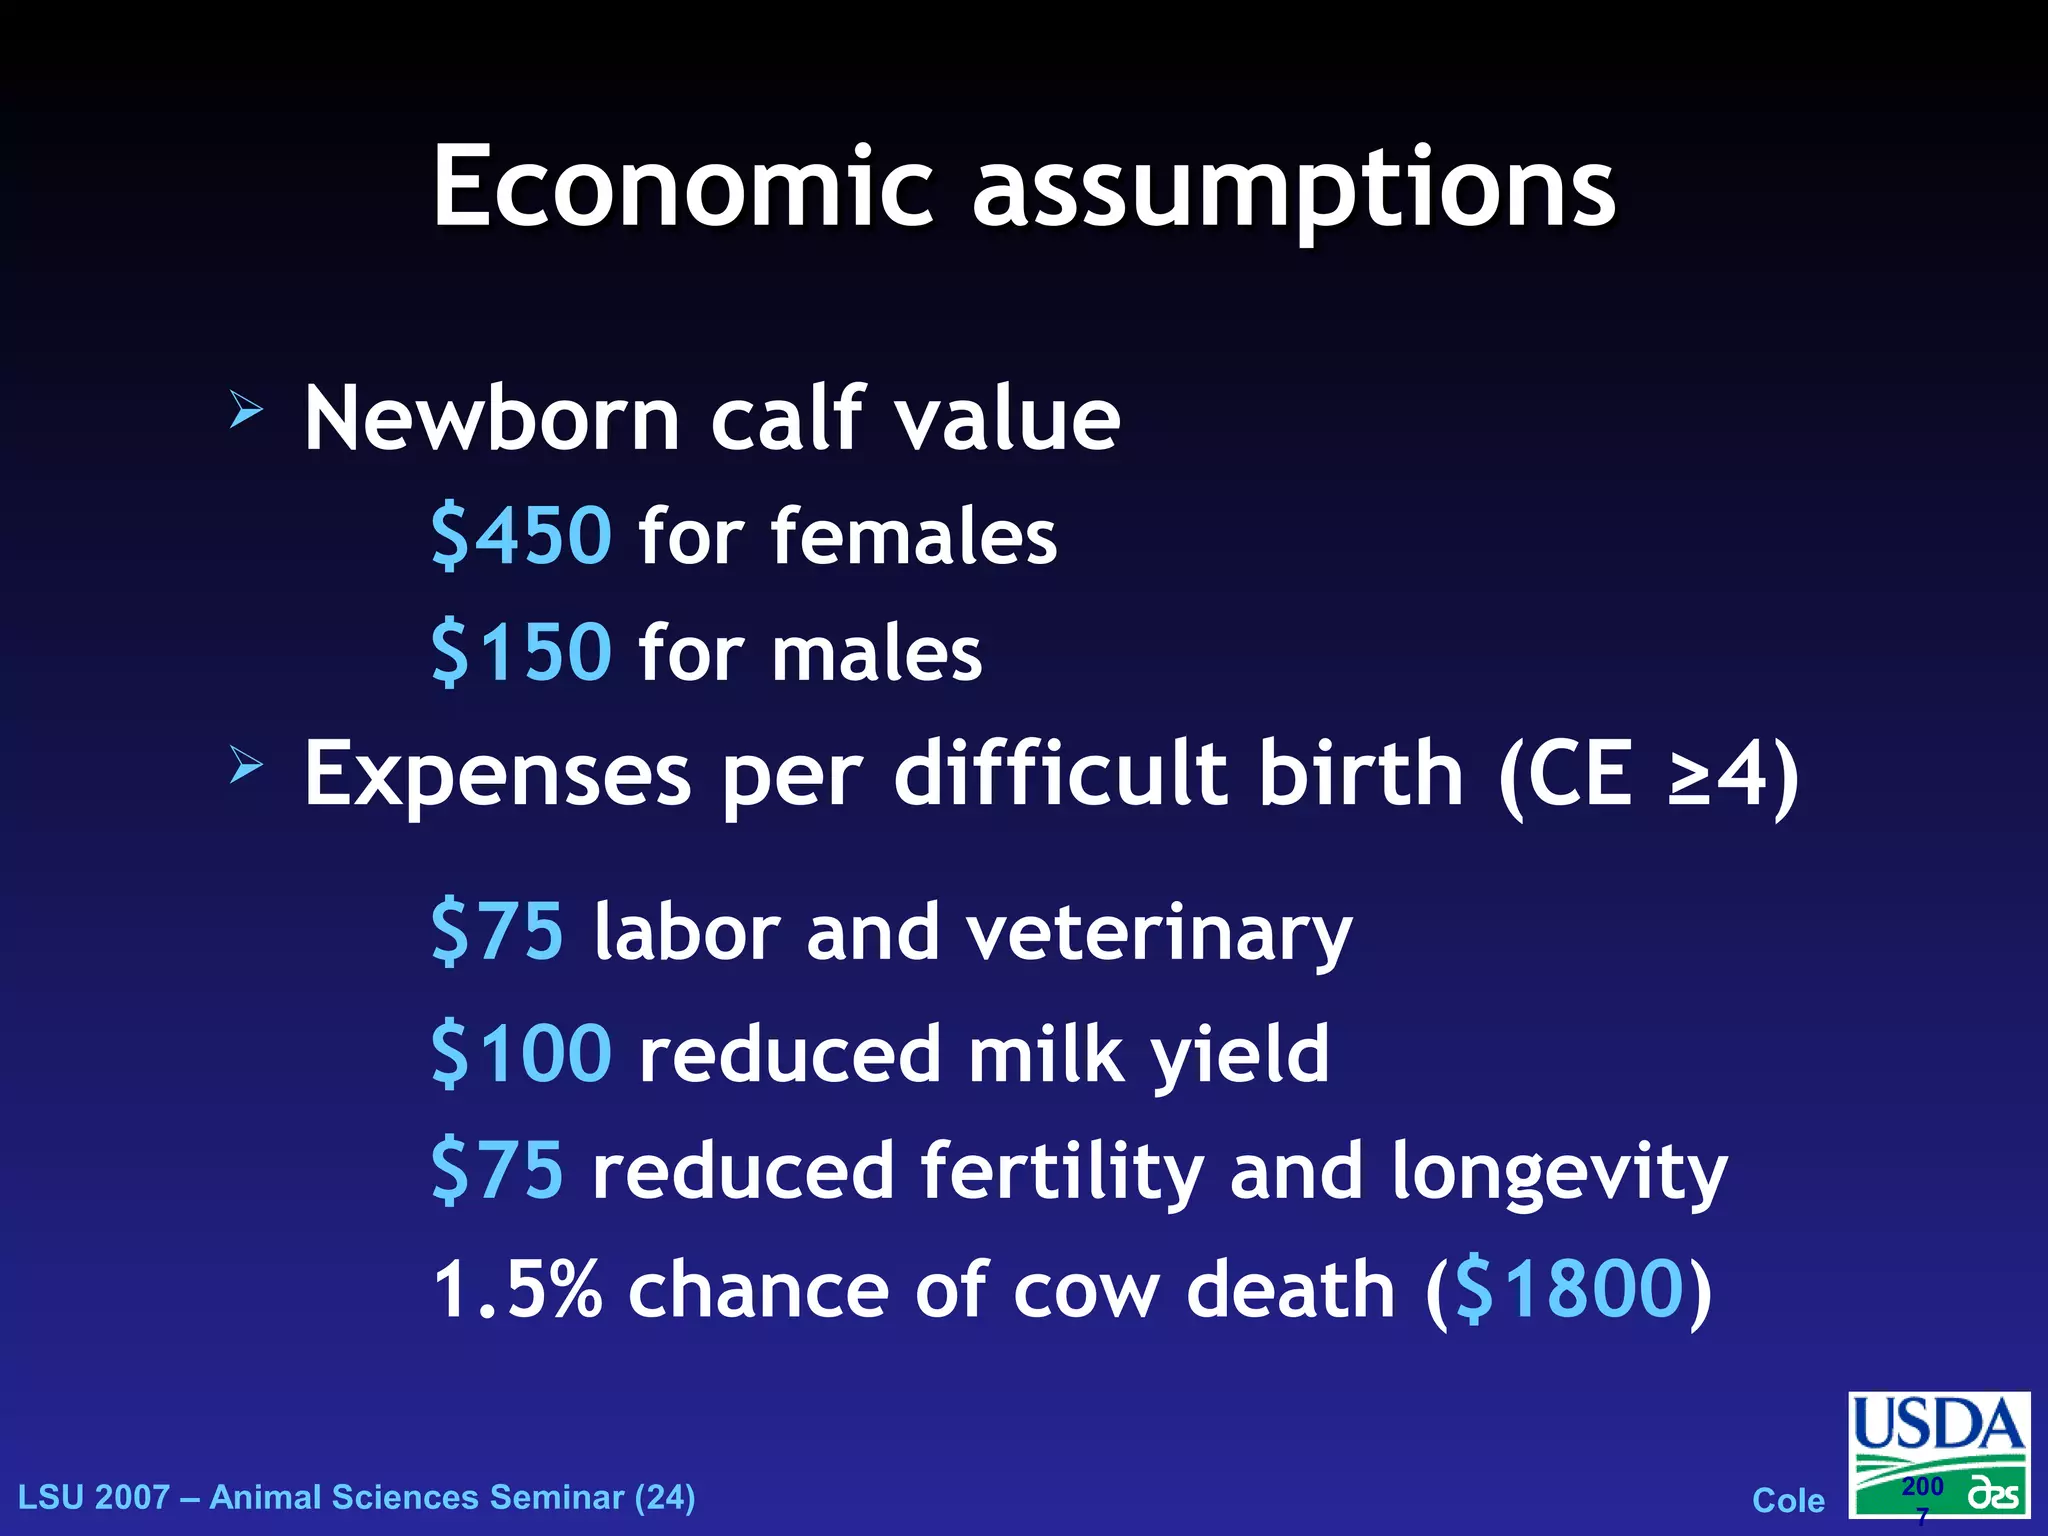
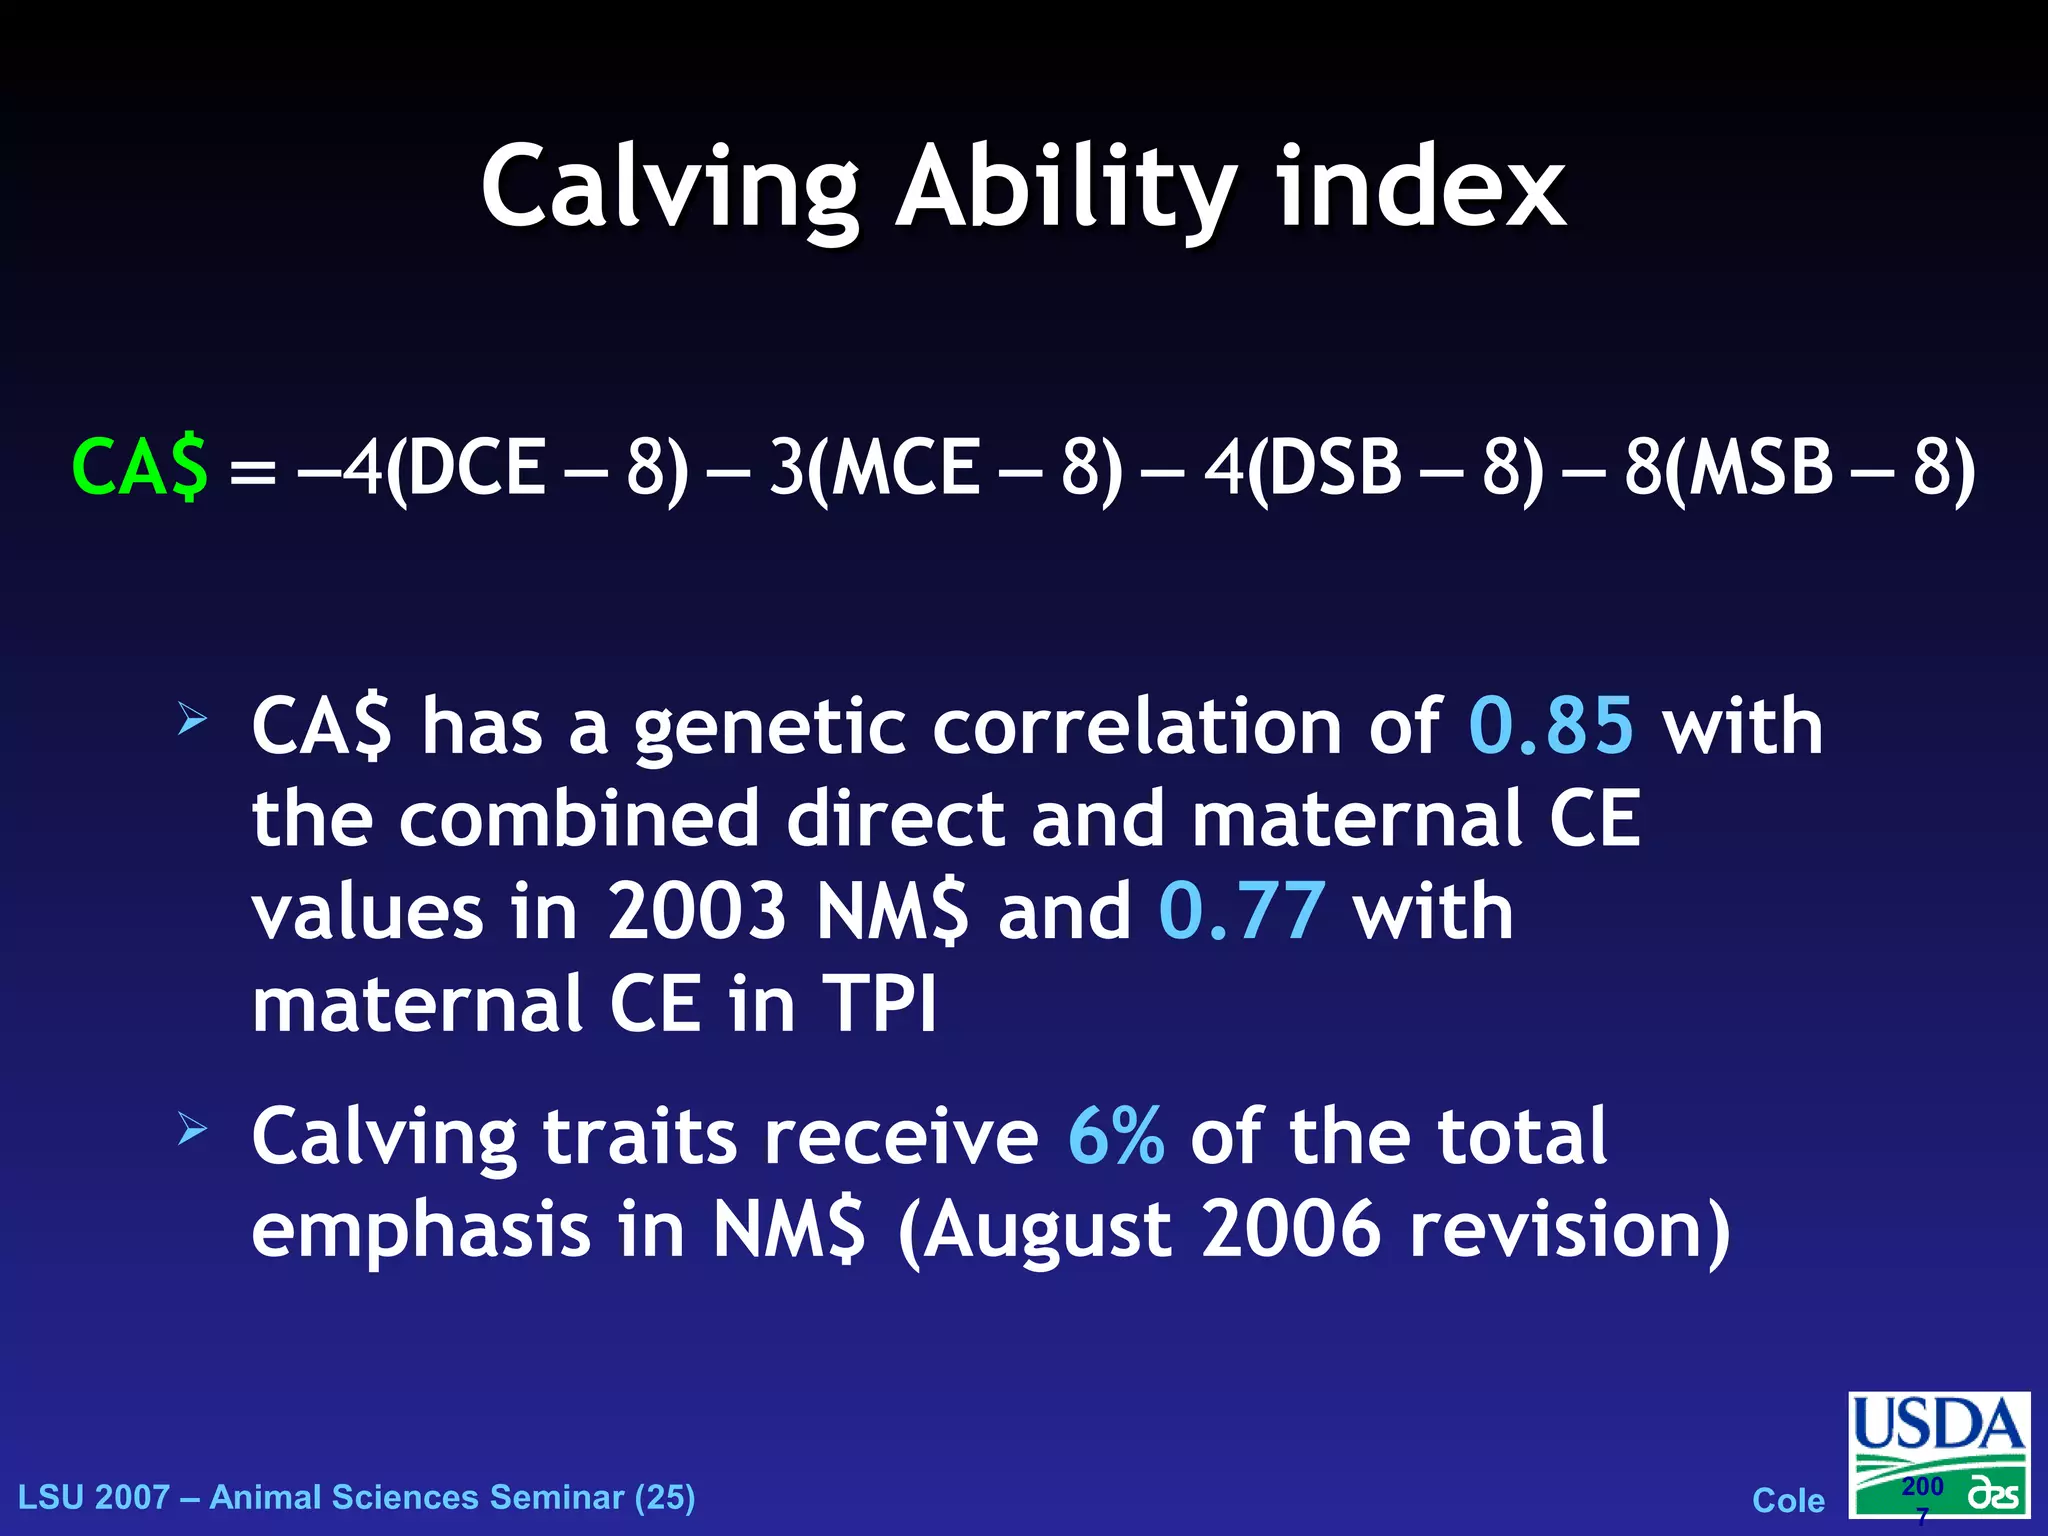
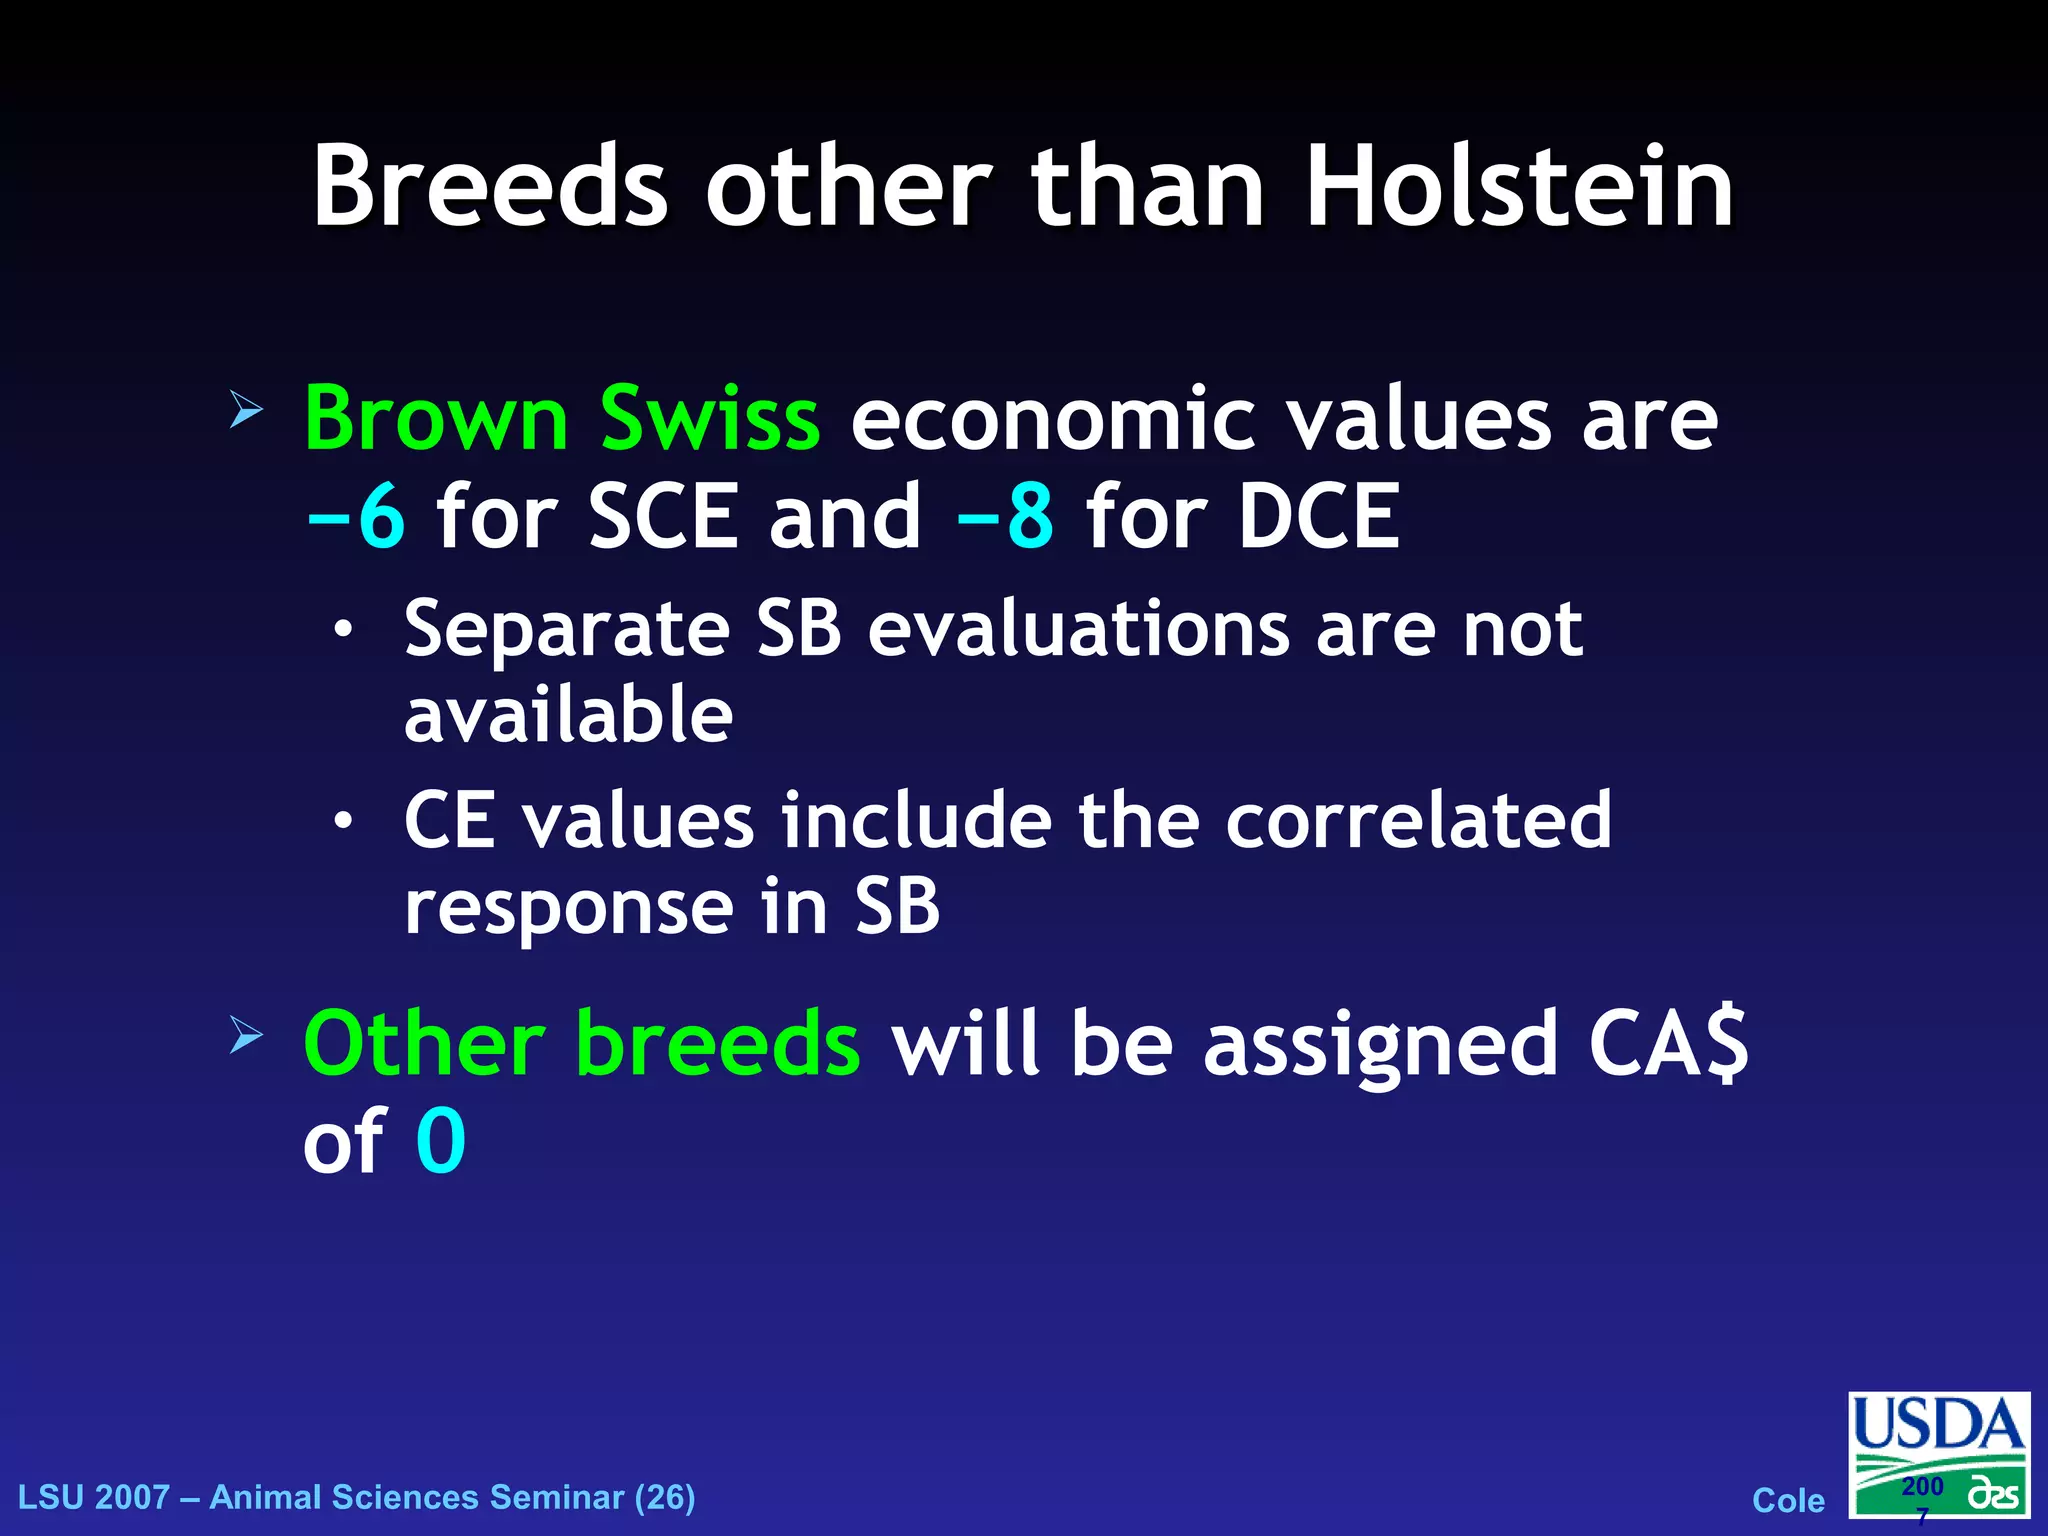
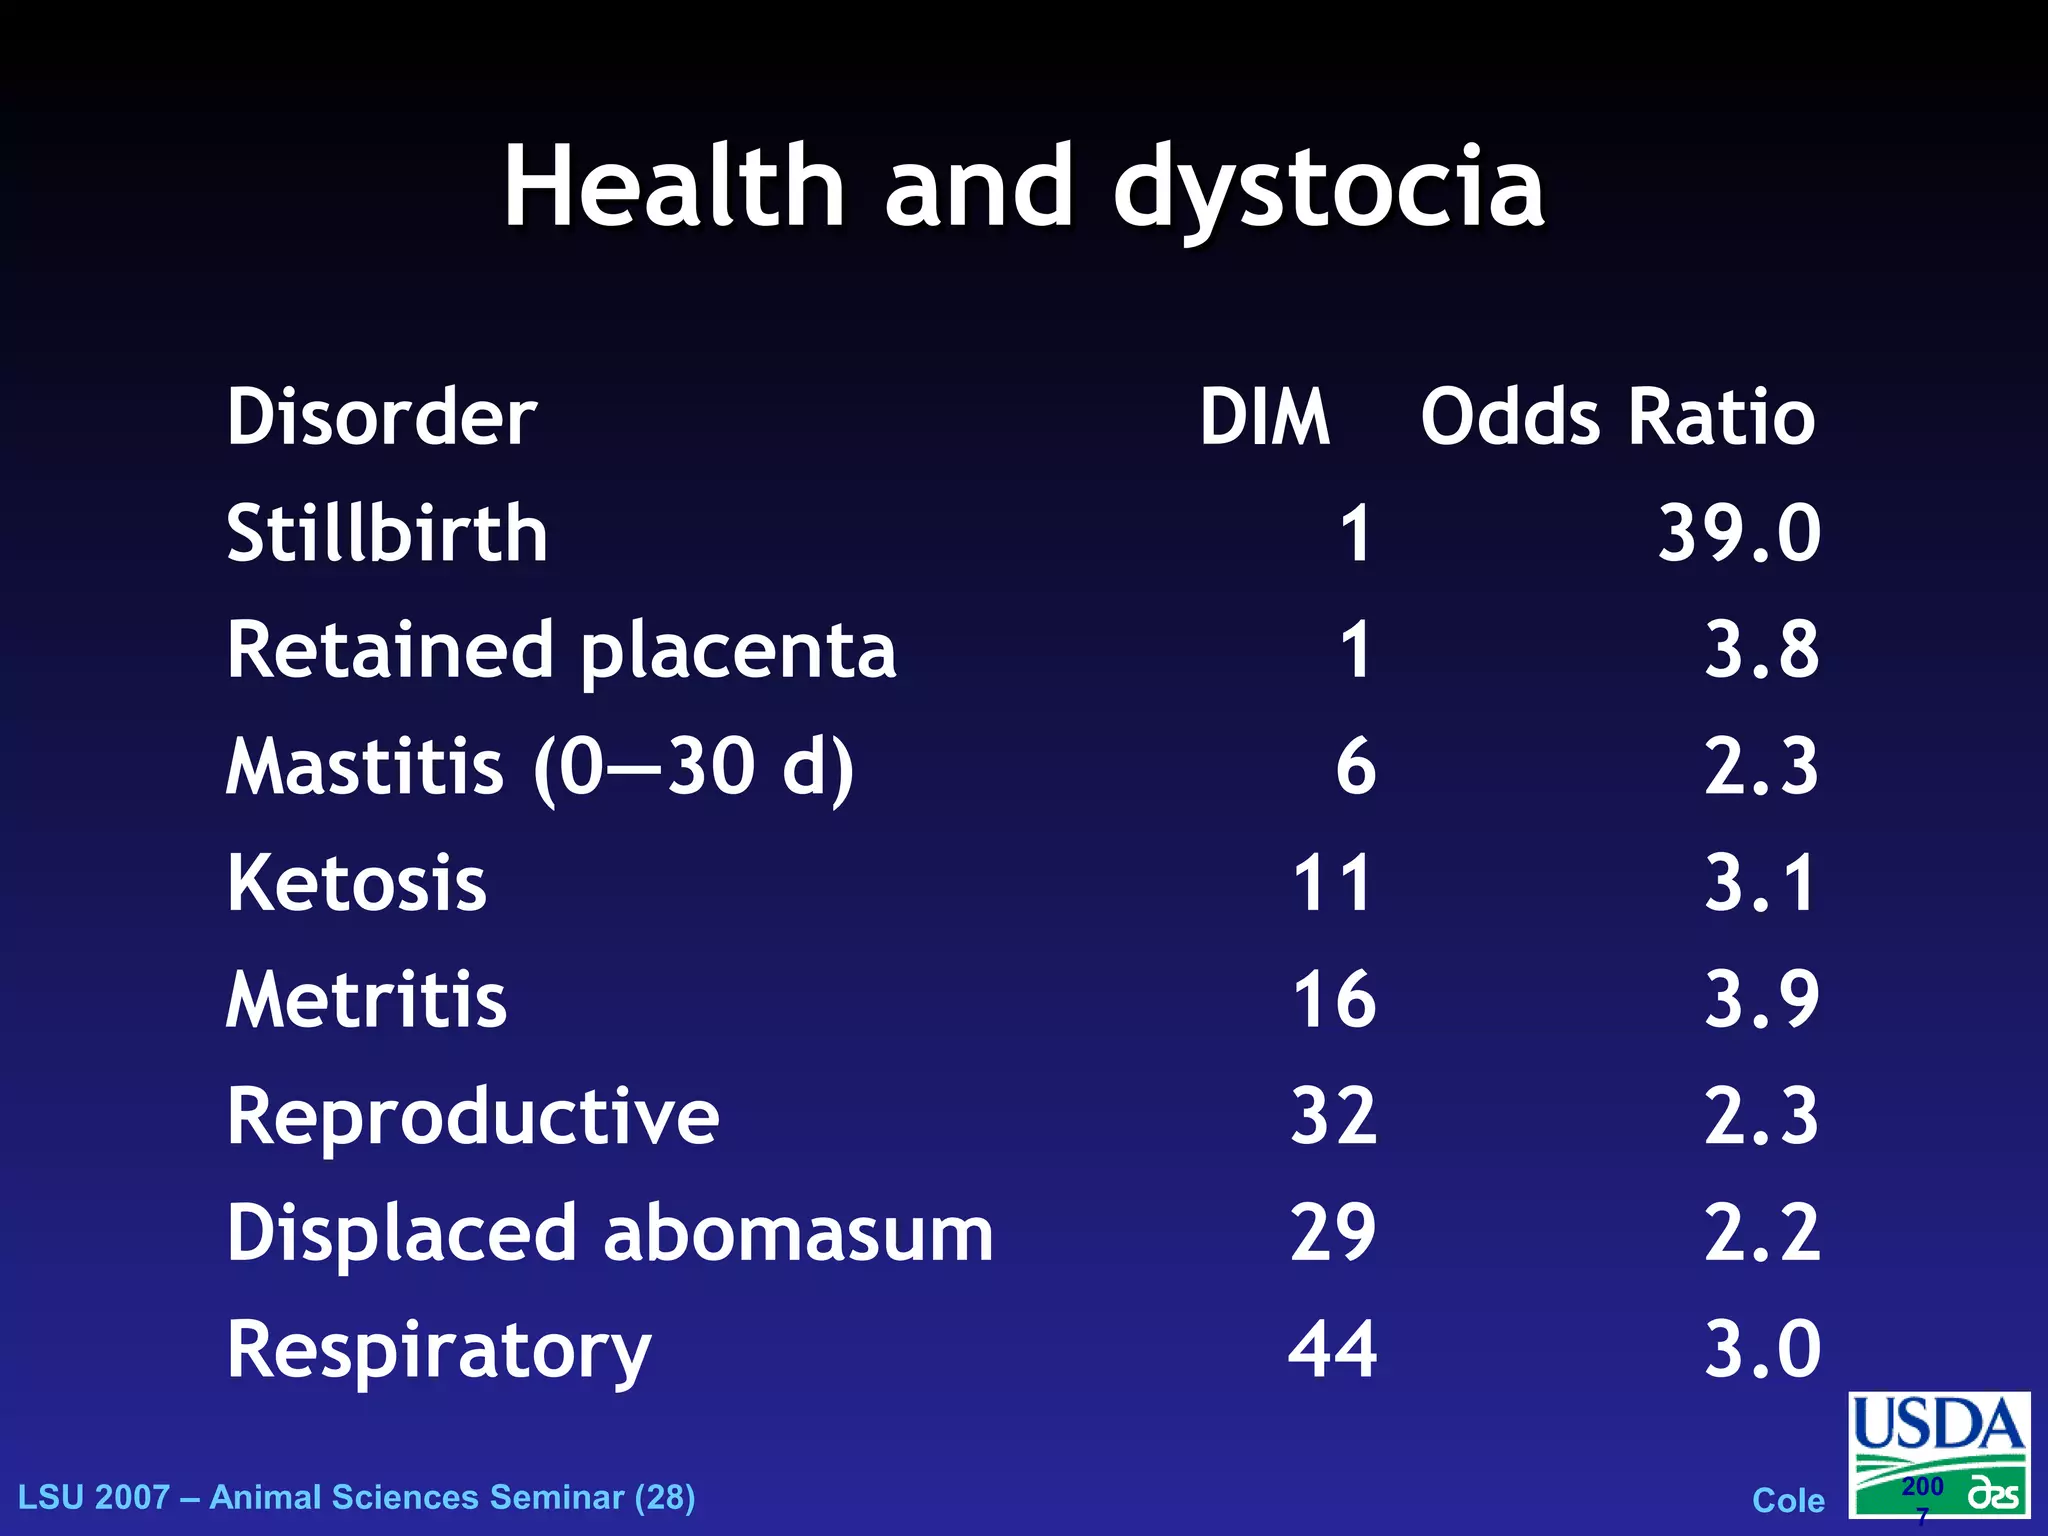
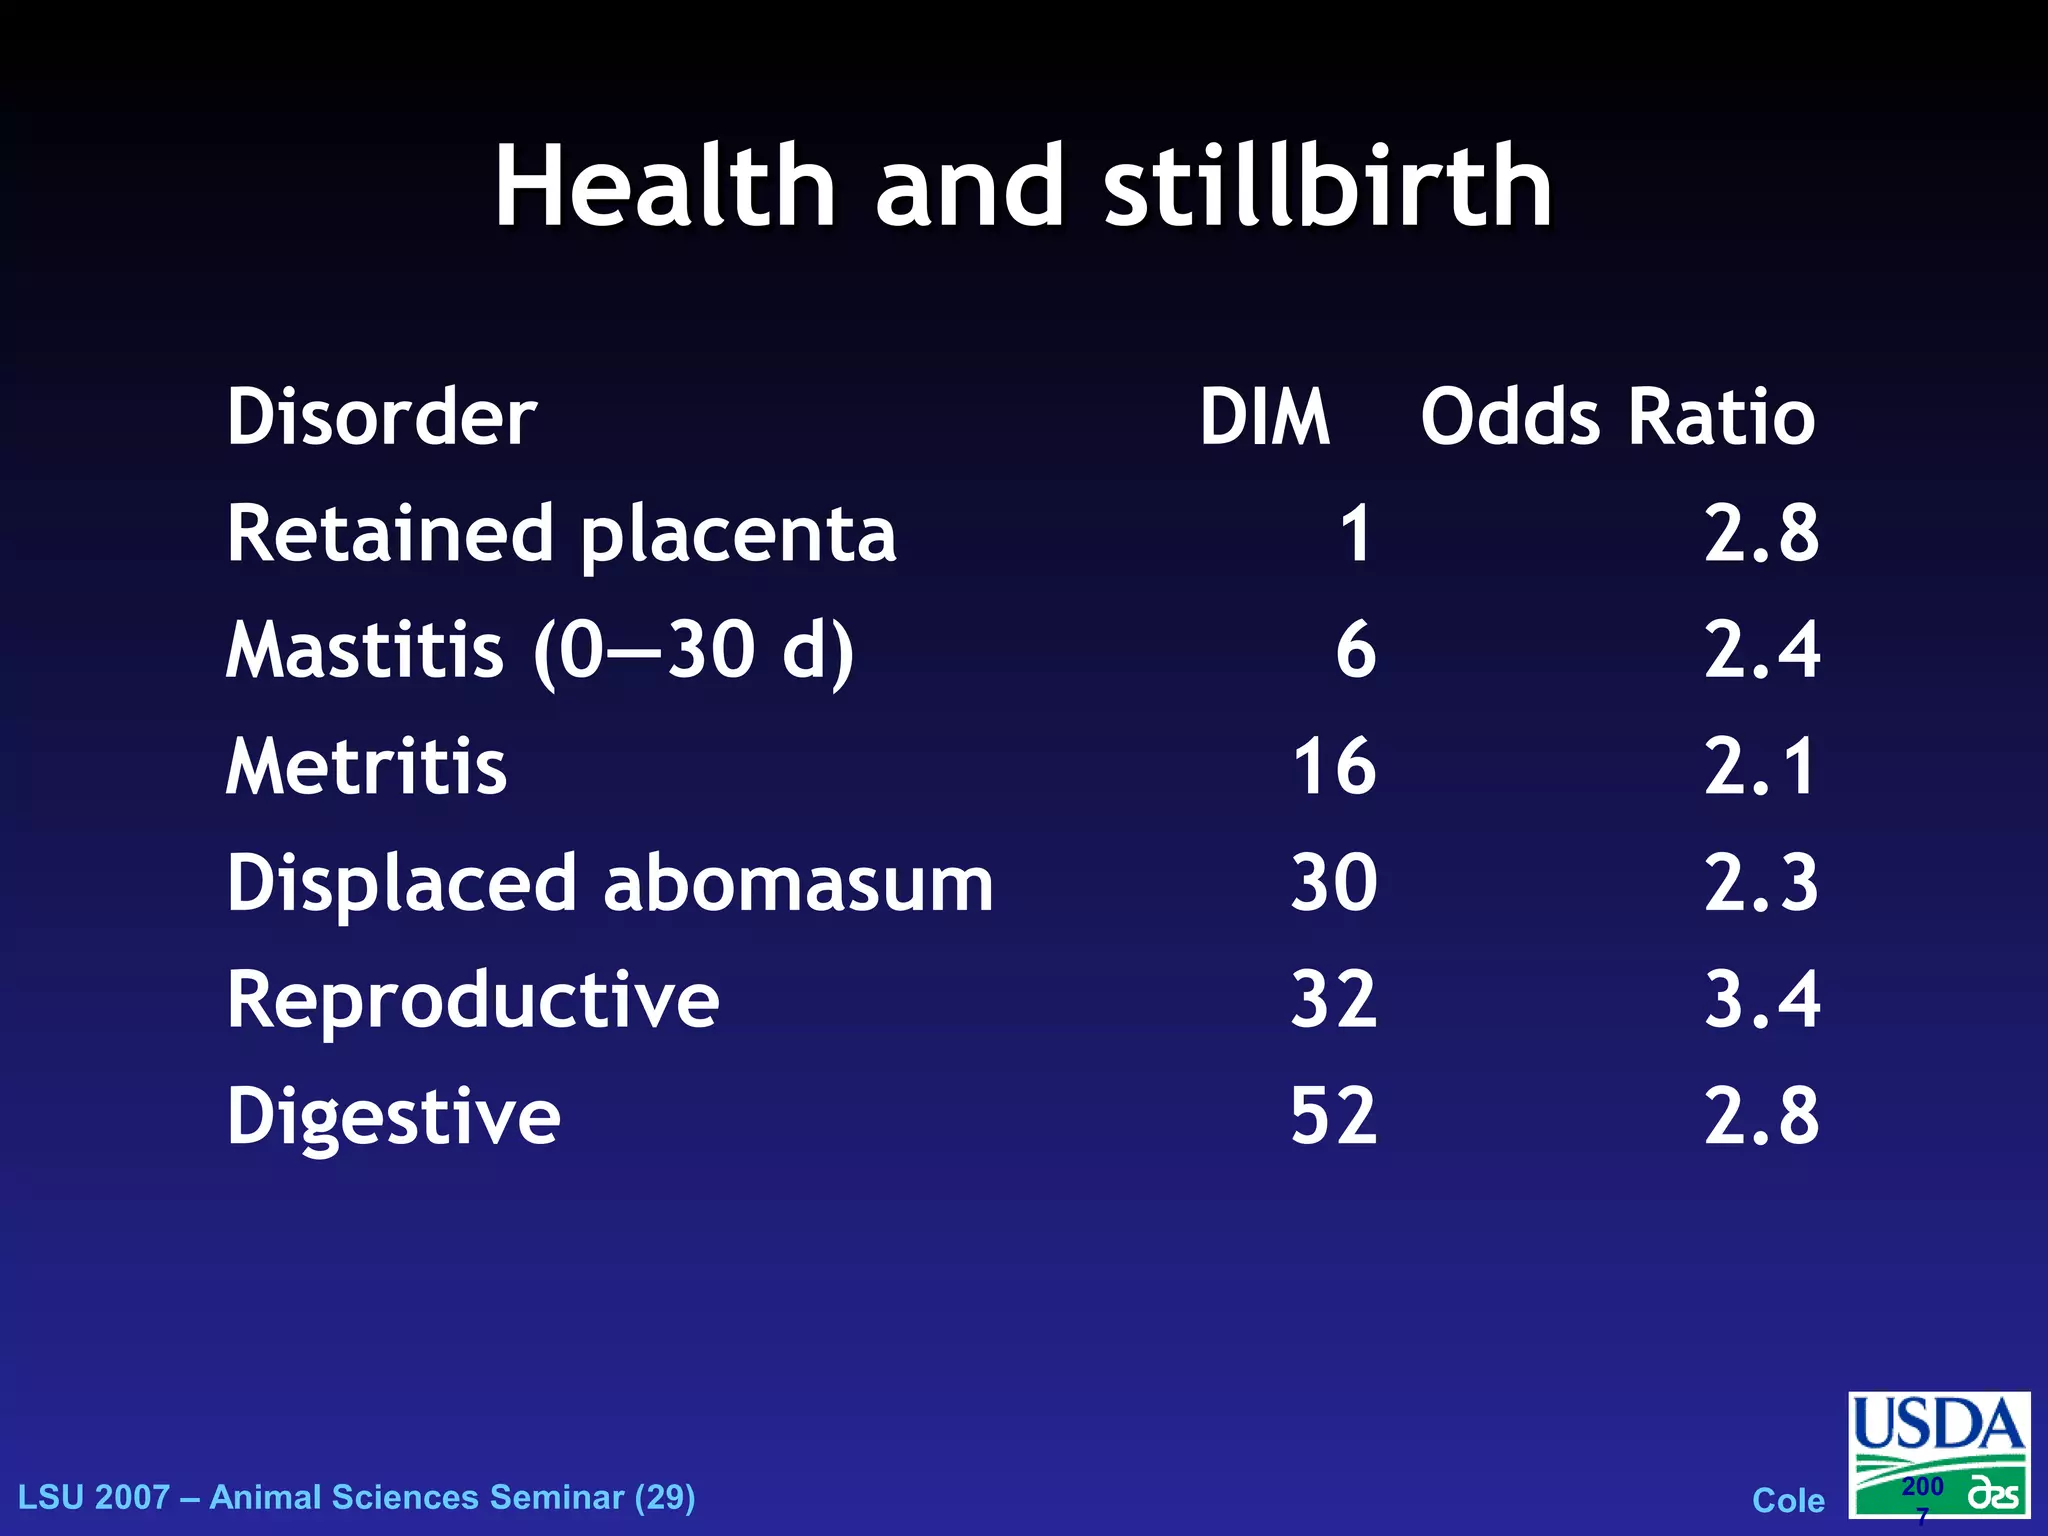
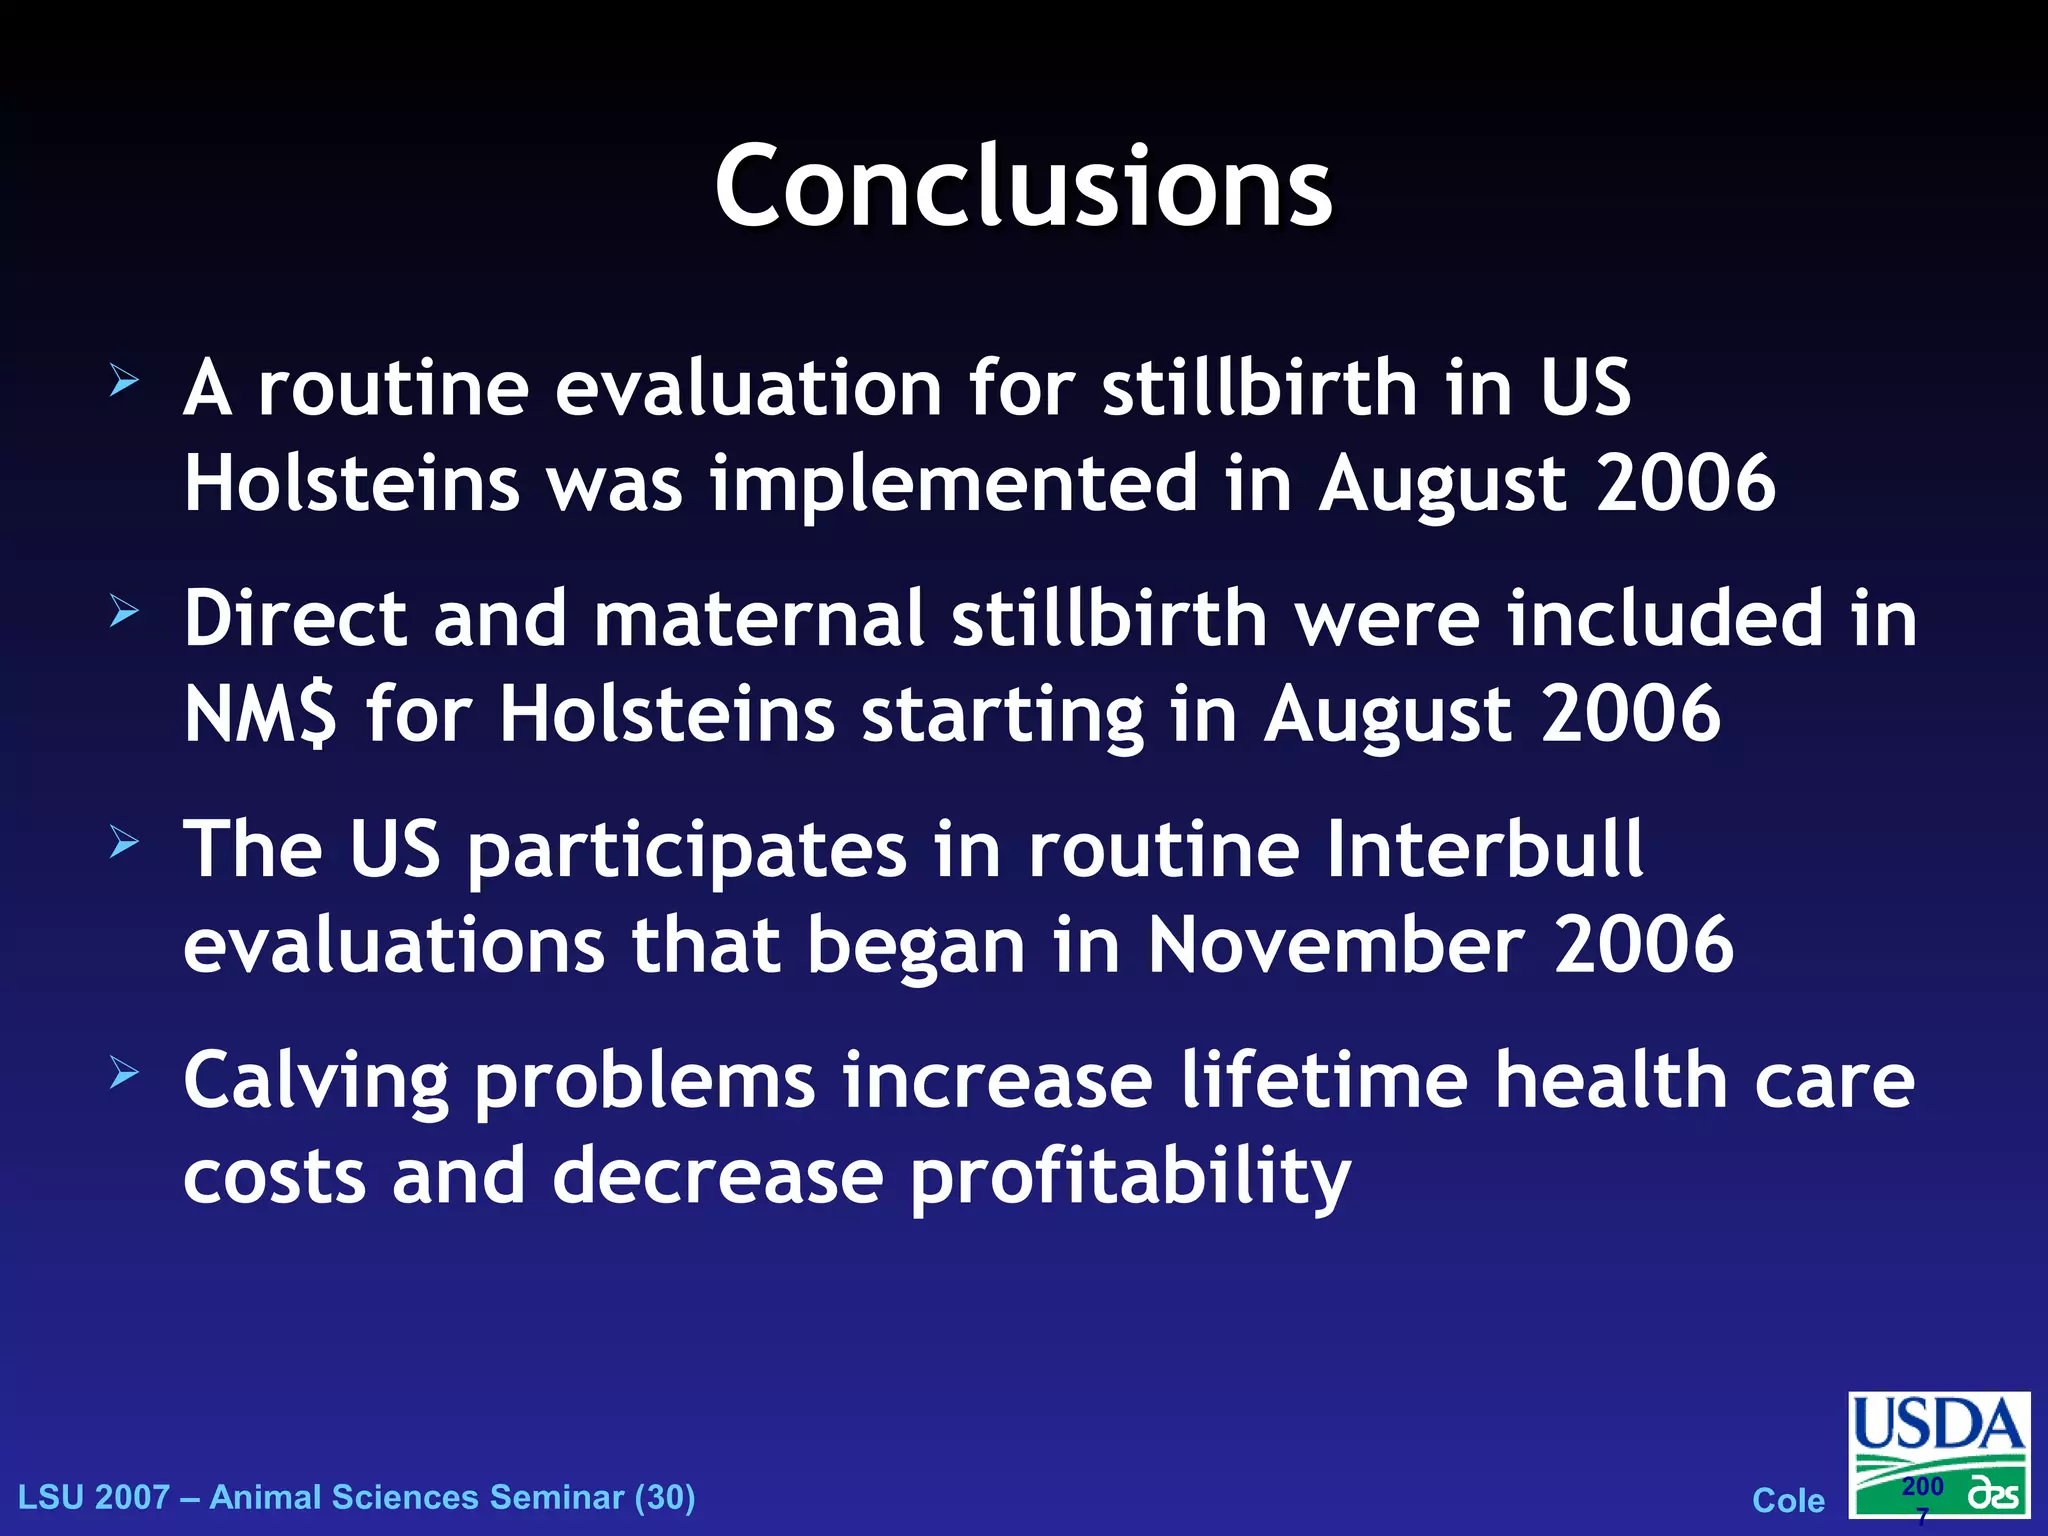

The document outlines genetic evaluations of calving traits, specifically focusing on calving ease and stillbirth rates in US Holsteins, introduced in 2002 and 2006. It discusses the prevalence and economic impacts of dystocia and stillbirth, including data collection methods and statistical models used for evaluation. The findings indicate ongoing efforts to improve calf livability and highlight associated health issues related to calving difficulties.


