Download to read offline


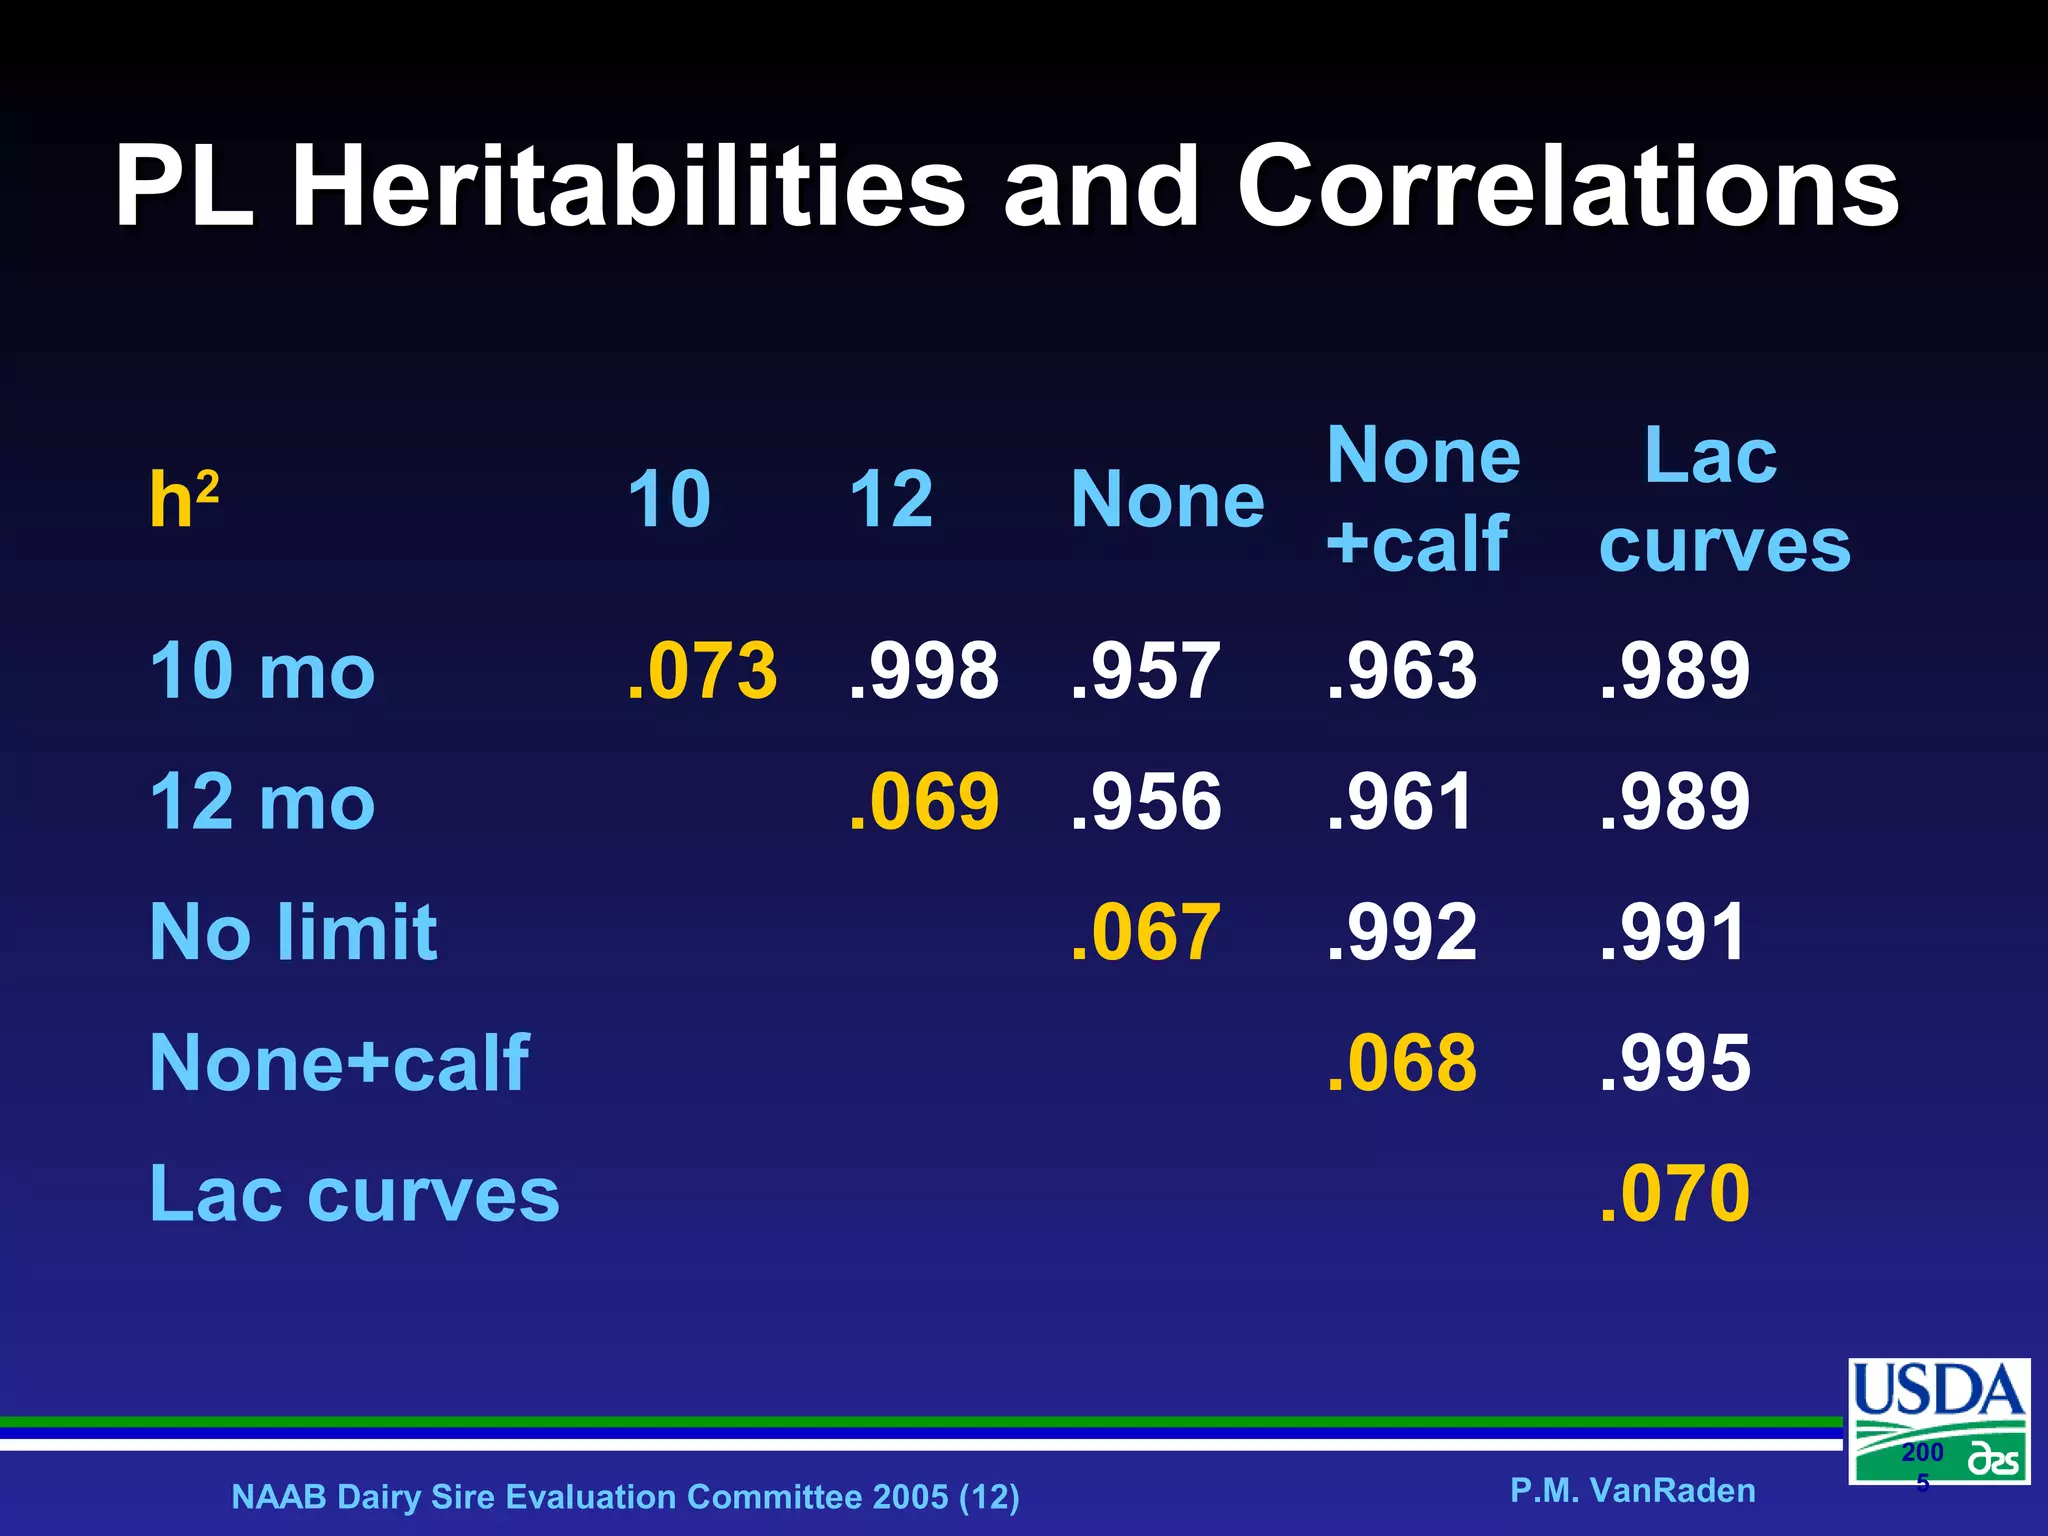
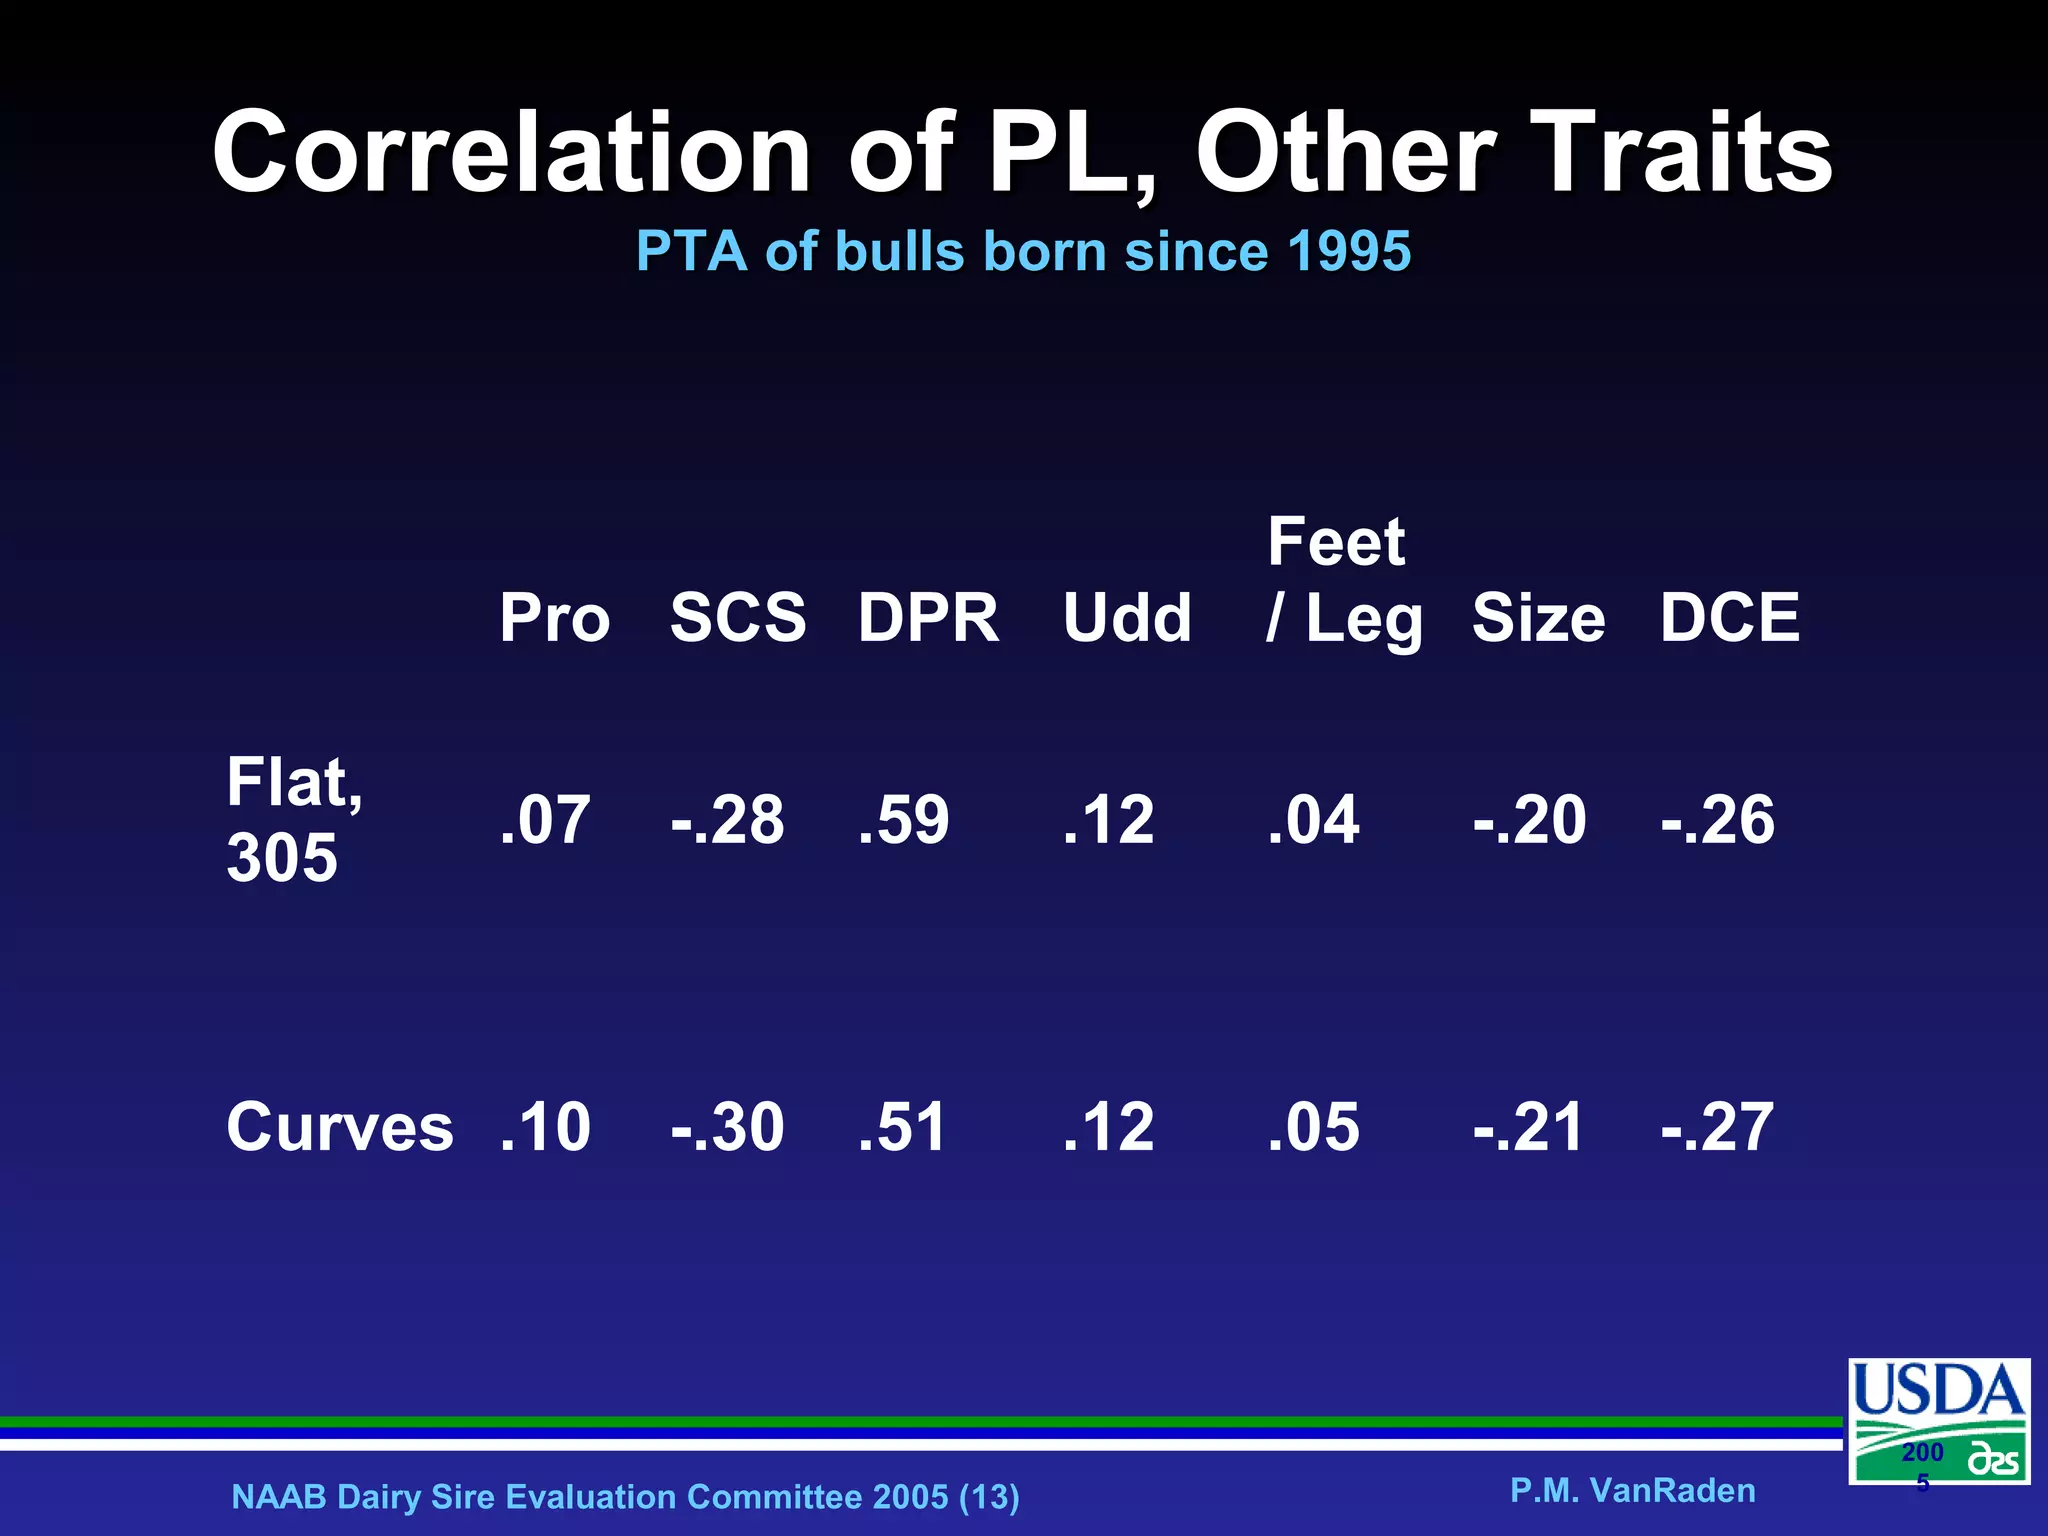

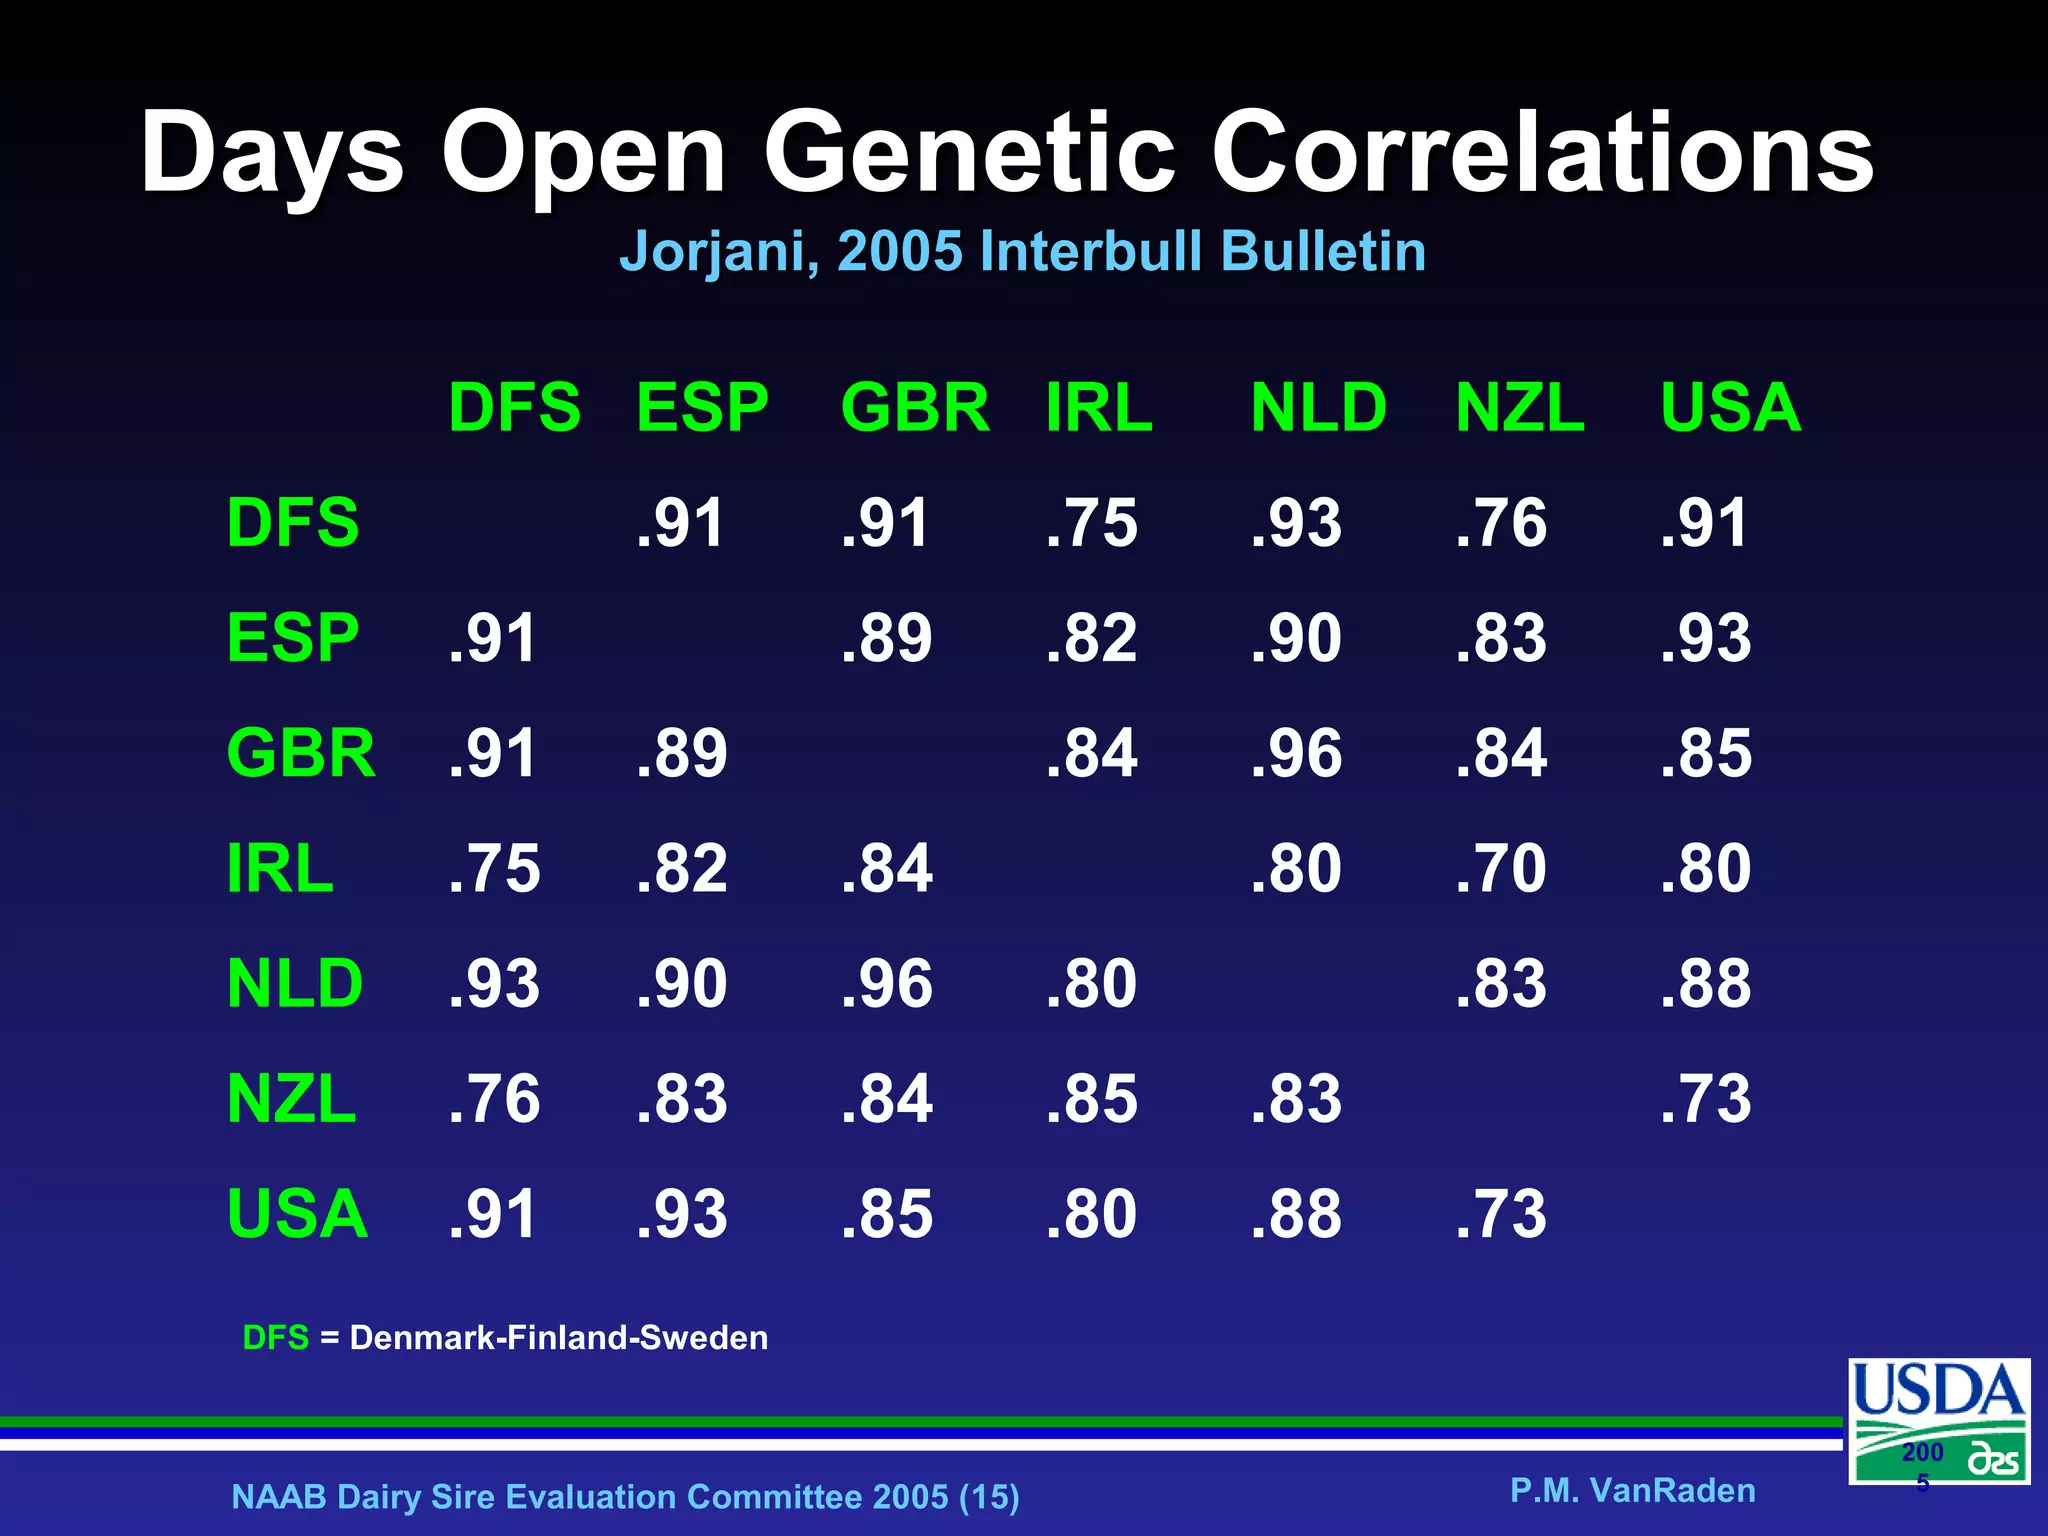
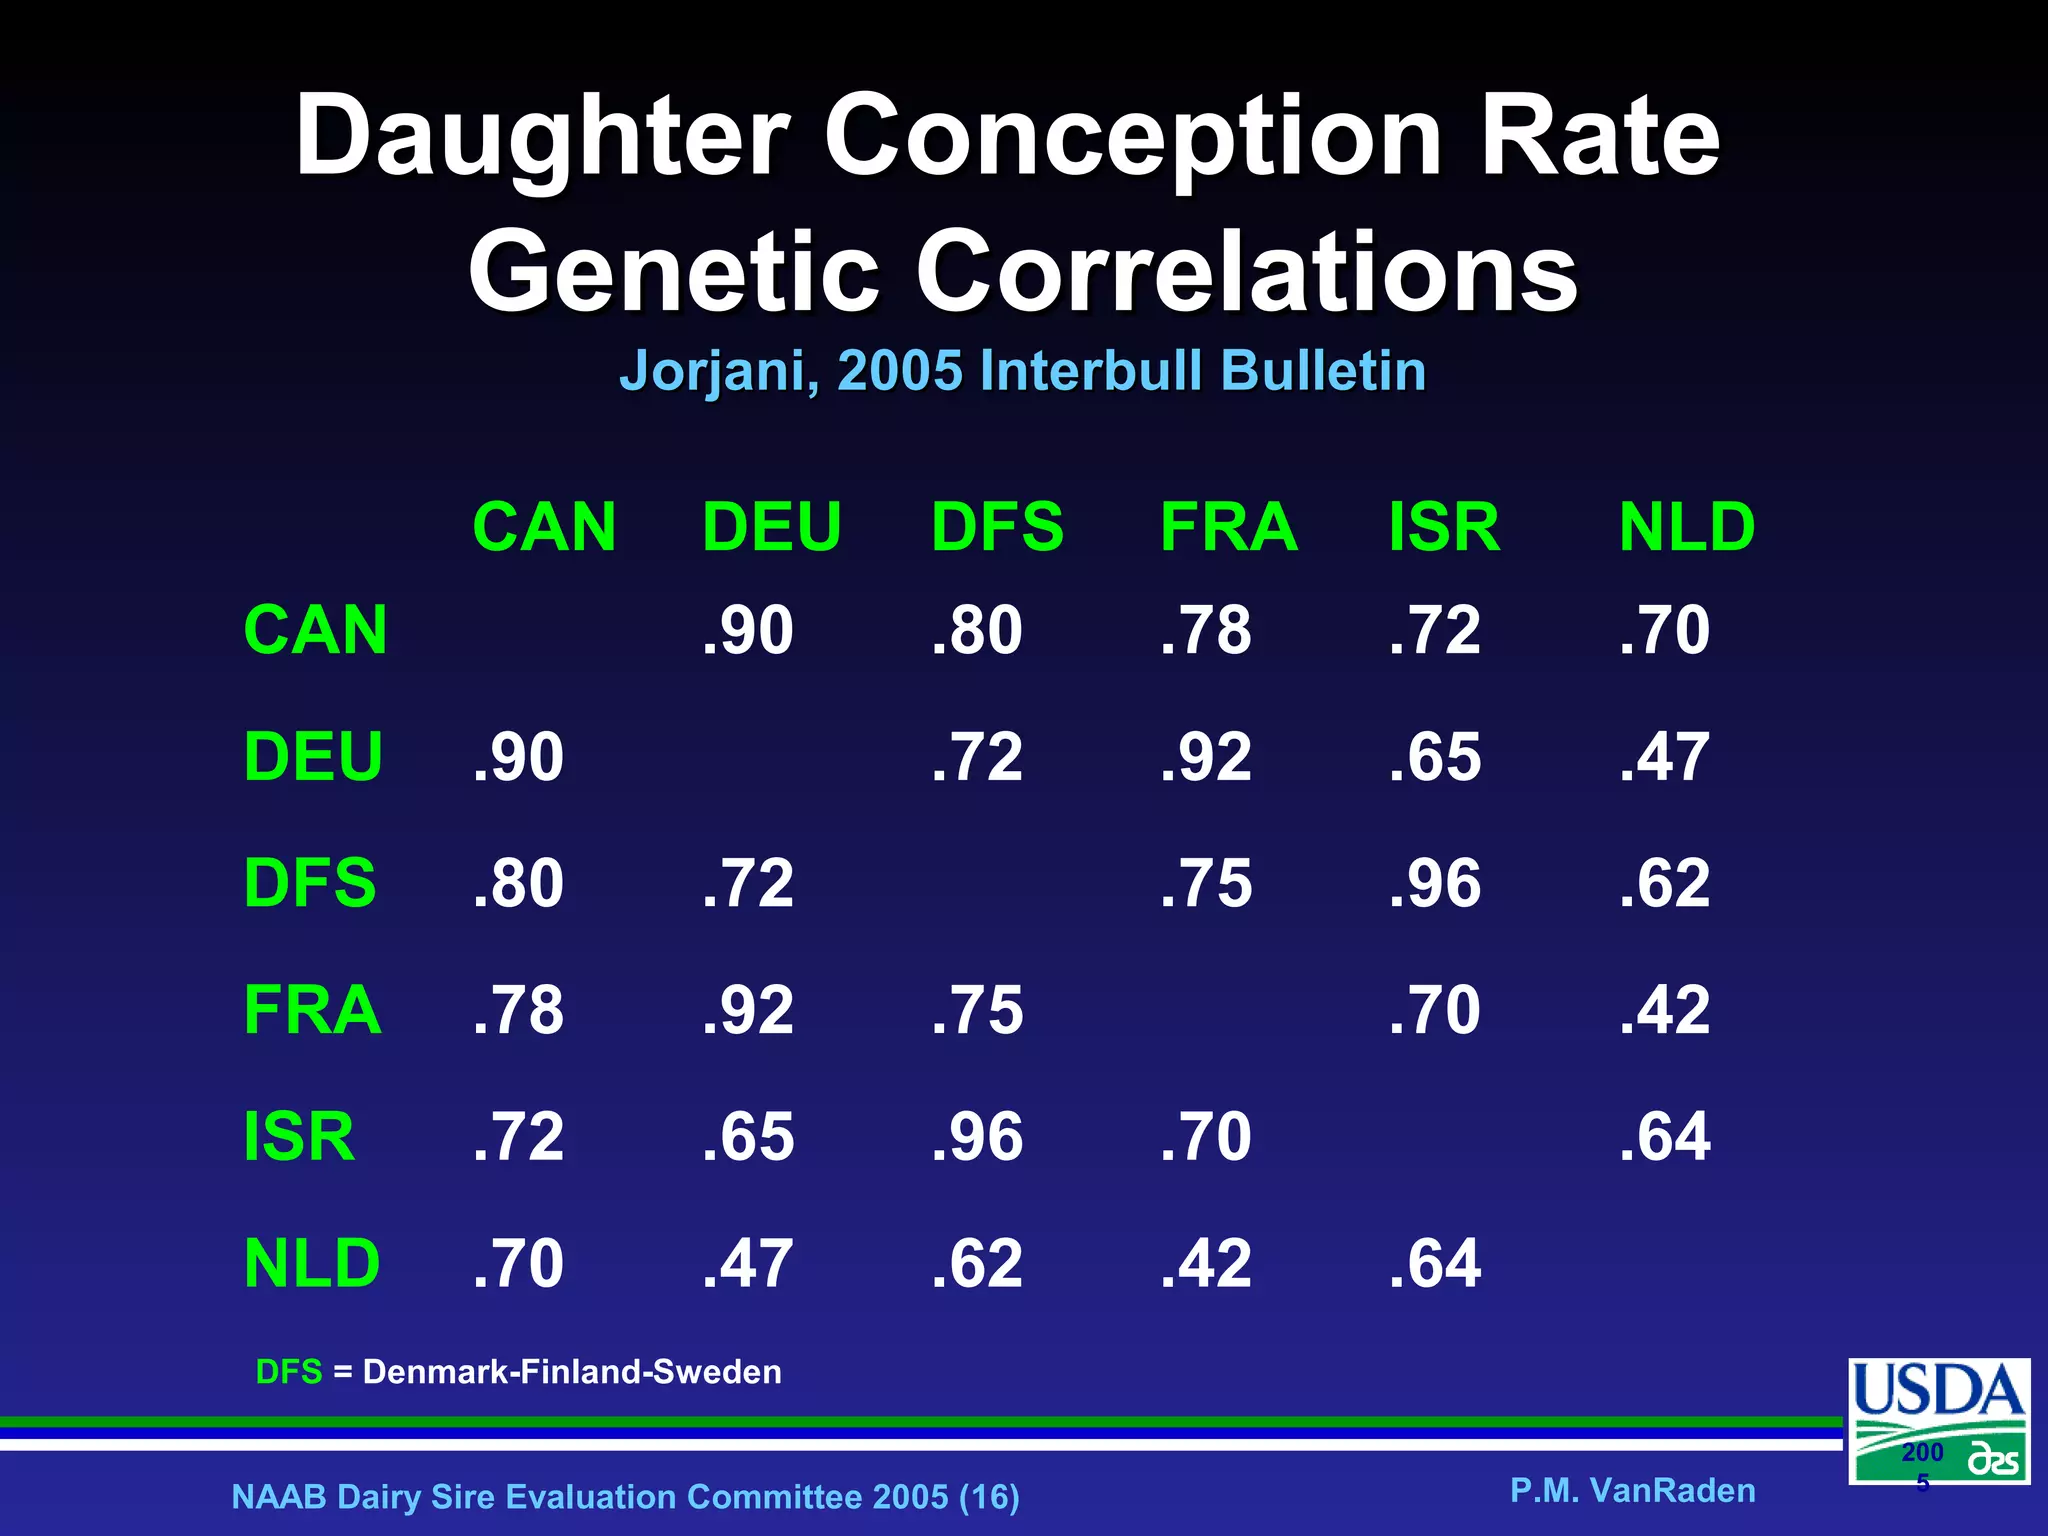


The document presents an evaluation on the traits of stillbirth, longevity, and fertility in dairy cattle, highlighting the definitions, statistical distributions, and genetic correlations related to these traits. It includes data on stillbirth rates for different parities, correlation of traits, and discusses the reliability of the evaluations. Key metrics focus on improving herd productivity through genetic evaluations by the NAAB Dairy Sire Evaluation Committee.