Download as PDF, PPTX
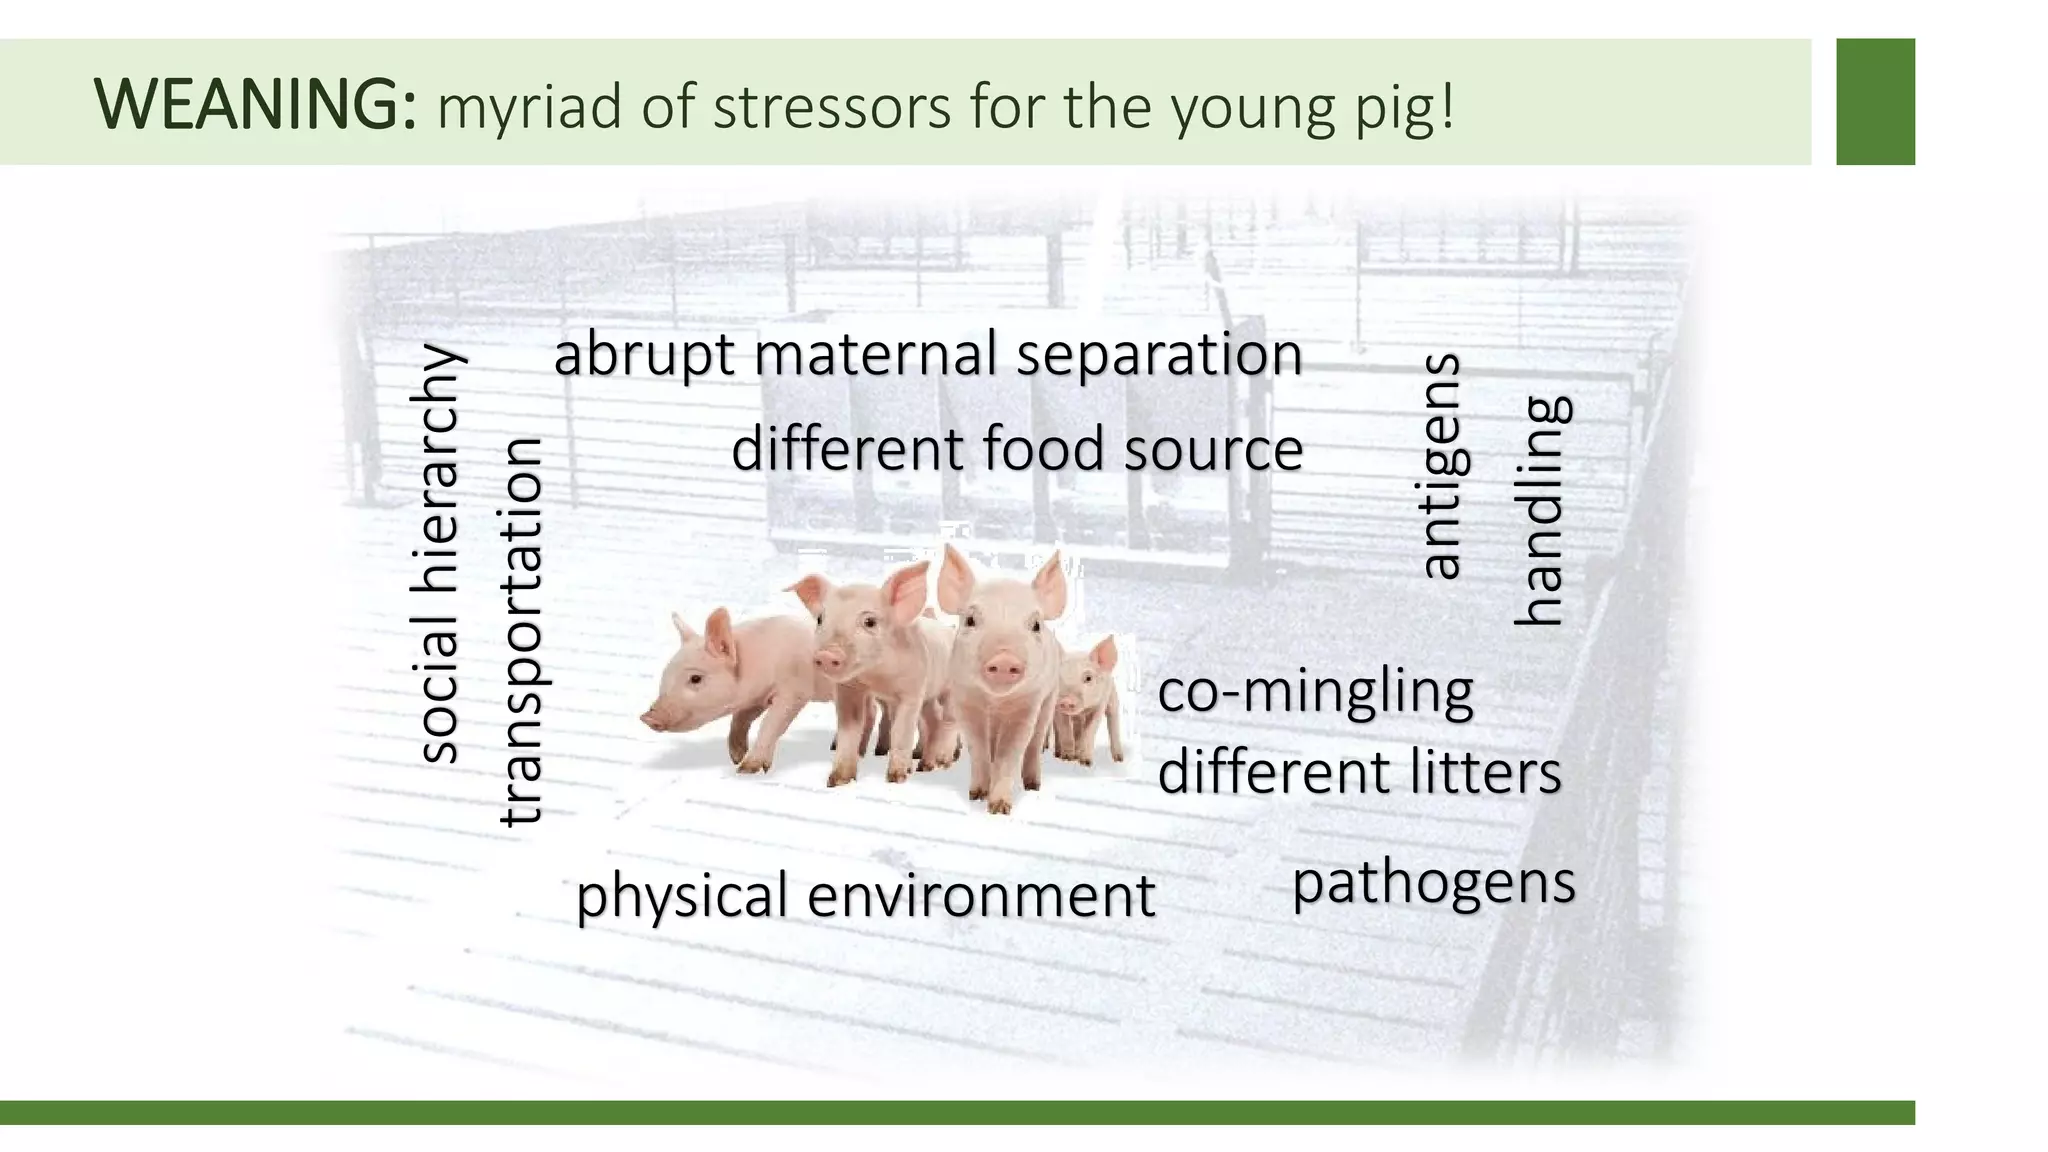

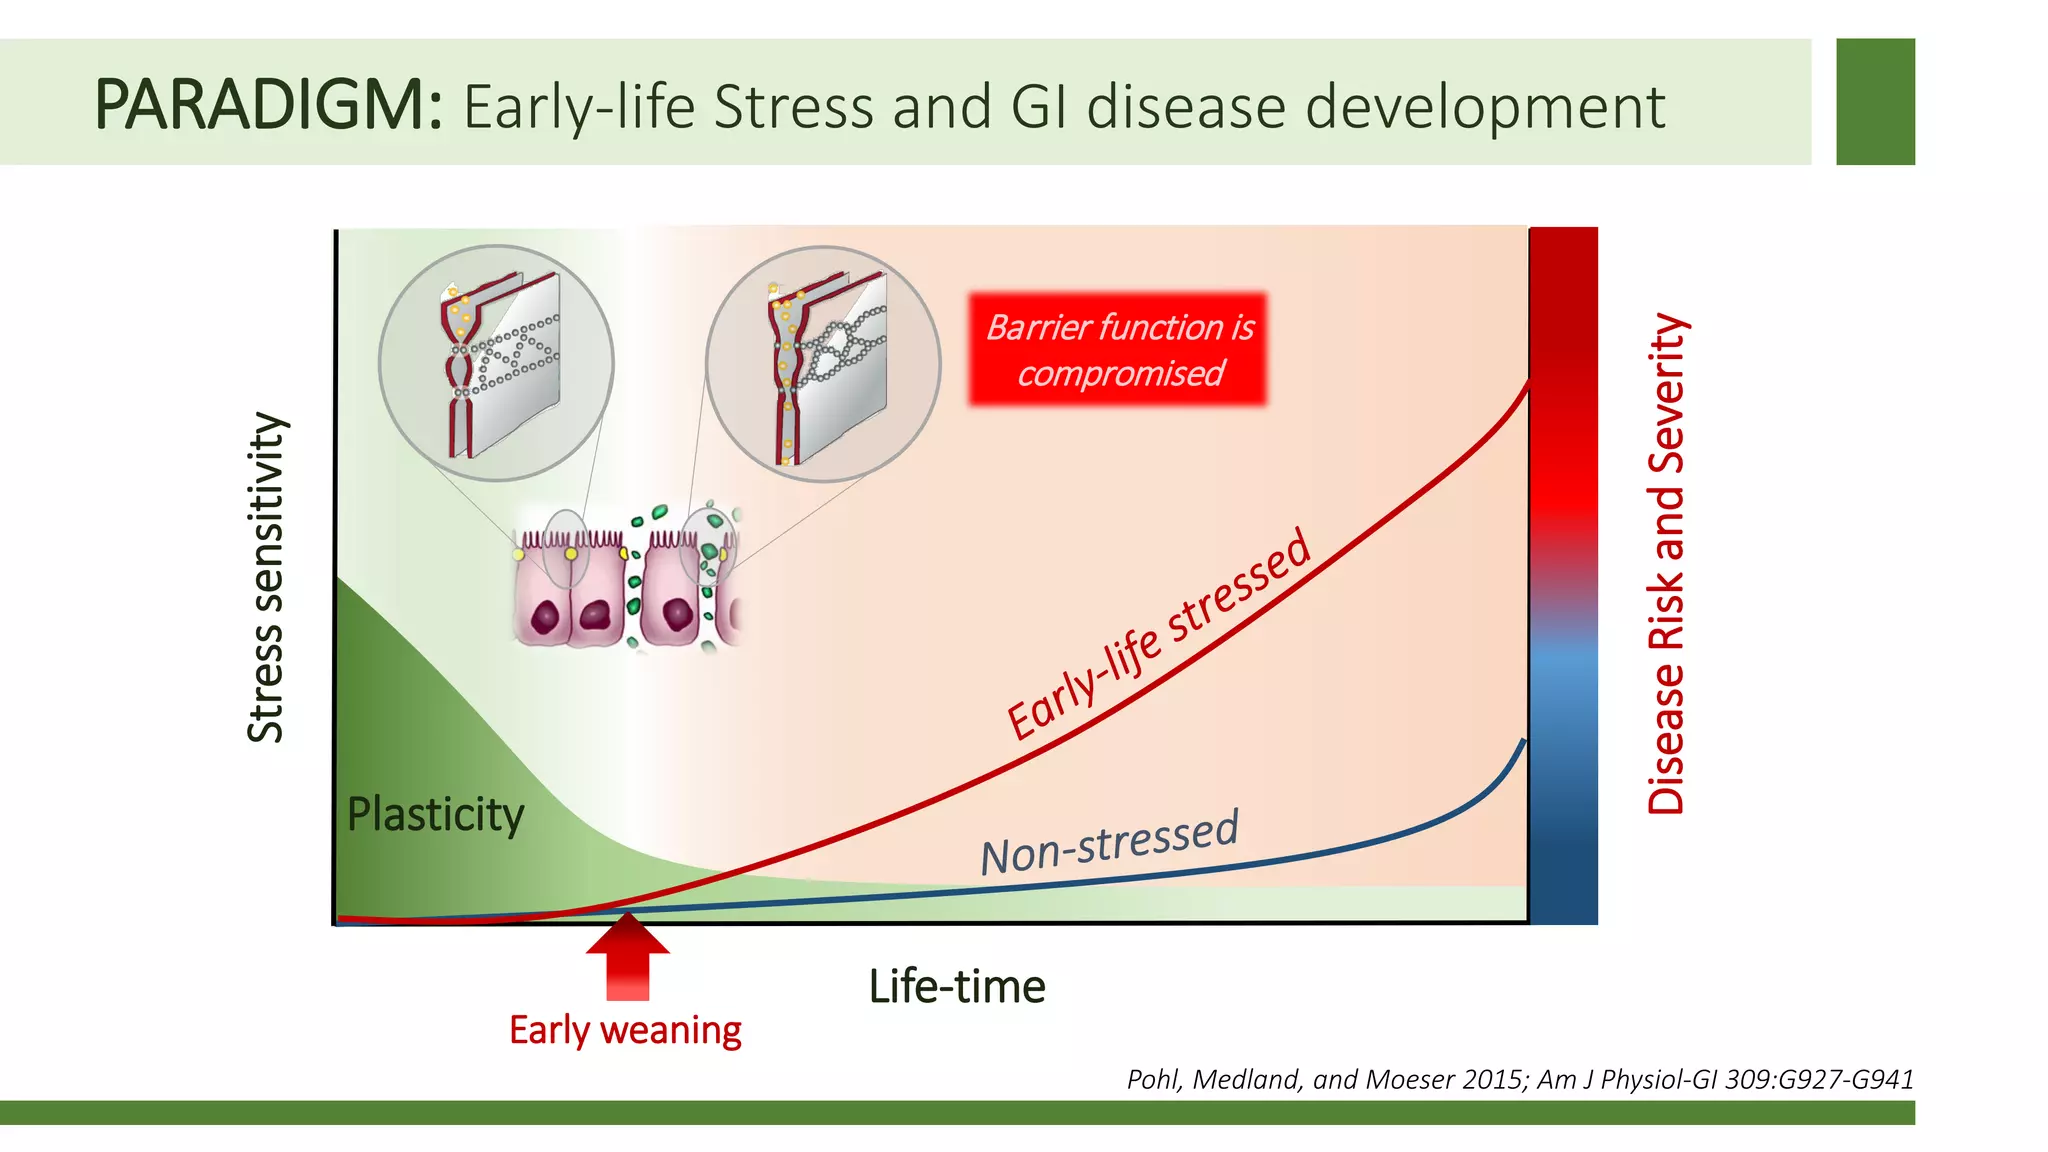


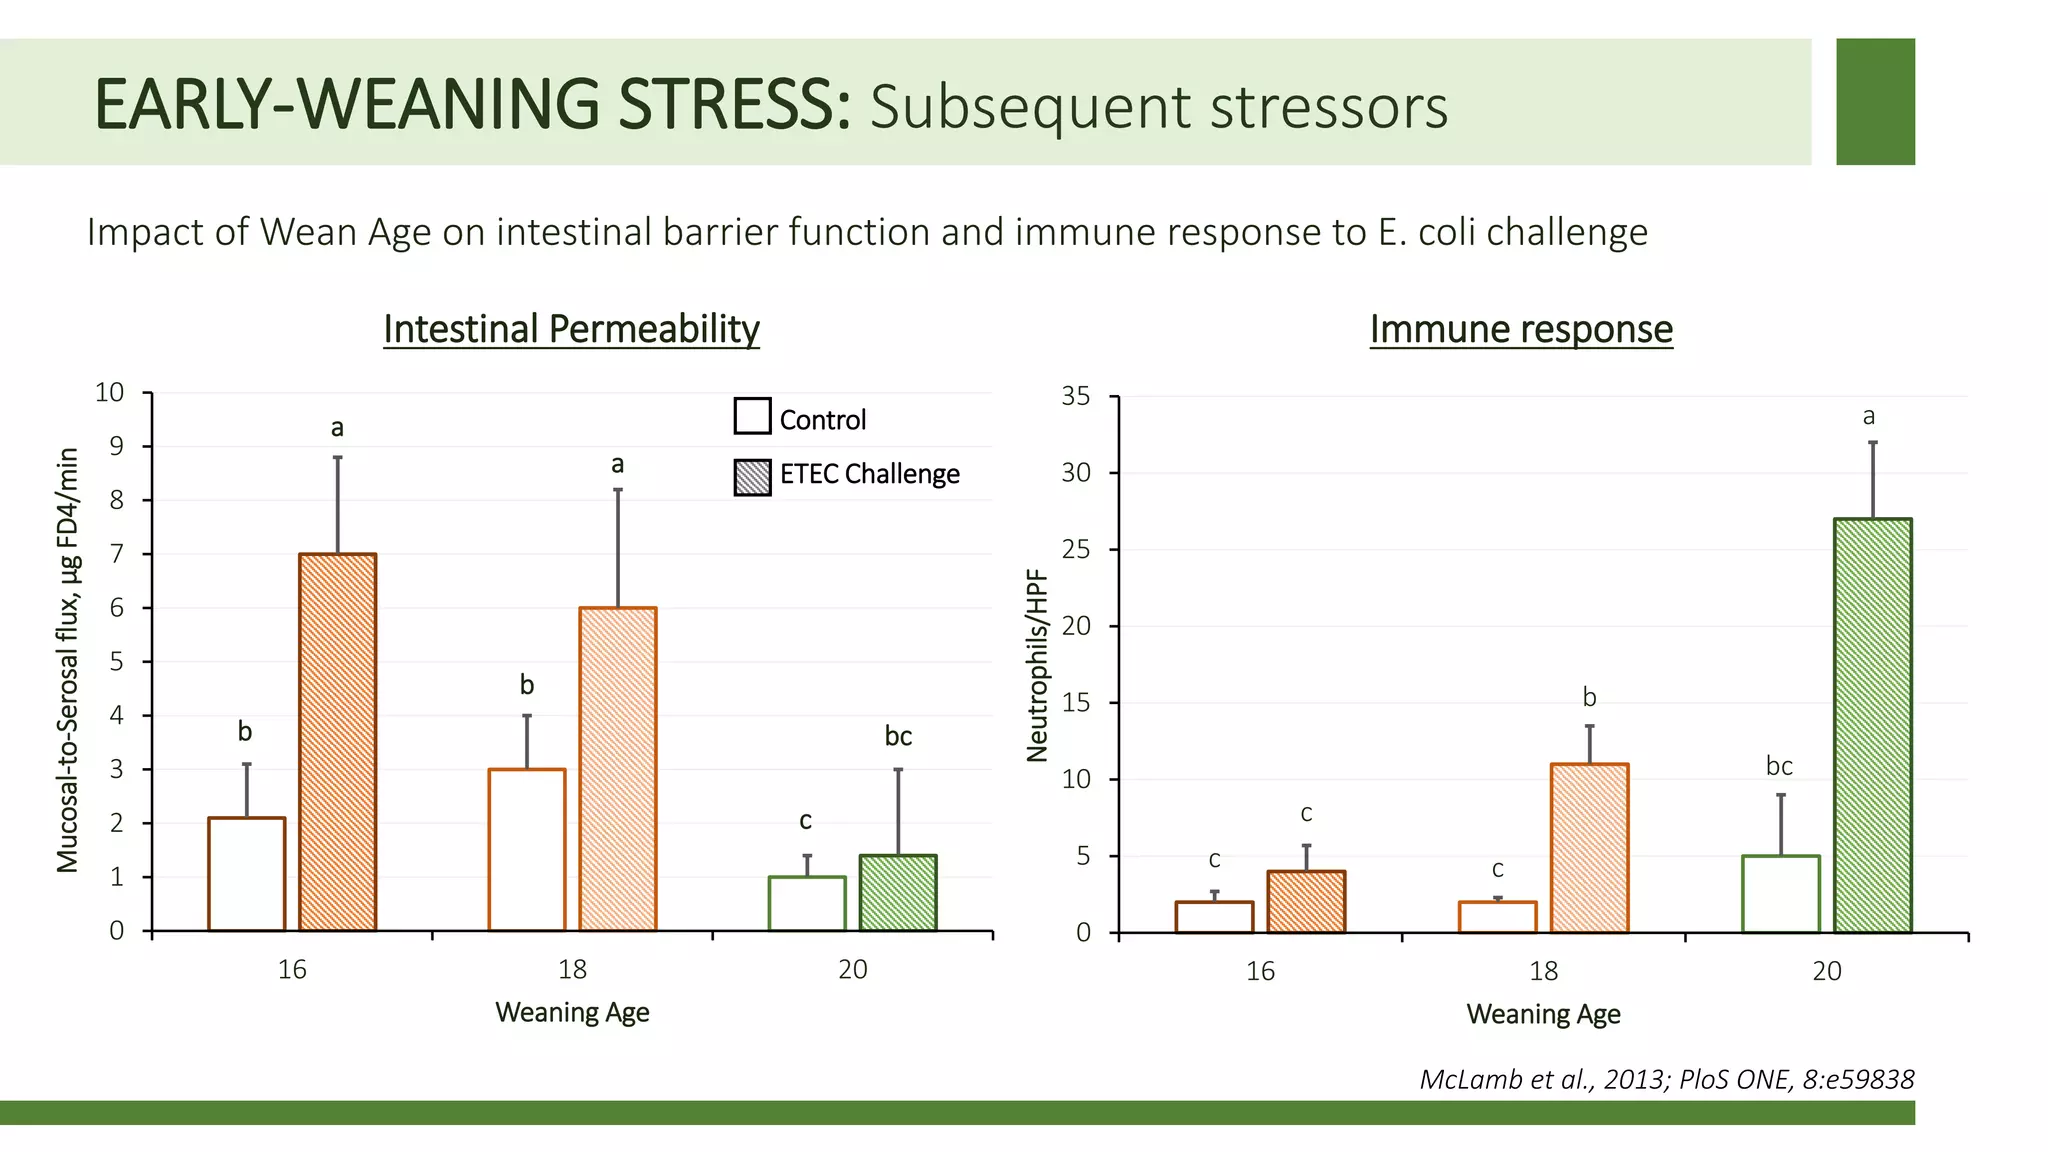
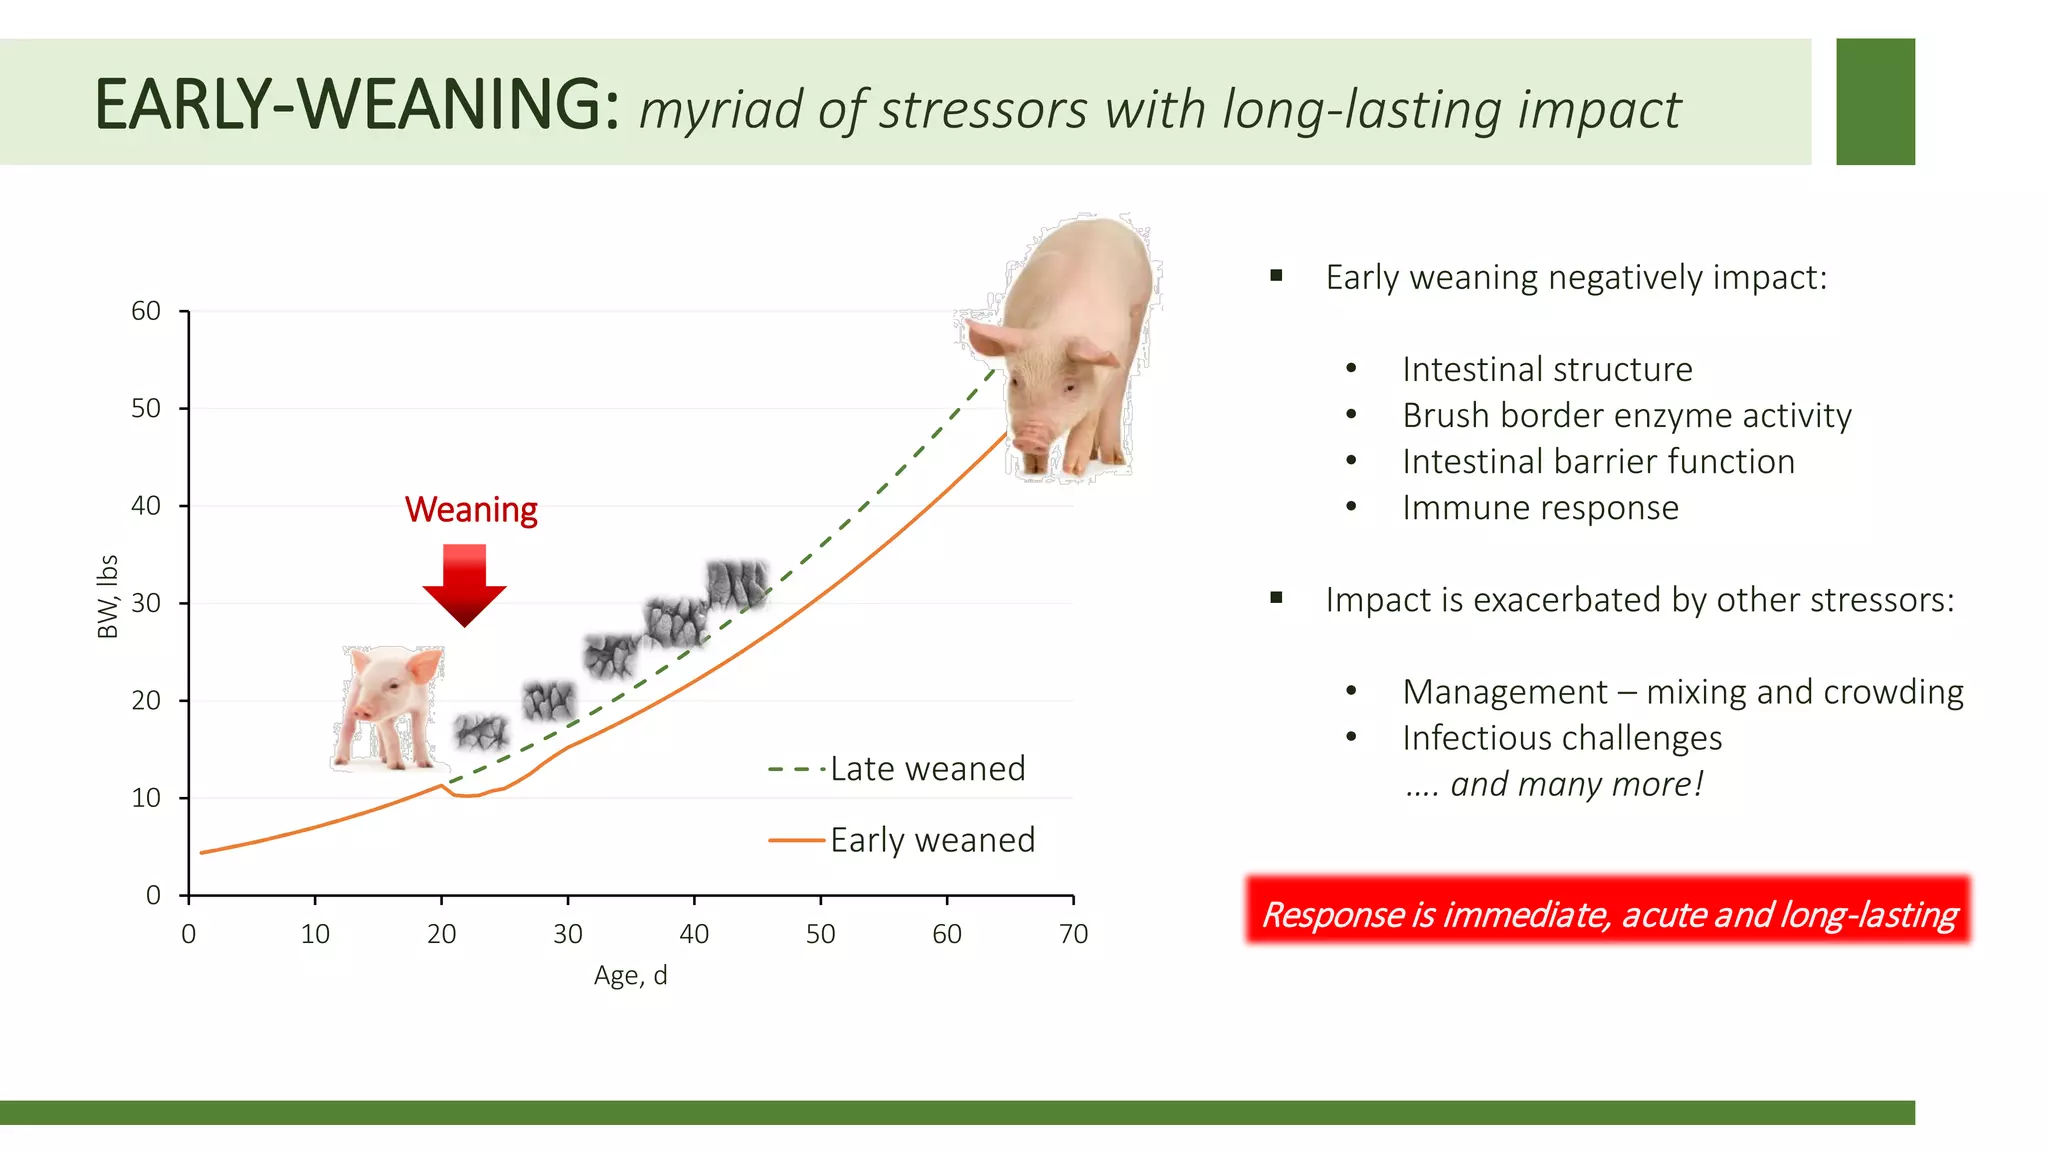


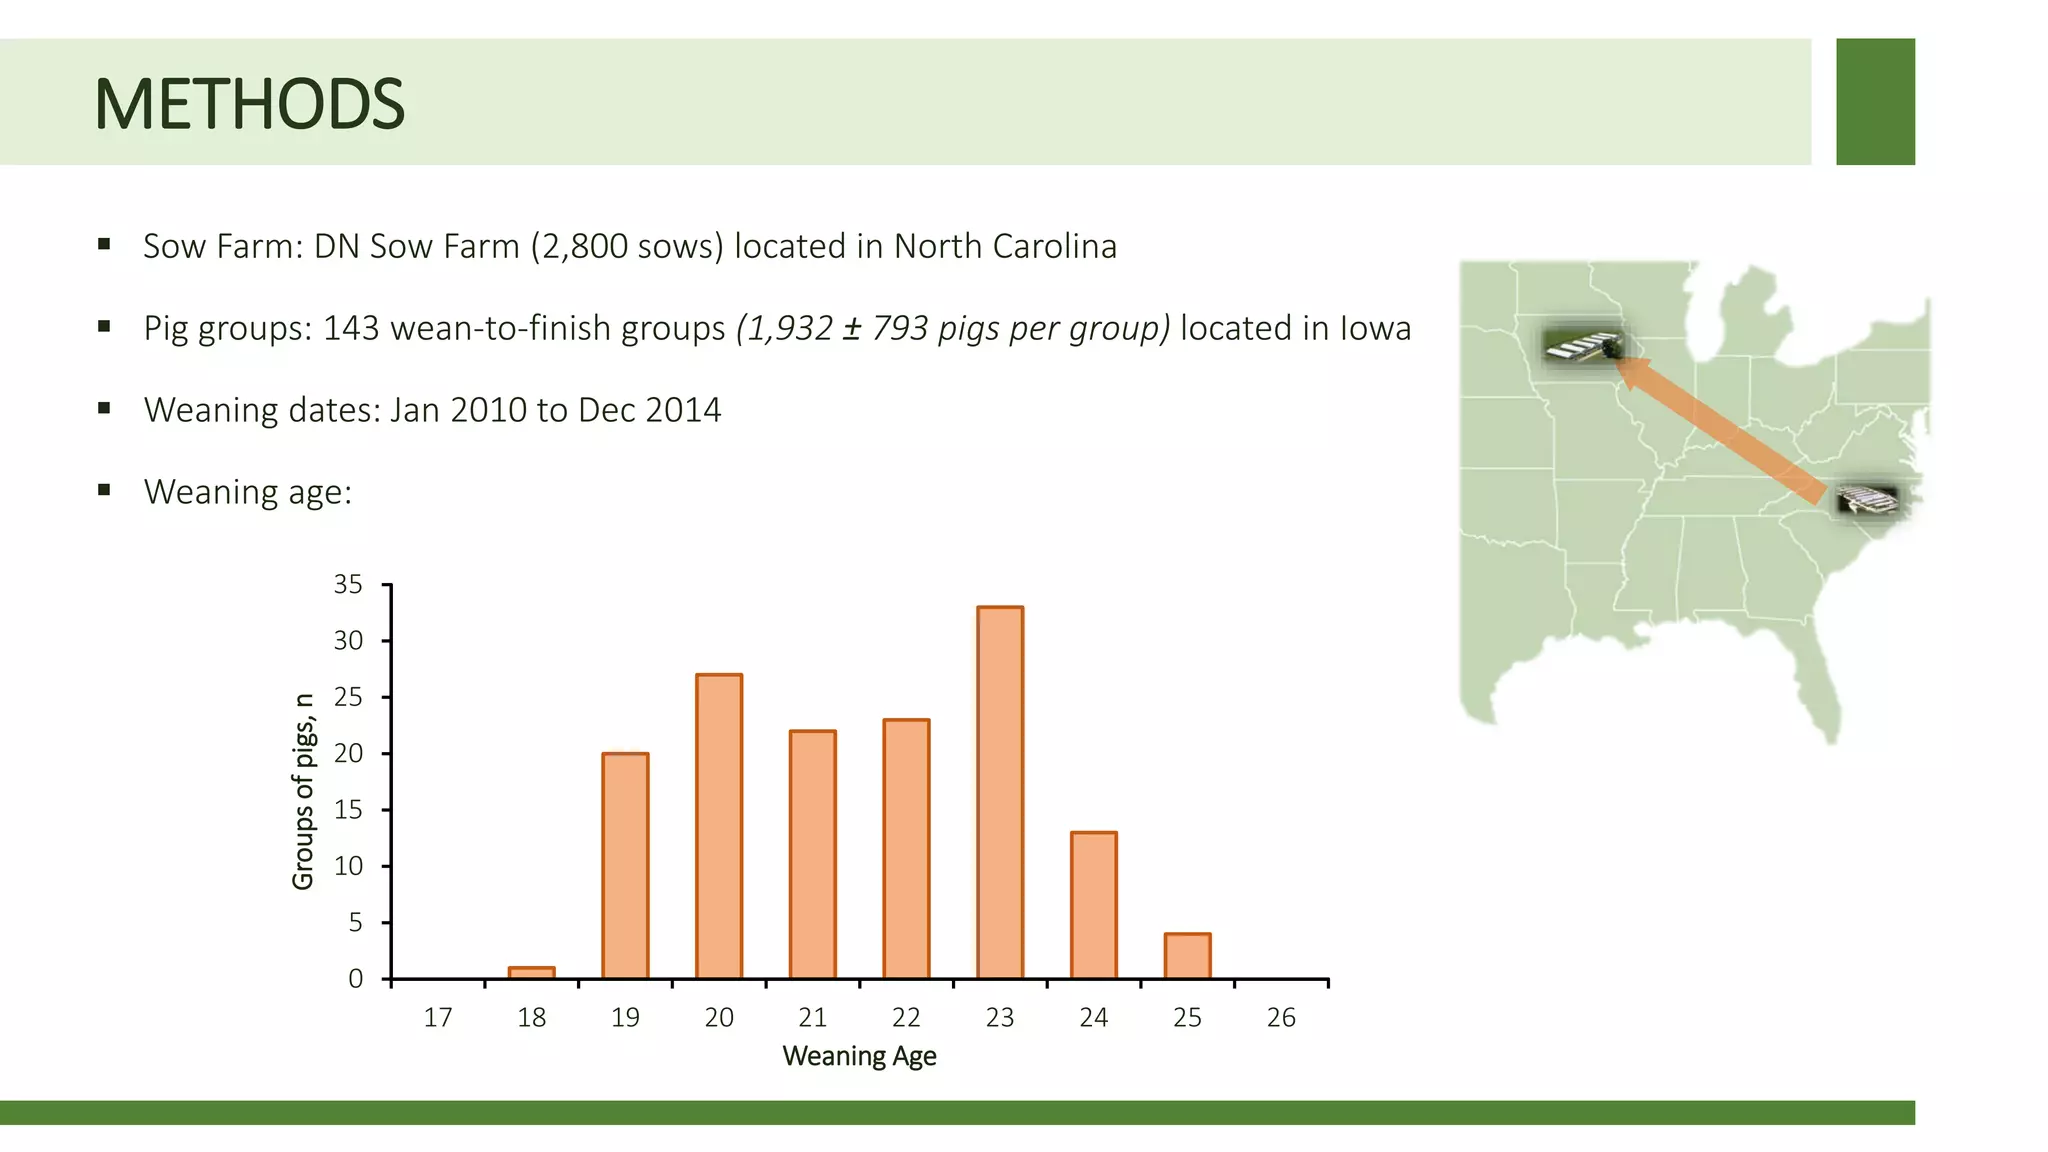


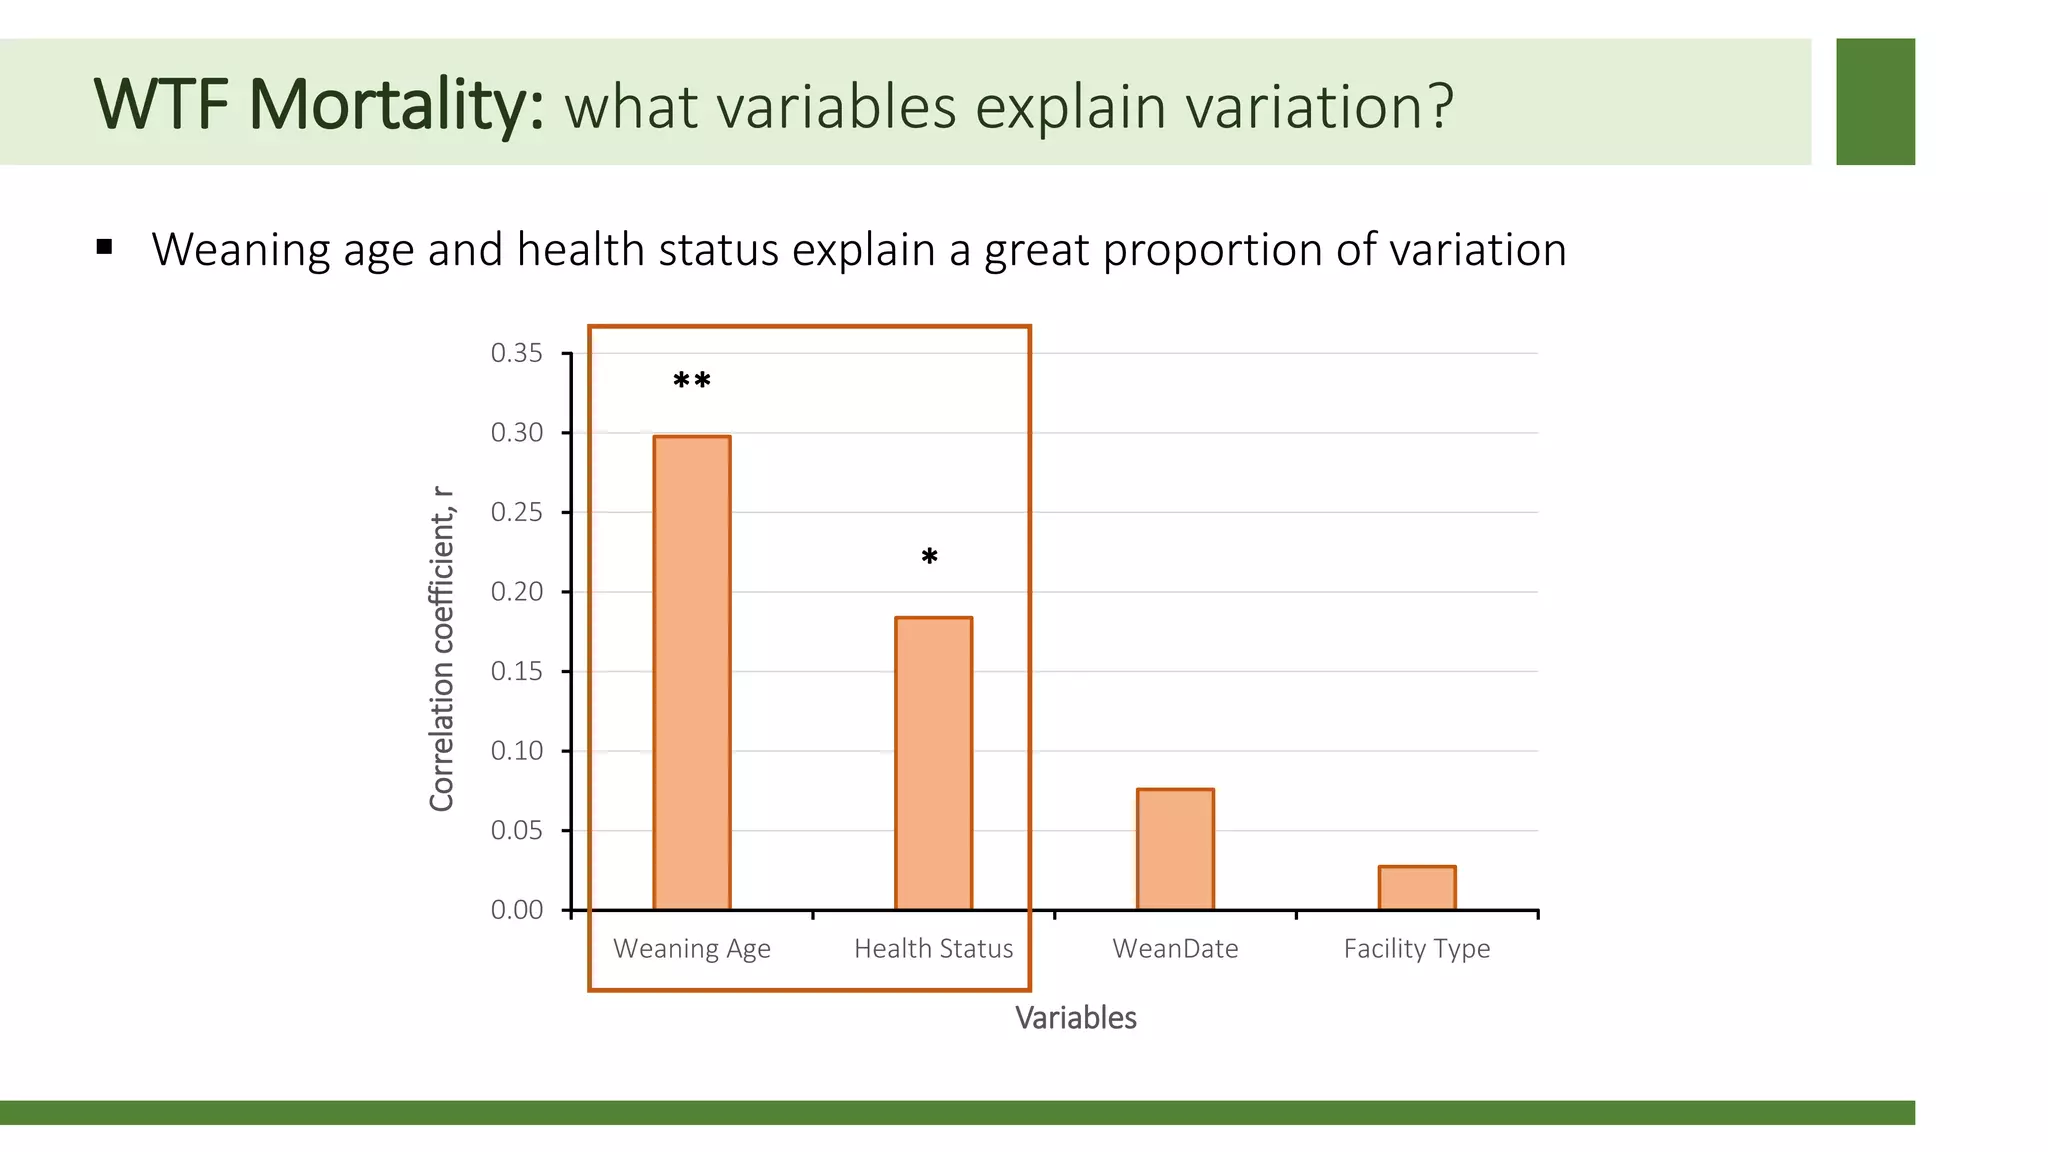
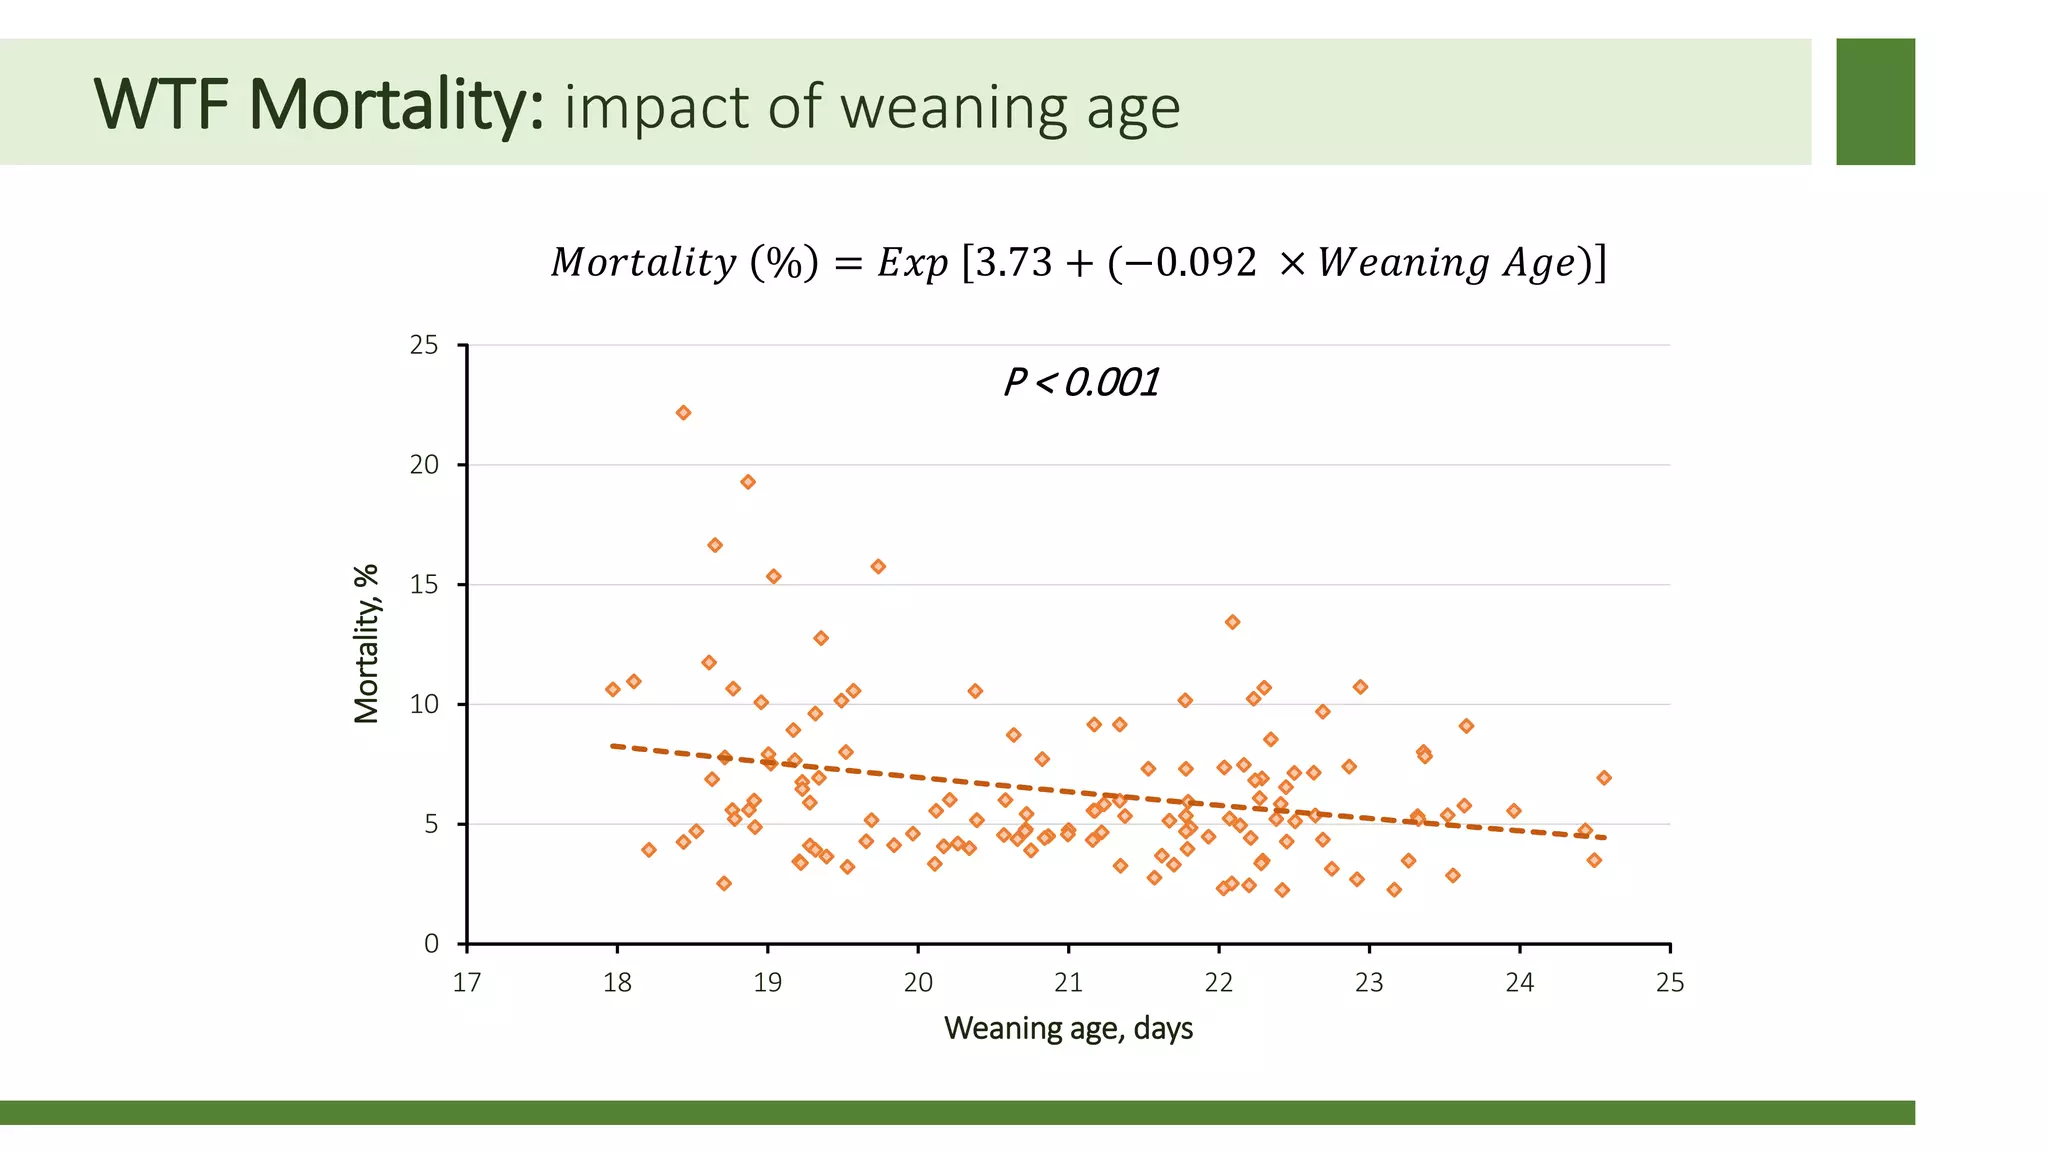
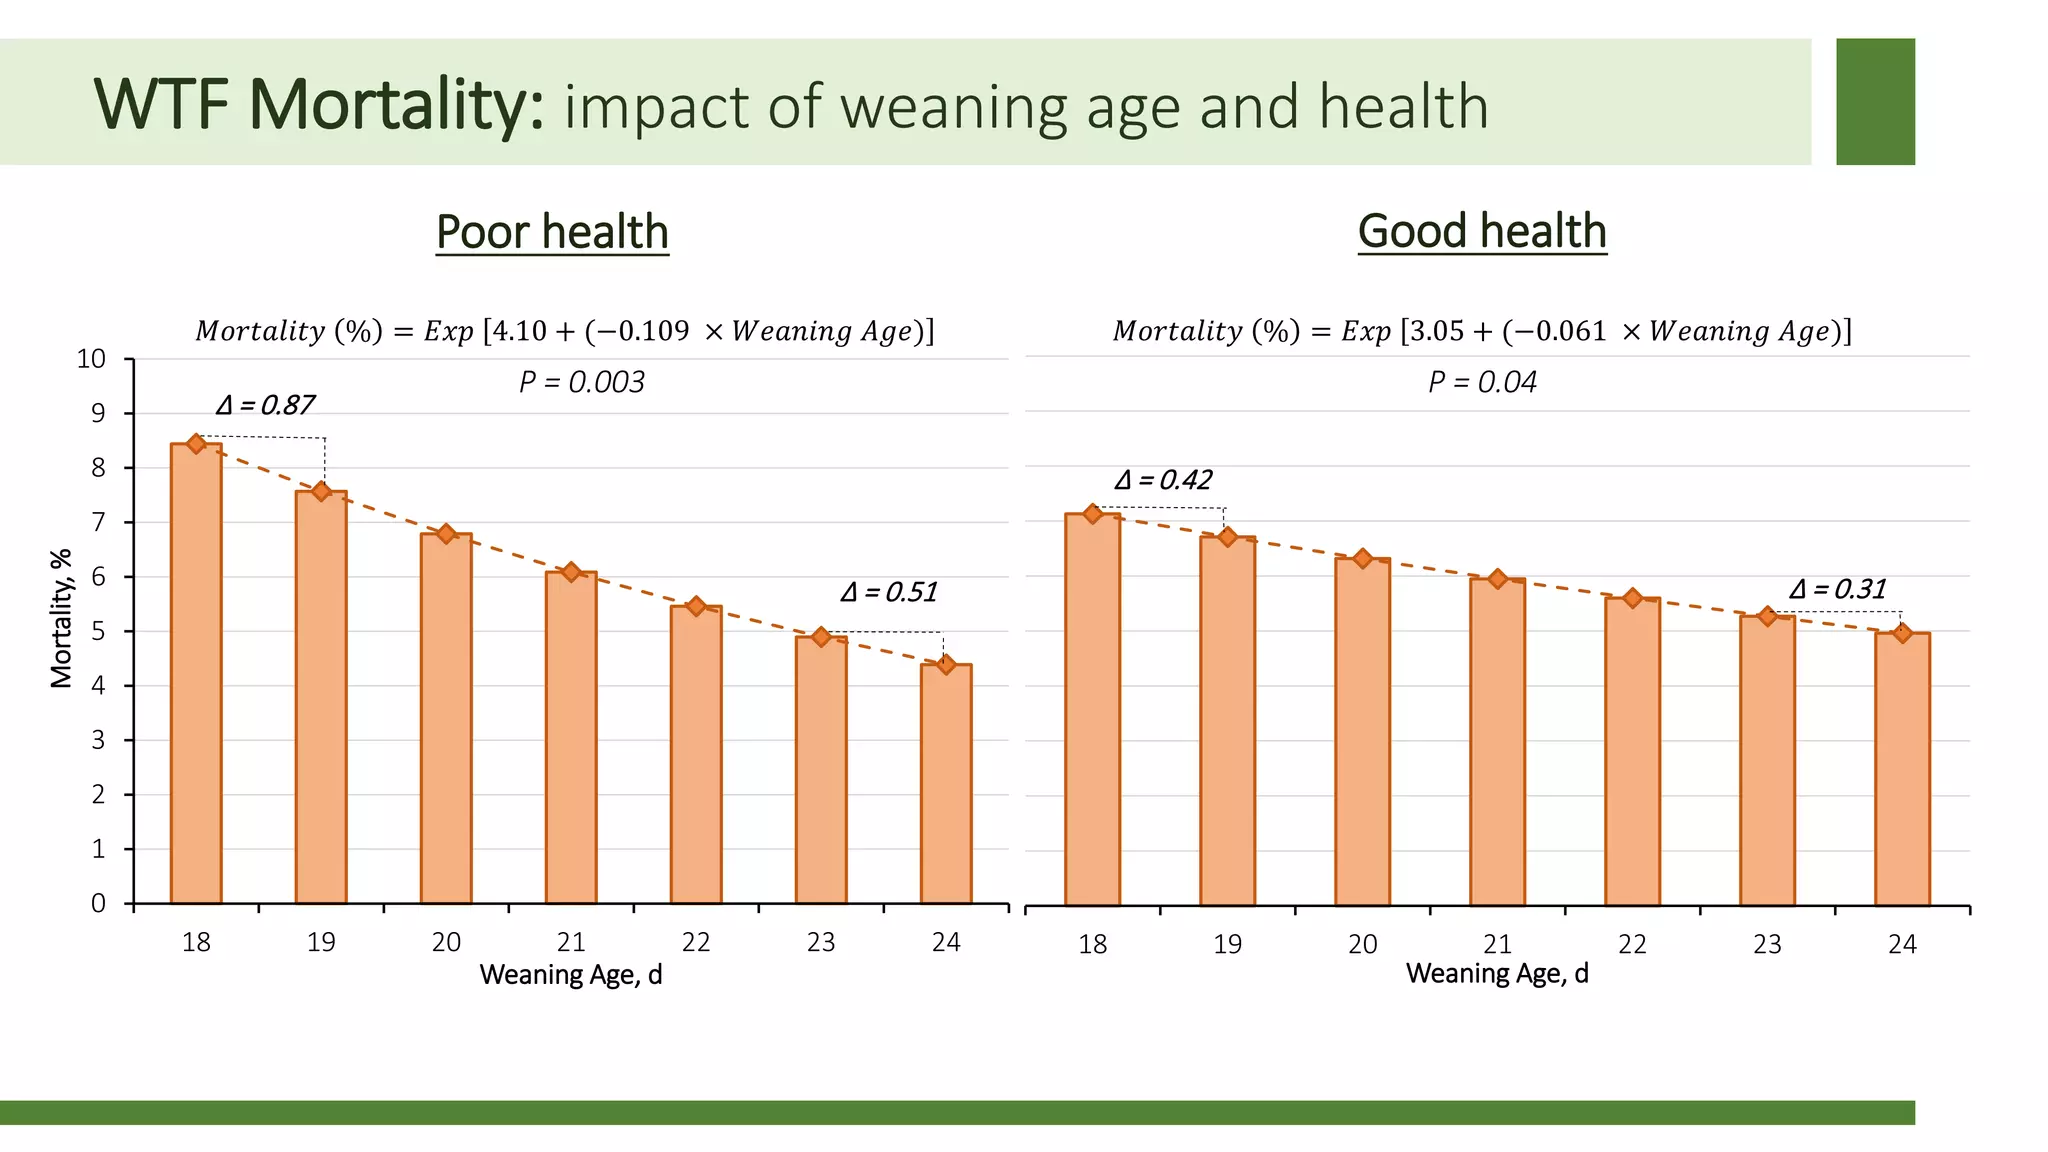


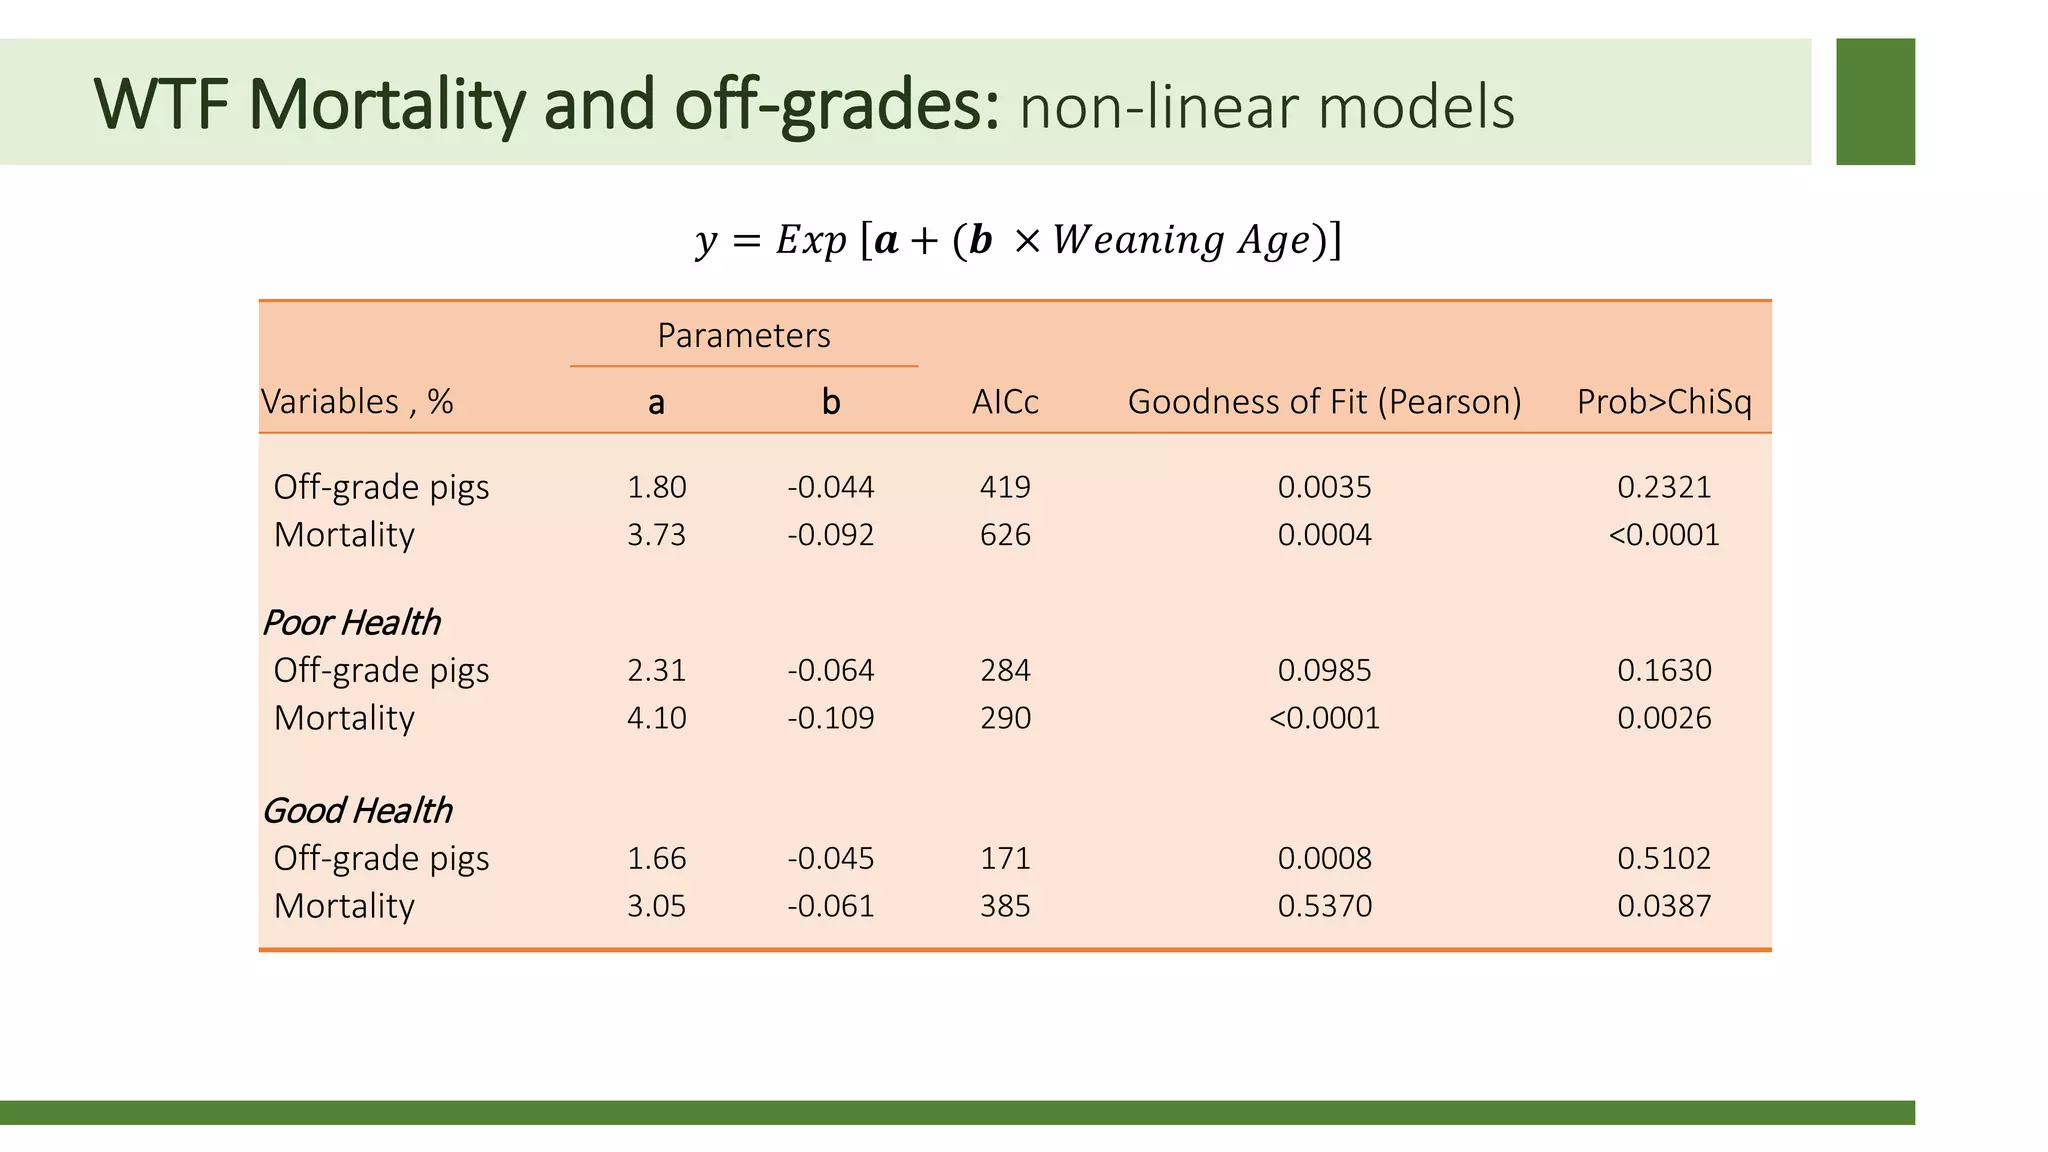

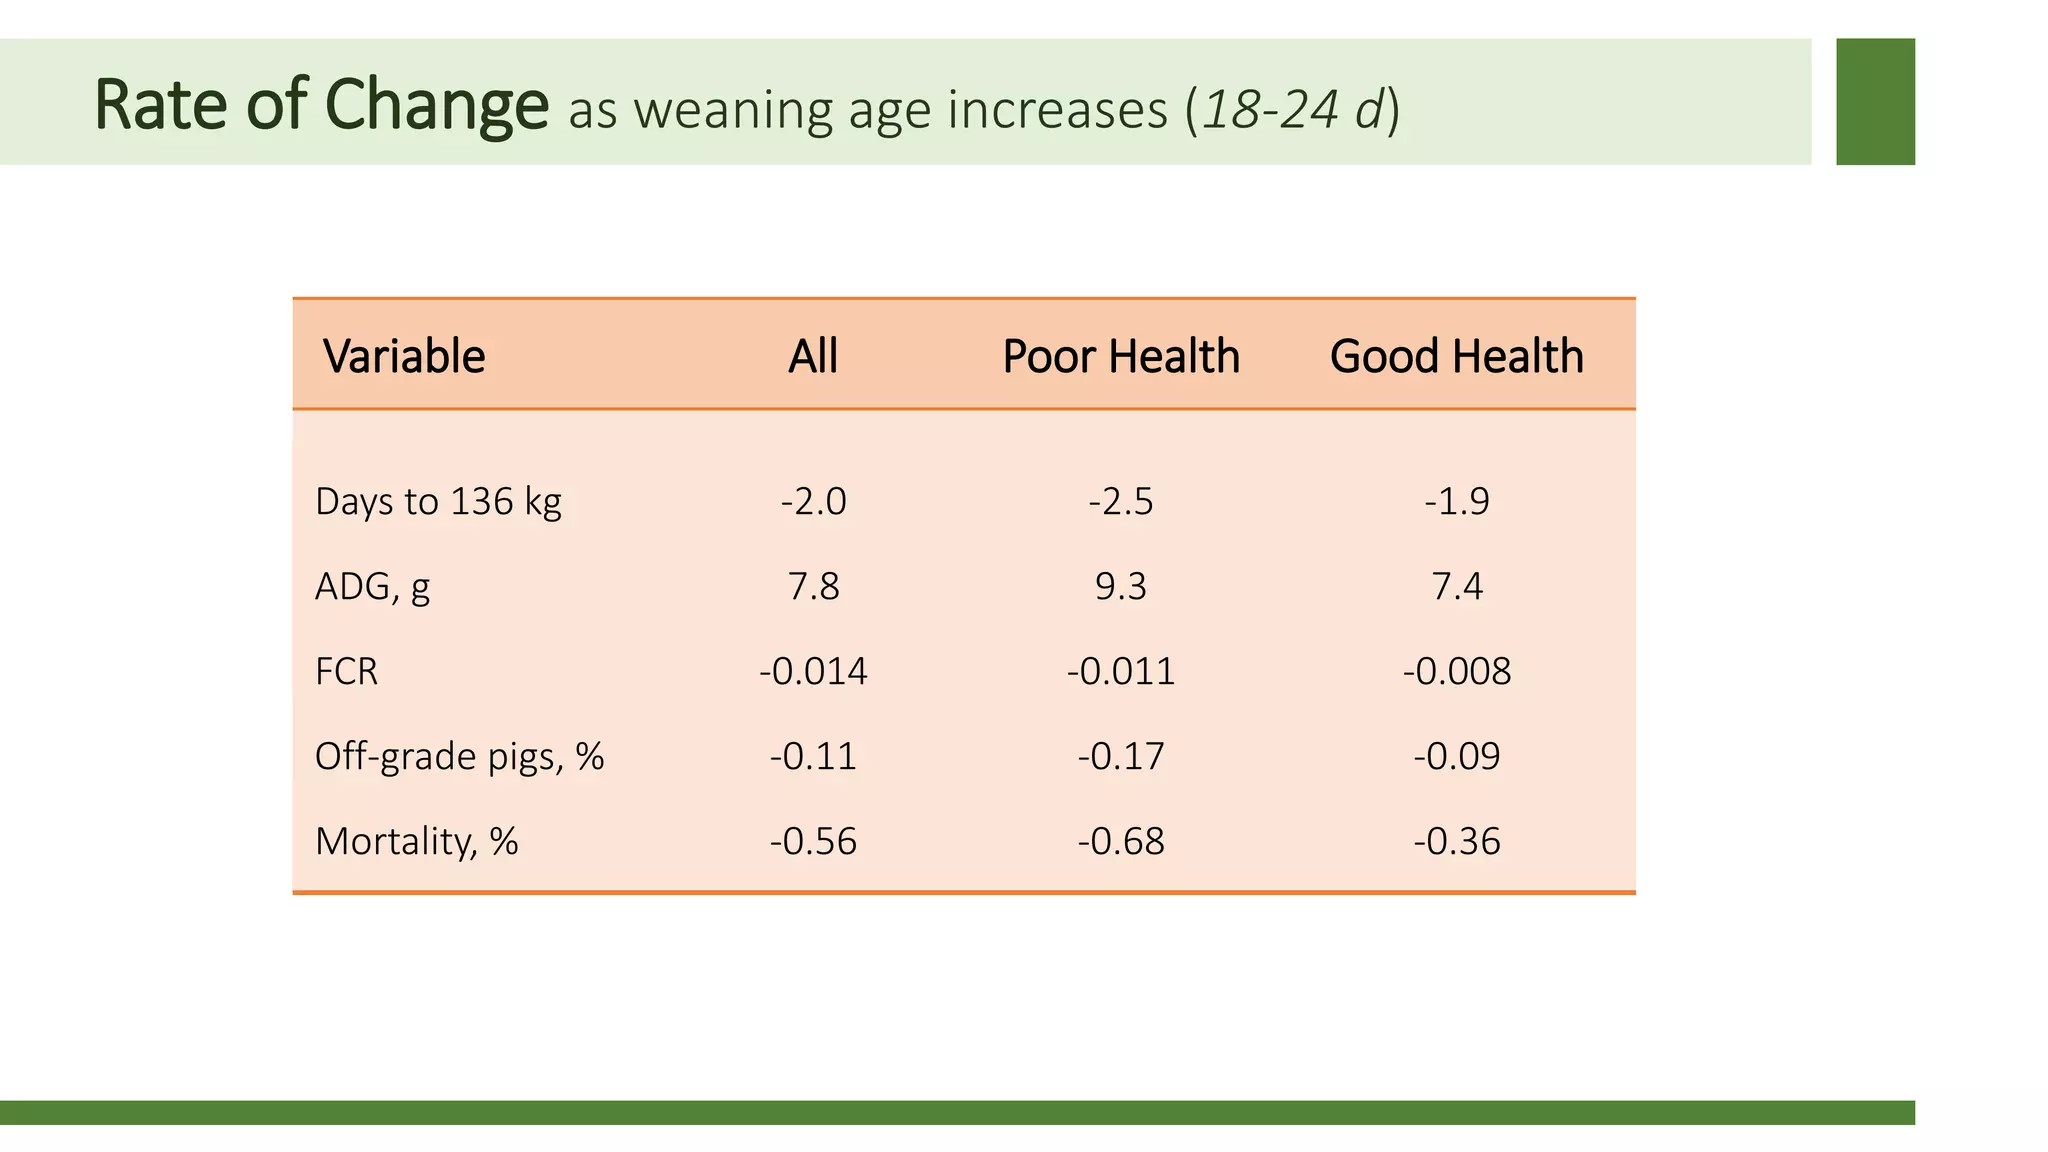


Early weaning negatively impacts pig performance through disruption of the intestinal structure, barrier function, and immune response. These impacts are exacerbated by subsequent stressors like disease challenges. A study of over 140,000 pigs across 5 years found that every additional day of weaning age from 18-24 days reduced mortality by 0.56% on average and improved average daily gain by 7.8 grams under normal health conditions. The negative effects of early weaning were more pronounced during times of poor health status on the sow farm.