Downloaded 67 times
![Protein yield example
Protein price projection = $2.48/pound
Increased feed required = $0.90/pound
Health costs = $0.09/pound
[$2.48/pound - $0.90 additional feed -
$0.09 additional health] * 2.78 lactations
= $4.14/pound
HOW IS AN INDEX VALUE DERIVED?
"Parmigiano reggiano factory". CC BY-
SA 3.0 via Wikimedia Commons](https://image.slidesharecdn.com/dechowwebinarfeb2016-160202210013/85/Sire-Selection-Considerations-for-Dairy-Producers-13-320.jpg)


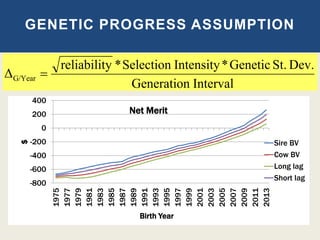
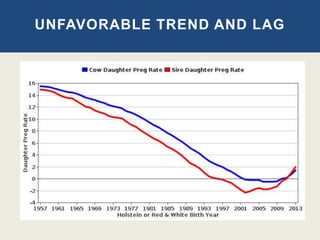
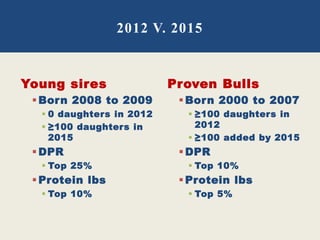
The document presents considerations for dairy producers regarding sire selection, focusing on genomic advancements and genetic progress in breeding. It discusses the evaluation of bulls across various traits, the importance of selection indices, and the matching of genetics with management systems. Key takeaways emphasize the use of good sires, the adoption of health evaluations, and the strategic matching of herd genetics to production and health goals.


![Tricomoniasis[2]](https://cdn.slidesharecdn.com/ss_thumbnails/tricomoniasis2-151111220934-lva1-app6891-thumbnail.jpg?width=640&height=640&fit=bounds)


