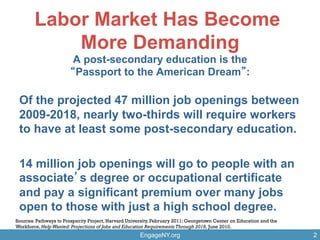
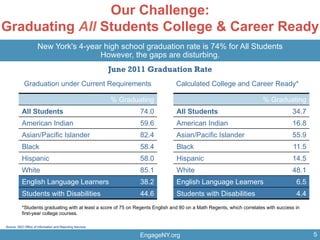
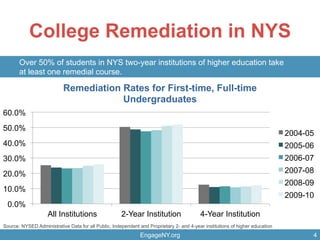
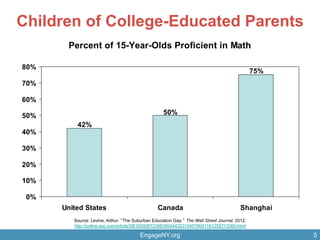
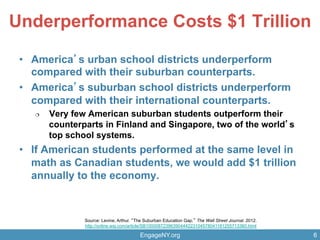
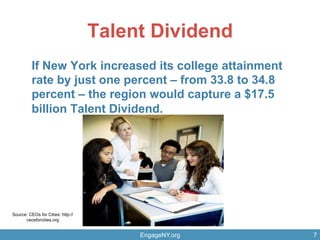
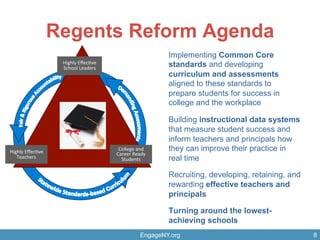
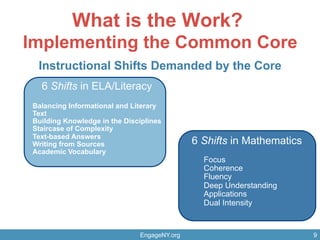
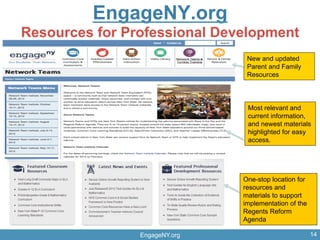
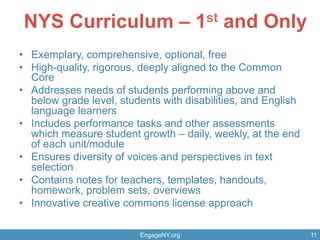
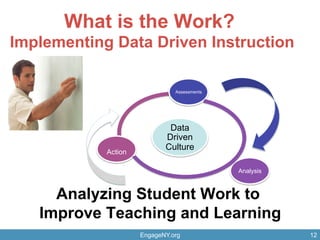
EngageNY.org
Our Challenge:
Graduating Students College & Career Ready
Dr. John B. King, Jr.
President of the University of the State of New York and
Commissioner of Education
Social Enterprise Leadership Forum at Columbia Business School
May 10, 2013
Labor Market Has Become
More Demanding
EngageNY.org 2
A post-secondary education is the
Passport to the American Dream :
Of the projected 47 million job openings between
2009-2018, nearly two-thirds will require workers
to have at least some post-secondary education.
14 million job openings will go to people with an
associate s degree or occupational certificate
and pay a significant premium over many jobs
open to those with just a high school degree.
Sources: Pathways to Prosperity Project, Harvard University, February 2011; Georgetown Center on Education and the
Workforce, HelpWanted: Projections of Jobs and Education Requirements Through 2018, June 2010.
EngageNY.org
Our Challenge:
Graduating All Students College & Career Ready
June 2011 Graduation Rate
New York's 4-year high school graduation rate is 74% for All Students
However, the gaps are disturbing.
Graduation under Current Requirements
% Graduating % Graduating
All Students 74.0 All Students 34.7
American Indian 59.6 American Indian 16.8
Asian/Pacific Islander 82.4 Asian/Pacific Islander 55.9
Black 58.4 Black 11.5
Hispanic 58.0 Hispanic 14.5
White 85.1 White 48.1
English Language Learners 38.2 English Language Learners 6.5
Students with Disabilities 44.6 Students with Disabilities 4.4
Calculated College and Career Ready*
*Students graduating with at least a score of 75 on Regents English and 80 on a Math Regents, which correlates with success in
first-year college courses.
Source: SED Office of Information and Reporting Services
5
College Remediation in NYS
EngageNY.org 4
Over 50% of students in NYS two-year institutions of higher education take
at least one remedial course.
Source: NYSED Administrative Data for all Public, Independent and Proprietary 2- and 4-year institutions of higher education
0.0%
10.0%
20.0%
30.0%
40.0%
50.0%
60.0%
All Institutions 2-Year Institution 4-Year Institution
Remediation Rates for First-time, Full-time
Undergraduates
2004-05
2005-06
2006-07
2007-08
2008-09
2009-10
EngageNY.org 5
Children of College-Educated Parents
Source: Levine, Arthur. The Suburban Education Gap. The Wall Street Journal. 2012.
http://online.wsj.com/article/SB10000872396390444223104578041181255713360.html
Percent of 15-Year-Olds Proficient in Math
42%
50%
75%
0%
10%
20%
30%
40%
50%
60%
70%
80%
United States Canada Shanghai
EngageNY.org 6
Underperformance Costs $1 Trillion
•  America s urban school districts underperform
compared with their suburban counterparts.
•  America s suburban school districts underperform
compared with their international counterparts.
¦  Very few American suburban students outperform their
counterparts in Finland and Singapore, two of the world s
top school systems.
•  If American students performed at the same level in
math as Canadian students, we would add $1 trillion
annually to the economy.
Source: Levine, Arthur. The Suburban Education Gap. The Wall Street Journal. 2012.
http://online.wsj.com/article/SB10000872396390444223104578041181255713360.html
Talent Dividend
If New York increased its college attainment
rate by just one percent – from 33.8 to 34.8
percent – the region would capture a $17.5
billion Talent Dividend.
EngageNY.org 7
Source: CEOs for Cities: http://
ceosforcities.org
Regents Reform Agenda
Implementing Common Core
standards and developing
curriculum and assessments
aligned to these standards to
prepare students for success in
college and the workplace
Building instructional data systems
that measure student success and
inform teachers and principals how
they can improve their practice in
real time
Recruiting, developing, retaining, and
rewarding effective teachers and
principals
Turning around the lowest-
achieving schools
EngageNY.org 8
College	
  and	
  
Career	
  Ready	
  
Students	


Highly	
  Effec7ve	
  
School	
  Leaders	
  
Highly	
  Effec7ve	
  	
  
Teachers	
  
What is the Work?
Implementing the Common Core
Instructional Shifts Demanded by the Core
EngageNY.org 9
6 Shifts in Mathematics
Focus
Coherence
Fluency
Deep Understanding
Applications
Dual Intensity
6 Shifts in ELA/Literacy
Balancing Informational and Literary
Text
Building Knowledge in the Disciplines
Staircase of Complexity
Text-based Answers
Writing from Sources
Academic Vocabulary
EngageNY.org
EngageNY.org
Resources for Professional Development
New and updated
Parent and Family
Resources
Most relevant and
current information,
and newest materials
highlighted for easy
access.
One-stop location for
resources and
materials to support
implementation of the
Regents Reform
Agenda
14
EngageNY.org 11
NYS Curriculum – 1st and Only
EngageNY.org 11
•  Exemplary, comprehensive, optional, free
•  High-quality, rigorous, deeply aligned to the Common
Core
•  Addresses needs of students performing above and
below grade level, students with disabilities, and English
language learners
•  Includes performance tasks and other assessments
which measure student growth – daily, weekly, at the end
of each unit/module
•  Ensures diversity of voices and perspectives in text
selection
•  Contains notes for teachers, templates, handouts,
homework, problem sets, overviews
•  Innovative creative commons license approach
What is the Work?
Implementing Data Driven Instruction
EngageNY.org 12
Data
Driven
Culture
Assessments
Analysis
Action
Analyzing Student Work to
Improve Teaching and Learning
EngageNY.org 13
High Value-Added Teachers
Result in Positive Life Outcomes
l Having a higher value-added teacher
for even one year in grades 4-8, has
substantial positive long-term impacts
on a student s life outcomes:
Ø  Likelihood of attending college (UP)
Ø  Likelihood of teen pregnancy
(DOWN)
Ø  Lifelong Income (UP)
Ø  Retirement savings (UP)
What is the Work?
Effective Teachers and Leaders
The Long-Term Impacts of Teachers:Teacher Value-added and Student Outcomes in Adulthood (Chetty, Friedman &
Rockoff). http://obs.rc.fas.harvard.edu/chetty/value_added.html
14 14
•  Great teachers help
students who are behind
academically catch up.
•  Consistent exposure to
great teachers is perhaps
even more critical.
•  Higher needs students are
less likely, in this study of
Los Angeles, to have
effective teachers,
contributing to the
achievement gap. Source: Learning Denied: The Case for Equitable Access to
Effective Teaching in California s Largest District. (The Education
Trust-West)
Teacher Effectiveness Matters
EngageNY.org 14
Teacher & Leader Evaluations: Why Change?
15
• Prior to changes in evaluation laws, most teacher
evaluations rated 97-99% of teachers satisfactory or
better
• However, 81% of administrators and 57% of teachers
said there was at least one poor performing tenured
teacher in their school
• 73% of teachers said their evaluations did not
identify any development areas and of those whose
did, 55% did not receive useful feedback on how to
improve
• 59% of Teachers and 63% of administrators say their
districts are not doing enough to identify and retain the
most effective teachers.
All statistics here from The Widget Effect,TNTP 2009
EngageNY.org 15
16
National research tells us what a
good evaluation system looks like
16
l  Use research-based observation rubrics
l  Use multiple observations per teacher ( ideally
using multiple observers)
l  Train and calibrate all observers.
l  Value-added measures are more predictive of
future student learning than other researched
measures
l  Combining observation measures, student
feedback surveys and value-added growth results
on state tests is more reliable and a better predictor
of student learning than:
Ø  Any Measure alone
Ø  Graduate degrees
Ø  Years of teaching experience
l  Combining measures is also a strong predictor of
student performance on other kinds of student
tests.
Measures of Effective Teaching Project; Bill and Melinda Gates Foundation
EngageNY.org 16
New research shows evaluations can improve a
teacher s impact on student learning results
•  In years where mid-career teachers receive
classroom observations and full
evaluations, teacher value-added improves
over previous years in math.
•  Gains in value-added persist after the
evaluation year.
Source: 2011: Taylor (Harvard) and Tyler (Brown)
EngageNY.org 17
Studies: Principal Leadership matters
•  Principals are by far the
most important school
context factor
influencing teachers
decisions to stay or
leave a school.
•  Successful school
turnarounds are highly
unlikely without an
effective school leader.
EngageNY.org
Bryk, A.S., SebringBoyd, D., Grossman, P., Ing M., Lankford H., (2011) The Influence of school administrators on teacher retention decisions. American Educational Research Journal.
, P., Allensworth, E., Luppescu, S. & Easton, J.Q. (2010). Organizing Schools for Improvement: Lessons from Chicago. Chicago, IL: The University of Chicago Press
18
Changing Roles for Principals
Leadership of Instructional change:
l  Common Core
l  Data-driven instruction
l  Evidence-based observation and
feedback to teachers
New performance-based assessment
for principal certification
Shift time away from other
administrative duties
l  Delegation
l  Time management
l  Leverage district and shared service
resources
EngageNY.org 19
Teacher and Principal Evaluation:
Building a System for Improving Student Achievement
EngageNY.org 20
Key Points about New York State Growth
Measures based on State tests:
•  We measure student growth and not absolute levels of
achievement
o  Change in student performance between two points in time.
•  We measure growth compared to similar students
o  Similar students: Up to three years of the same prior achievement, three
student-level characteristics in 2011-12 (poverty, disability and ELL status)
Every educator has a fair chance to demonstrate
effectiveness on these measures regardless of the
composition of his/her class or school.
EngageNY.org 21
22
ELAScaleScore
2011 2012
If we compare student
A s current score to
other students who had
the same prior score
(450), we can measure
her growth relative to
other students. We
describe her growth as
a student growth
percentile (SGP ).
Student A s SGP is 40,
meaning she performed
better in the current
year than 40 percent of
similar students.	


Student A s Current Year Performance
Compared to Similar Students
EngageNY.org 22
Growth Score
Rating
2011-12
Percent of
Teacher MGPs
(Grades 4-8,
ELA/Math)
Percent of
Principal
MGPs
(Grades 4-8)
Highly Effective 7% 6%
Effective 77% 79%
Developing 10% 8%
Ineffective 6% 7%
We expect 2012-13 growth score rating
distribution to be similar to 2011-12
23EngageNY.org 23
Measuring Growth in the Non-Tested
Subjects: Student Learning Objectives
EngageNY.org 24
Represents the most important
learning for the year (or, semester,
where applicable).
Based on available prior student
learning data.
Specific and measurable.
Aligned to Common Core, State, or
national standards, as well as any
other district and school priorities.
A Student Learning Objective
(SLO) is an academic goal for a
teacher’s students set at the
start of a course.
Locally-Selected Measures
•  Growth and local measures must be different
from one another
•  Locally selected-measures create an opportunity
to complement state growth by providing a
different lens for assessing student learning
(e.g., more performance-based assessment)
•  Districts and bargaining units should evaluate
their locally-selected measures against the
Common Core Standards and the instructional
shifts they require (e.g., do the assessments
provide more opportunities for students to write
from sources?)
EngageNY.org 25
Examples of Locally-Selected Measures
for Teachers
•  The district has prioritized expository writing and
STEM, and has identified a critical need to focus
academic interventions in these areas.
4th Grade Common
Branch Teachers
7th Grade Science
Teachers
School Librarians
% of 4th grade students
earning scores at the
proficient level (three) or
better performance level
on the 4th grade State
Science assessment
% of 7th grade science
students who demonstrate
growth of at least one level
higher than their baseline
analytical writing sample, as
measured by the district-
developed 7th grade science
writing assessment rubric.
School-wide growth based
on State-provided school-
wide growth scores for all
students in the school
taking the State ELA
assessment in grades 4-8.
EngageNY.org 26
27
APPR teacher practice rubrics
reinforce Common Core
27
Common
Core
Content Common
Core
Pedagogy
EngageNY.org 27
Evidence Collection Tools
EngageNY.org 28
Ideal for evidence
based feedback on
practice
• peer observations
• informal supervisory
observations
• learning walks
Capturing evidence of the shifts in practice in each of our classrooms
to better ensure that each of our teachers and principals has a deep
understanding of the shifts demanded by the Common Core
New York is changing teacher preparation
by overhauling teacher certification:
•  Through new certification exams, every teacher will
demonstrate:
¦  Common Core literacy skills
¦  More advanced content knowledge in their chosen subject
¦  Understanding of the needs of English Language Learners,
Students with Disabilities and other students with special
needs
•  And every teacher will show they can plan and deliver
effective classroom instruction through a new
portfolio assessment of teaching skills in action.
EngageNY.org 29
Raising the Bar for Teacher and Leader
Preparation, Certification and Licensure
EngageNY.org
New and Revised Assessments for
Teacher Certification
Teacher Performance Assessment
(edTPA) *NEW
Educating All Students *NEW
Academic Literacy Skills Test *NEW
Revised Content Specialty Test
New and Revised Assessments
for School Building Leaders
School Building Leader
(2 part) performance-based
certification examination *NEW
Educating All Students) *NEW
30
EngageNY.org
Thank You.
Follow me on Twitter:
@JohnKingNYSED

Keynote Address

  • 1.
    EngageNY.org Our Challenge: Graduating StudentsCollege & Career Ready Dr. John B. King, Jr. President of the University of the State of New York and Commissioner of Education Social Enterprise Leadership Forum at Columbia Business School May 10, 2013
  • 2.
    Labor Market HasBecome More Demanding EngageNY.org 2 A post-secondary education is the Passport to the American Dream : Of the projected 47 million job openings between 2009-2018, nearly two-thirds will require workers to have at least some post-secondary education. 14 million job openings will go to people with an associate s degree or occupational certificate and pay a significant premium over many jobs open to those with just a high school degree. Sources: Pathways to Prosperity Project, Harvard University, February 2011; Georgetown Center on Education and the Workforce, HelpWanted: Projections of Jobs and Education Requirements Through 2018, June 2010.
  • 3.
    EngageNY.org Our Challenge: Graduating AllStudents College & Career Ready June 2011 Graduation Rate New York's 4-year high school graduation rate is 74% for All Students However, the gaps are disturbing. Graduation under Current Requirements % Graduating % Graduating All Students 74.0 All Students 34.7 American Indian 59.6 American Indian 16.8 Asian/Pacific Islander 82.4 Asian/Pacific Islander 55.9 Black 58.4 Black 11.5 Hispanic 58.0 Hispanic 14.5 White 85.1 White 48.1 English Language Learners 38.2 English Language Learners 6.5 Students with Disabilities 44.6 Students with Disabilities 4.4 Calculated College and Career Ready* *Students graduating with at least a score of 75 on Regents English and 80 on a Math Regents, which correlates with success in first-year college courses. Source: SED Office of Information and Reporting Services 5
  • 4.
    College Remediation inNYS EngageNY.org 4 Over 50% of students in NYS two-year institutions of higher education take at least one remedial course. Source: NYSED Administrative Data for all Public, Independent and Proprietary 2- and 4-year institutions of higher education 0.0% 10.0% 20.0% 30.0% 40.0% 50.0% 60.0% All Institutions 2-Year Institution 4-Year Institution Remediation Rates for First-time, Full-time Undergraduates 2004-05 2005-06 2006-07 2007-08 2008-09 2009-10
  • 5.
    EngageNY.org 5 Children ofCollege-Educated Parents Source: Levine, Arthur. The Suburban Education Gap. The Wall Street Journal. 2012. http://online.wsj.com/article/SB10000872396390444223104578041181255713360.html Percent of 15-Year-Olds Proficient in Math 42% 50% 75% 0% 10% 20% 30% 40% 50% 60% 70% 80% United States Canada Shanghai
  • 6.
    EngageNY.org 6 Underperformance Costs$1 Trillion •  America s urban school districts underperform compared with their suburban counterparts. •  America s suburban school districts underperform compared with their international counterparts. ¦  Very few American suburban students outperform their counterparts in Finland and Singapore, two of the world s top school systems. •  If American students performed at the same level in math as Canadian students, we would add $1 trillion annually to the economy. Source: Levine, Arthur. The Suburban Education Gap. The Wall Street Journal. 2012. http://online.wsj.com/article/SB10000872396390444223104578041181255713360.html
  • 7.
    Talent Dividend If NewYork increased its college attainment rate by just one percent – from 33.8 to 34.8 percent – the region would capture a $17.5 billion Talent Dividend. EngageNY.org 7 Source: CEOs for Cities: http:// ceosforcities.org
  • 8.
    Regents Reform Agenda ImplementingCommon Core standards and developing curriculum and assessments aligned to these standards to prepare students for success in college and the workplace Building instructional data systems that measure student success and inform teachers and principals how they can improve their practice in real time Recruiting, developing, retaining, and rewarding effective teachers and principals Turning around the lowest- achieving schools EngageNY.org 8 College  and   Career  Ready   Students     Highly  Effec7ve   School  Leaders   Highly  Effec7ve     Teachers  
  • 9.
    What is theWork? Implementing the Common Core Instructional Shifts Demanded by the Core EngageNY.org 9 6 Shifts in Mathematics Focus Coherence Fluency Deep Understanding Applications Dual Intensity 6 Shifts in ELA/Literacy Balancing Informational and Literary Text Building Knowledge in the Disciplines Staircase of Complexity Text-based Answers Writing from Sources Academic Vocabulary
  • 10.
    EngageNY.org EngageNY.org Resources for ProfessionalDevelopment New and updated Parent and Family Resources Most relevant and current information, and newest materials highlighted for easy access. One-stop location for resources and materials to support implementation of the Regents Reform Agenda 14
  • 11.
    EngageNY.org 11 NYS Curriculum– 1st and Only EngageNY.org 11 •  Exemplary, comprehensive, optional, free •  High-quality, rigorous, deeply aligned to the Common Core •  Addresses needs of students performing above and below grade level, students with disabilities, and English language learners •  Includes performance tasks and other assessments which measure student growth – daily, weekly, at the end of each unit/module •  Ensures diversity of voices and perspectives in text selection •  Contains notes for teachers, templates, handouts, homework, problem sets, overviews •  Innovative creative commons license approach
  • 12.
    What is theWork? Implementing Data Driven Instruction EngageNY.org 12 Data Driven Culture Assessments Analysis Action Analyzing Student Work to Improve Teaching and Learning
  • 13.
    EngageNY.org 13 High Value-AddedTeachers Result in Positive Life Outcomes l Having a higher value-added teacher for even one year in grades 4-8, has substantial positive long-term impacts on a student s life outcomes: Ø  Likelihood of attending college (UP) Ø  Likelihood of teen pregnancy (DOWN) Ø  Lifelong Income (UP) Ø  Retirement savings (UP) What is the Work? Effective Teachers and Leaders The Long-Term Impacts of Teachers:Teacher Value-added and Student Outcomes in Adulthood (Chetty, Friedman & Rockoff). http://obs.rc.fas.harvard.edu/chetty/value_added.html
  • 14.
    14 14 •  Greatteachers help students who are behind academically catch up. •  Consistent exposure to great teachers is perhaps even more critical. •  Higher needs students are less likely, in this study of Los Angeles, to have effective teachers, contributing to the achievement gap. Source: Learning Denied: The Case for Equitable Access to Effective Teaching in California s Largest District. (The Education Trust-West) Teacher Effectiveness Matters EngageNY.org 14
  • 15.
    Teacher & LeaderEvaluations: Why Change? 15 • Prior to changes in evaluation laws, most teacher evaluations rated 97-99% of teachers satisfactory or better • However, 81% of administrators and 57% of teachers said there was at least one poor performing tenured teacher in their school • 73% of teachers said their evaluations did not identify any development areas and of those whose did, 55% did not receive useful feedback on how to improve • 59% of Teachers and 63% of administrators say their districts are not doing enough to identify and retain the most effective teachers. All statistics here from The Widget Effect,TNTP 2009 EngageNY.org 15
  • 16.
    16 National research tellsus what a good evaluation system looks like 16 l  Use research-based observation rubrics l  Use multiple observations per teacher ( ideally using multiple observers) l  Train and calibrate all observers. l  Value-added measures are more predictive of future student learning than other researched measures l  Combining observation measures, student feedback surveys and value-added growth results on state tests is more reliable and a better predictor of student learning than: Ø  Any Measure alone Ø  Graduate degrees Ø  Years of teaching experience l  Combining measures is also a strong predictor of student performance on other kinds of student tests. Measures of Effective Teaching Project; Bill and Melinda Gates Foundation EngageNY.org 16
  • 17.
    New research showsevaluations can improve a teacher s impact on student learning results •  In years where mid-career teachers receive classroom observations and full evaluations, teacher value-added improves over previous years in math. •  Gains in value-added persist after the evaluation year. Source: 2011: Taylor (Harvard) and Tyler (Brown) EngageNY.org 17
  • 18.
    Studies: Principal Leadershipmatters •  Principals are by far the most important school context factor influencing teachers decisions to stay or leave a school. •  Successful school turnarounds are highly unlikely without an effective school leader. EngageNY.org Bryk, A.S., SebringBoyd, D., Grossman, P., Ing M., Lankford H., (2011) The Influence of school administrators on teacher retention decisions. American Educational Research Journal. , P., Allensworth, E., Luppescu, S. & Easton, J.Q. (2010). Organizing Schools for Improvement: Lessons from Chicago. Chicago, IL: The University of Chicago Press 18
  • 19.
    Changing Roles forPrincipals Leadership of Instructional change: l  Common Core l  Data-driven instruction l  Evidence-based observation and feedback to teachers New performance-based assessment for principal certification Shift time away from other administrative duties l  Delegation l  Time management l  Leverage district and shared service resources EngageNY.org 19
  • 20.
    Teacher and PrincipalEvaluation: Building a System for Improving Student Achievement EngageNY.org 20
  • 21.
    Key Points aboutNew York State Growth Measures based on State tests: •  We measure student growth and not absolute levels of achievement o  Change in student performance between two points in time. •  We measure growth compared to similar students o  Similar students: Up to three years of the same prior achievement, three student-level characteristics in 2011-12 (poverty, disability and ELL status) Every educator has a fair chance to demonstrate effectiveness on these measures regardless of the composition of his/her class or school. EngageNY.org 21
  • 22.
    22 ELAScaleScore 2011 2012 If wecompare student A s current score to other students who had the same prior score (450), we can measure her growth relative to other students. We describe her growth as a student growth percentile (SGP ). Student A s SGP is 40, meaning she performed better in the current year than 40 percent of similar students.       Student A s Current Year Performance Compared to Similar Students EngageNY.org 22
  • 23.
    Growth Score Rating 2011-12 Percent of TeacherMGPs (Grades 4-8, ELA/Math) Percent of Principal MGPs (Grades 4-8) Highly Effective 7% 6% Effective 77% 79% Developing 10% 8% Ineffective 6% 7% We expect 2012-13 growth score rating distribution to be similar to 2011-12 23EngageNY.org 23
  • 24.
    Measuring Growth inthe Non-Tested Subjects: Student Learning Objectives EngageNY.org 24 Represents the most important learning for the year (or, semester, where applicable). Based on available prior student learning data. Specific and measurable. Aligned to Common Core, State, or national standards, as well as any other district and school priorities. A Student Learning Objective (SLO) is an academic goal for a teacher’s students set at the start of a course.
  • 25.
    Locally-Selected Measures •  Growthand local measures must be different from one another •  Locally selected-measures create an opportunity to complement state growth by providing a different lens for assessing student learning (e.g., more performance-based assessment) •  Districts and bargaining units should evaluate their locally-selected measures against the Common Core Standards and the instructional shifts they require (e.g., do the assessments provide more opportunities for students to write from sources?) EngageNY.org 25
  • 26.
    Examples of Locally-SelectedMeasures for Teachers •  The district has prioritized expository writing and STEM, and has identified a critical need to focus academic interventions in these areas. 4th Grade Common Branch Teachers 7th Grade Science Teachers School Librarians % of 4th grade students earning scores at the proficient level (three) or better performance level on the 4th grade State Science assessment % of 7th grade science students who demonstrate growth of at least one level higher than their baseline analytical writing sample, as measured by the district- developed 7th grade science writing assessment rubric. School-wide growth based on State-provided school- wide growth scores for all students in the school taking the State ELA assessment in grades 4-8. EngageNY.org 26
  • 27.
    27 APPR teacher practicerubrics reinforce Common Core 27 Common Core Content Common Core Pedagogy EngageNY.org 27
  • 28.
    Evidence Collection Tools EngageNY.org28 Ideal for evidence based feedback on practice • peer observations • informal supervisory observations • learning walks Capturing evidence of the shifts in practice in each of our classrooms to better ensure that each of our teachers and principals has a deep understanding of the shifts demanded by the Common Core
  • 29.
    New York ischanging teacher preparation by overhauling teacher certification: •  Through new certification exams, every teacher will demonstrate: ¦  Common Core literacy skills ¦  More advanced content knowledge in their chosen subject ¦  Understanding of the needs of English Language Learners, Students with Disabilities and other students with special needs •  And every teacher will show they can plan and deliver effective classroom instruction through a new portfolio assessment of teaching skills in action. EngageNY.org 29
  • 30.
    Raising the Barfor Teacher and Leader Preparation, Certification and Licensure EngageNY.org New and Revised Assessments for Teacher Certification Teacher Performance Assessment (edTPA) *NEW Educating All Students *NEW Academic Literacy Skills Test *NEW Revised Content Specialty Test New and Revised Assessments for School Building Leaders School Building Leader (2 part) performance-based certification examination *NEW Educating All Students) *NEW 30
  • 31.
    EngageNY.org Thank You. Follow meon Twitter: @JohnKingNYSED