Logistics

The document discusses India's logistics sector and opportunities for growth. It notes that India's current logistics network is insufficient to support expected GDP growth. Key points discussed include: 1) Implementation of GST and development of dedicated freight corridors and industrial corridors will help rationalize the logistics network and increase the market share of rail freight. 2) Container trade is expected to continue growing faster than GDP, benefiting logistics companies involved in container movement. 3) Private container train operators stand to benefit from improvements in the rail network through initiatives like DFCC and multimodal logistics parks. 4) The government is focusing on reviving coastal and inland water transport to reduce logistics costs and ease

Recommended
More Related Content
What's hot
What's hot (20)
Similar to Logistics
Similar to Logistics (20)
Recently uploaded
Recently uploaded (20)
Logistics
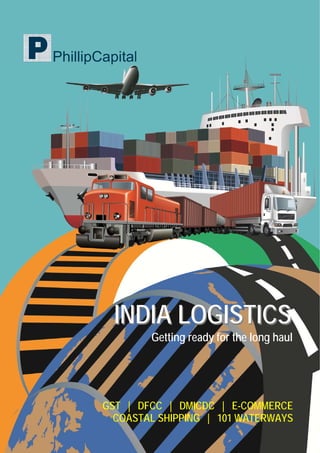
- 1. INDIA LOGISTICS Getting ready for the long haul GST | DFCC | DMICDC | E-COMMERCE COASTAL SHIPPING | 101 WATERWAYS INDIA LOGISTICS
- 2. INSTITUTIONAL EQUITY RESEARCH Page | 3 | PHILLIPCAPITAL INDIA RESEARCH India Logistics Getting ready for the long haul INDIA | LOGISTICS| Sector Update 8 August 2016 Why read this report? • India’s logistics network is insufficient to support expected GDP growth of +8% and would require overhauling rather than incremental change. • Road and rail transport is under severe pressure while water transport is not developed. Logistics is the backbone of economic growth and investments in road, rail, and waterways are critical to maintain smooth and efficient movement of goods. • With policy support, the significant reorientation of cargo towards rail and coastal shipping, which are more economical than road. • Logistics stocks have already outperformed with significant rerating in earnings multiples. However, we believe the sector still offers great investment opportunities over the long term. Along with higher growth, logistics players will also see improvement in return ratios because of capital efficiency. • We maintain BUY on Allcargo while initiating coverage on Navkar and Gateway Distriparks with a BUY recommendation. GST implementation to rationalise tax structure As a result of the new GST tax model, individual state administrative borders are likely to become irrelevant for most industries, driving rationalization of logistics operations and infrastructure. Major changes after GST: (1) consolidation of warehouses, (2) improved efficiencies due to reduction of trade barriers, (3) revaluation of sourcing and manufacturing decisions, and (4) growth in free‐trade warehousing (FTWZ) and multimodal logistics parks (MMLP). Changing dynamics of the retail industry have shifted focus to the consumer from the supplier – delivering products in less time is gaining importance. Container trade to witness secular growth Container cargo now constitutes 20% of total cargo at major ports from 14% in 2004. Container traffic has remained one of the highest growing cargoes in India historically; we see it continuing to grow at a GDP multiplier of around 1.5x and the shift to containerisation from bulk cargo to persist. Logistic players – Concor, Allcargo, and Gateway – with businessess related to container movement and trade, are uniquely placed to benefit from growing international trade. DFCC: Private container train operators to benefit Dedicated freight corridors (DFCs) and industrial corridors will strengthen India’s logistic network infrastructure. Development of DFCs would result in enhancing the market share of rail freight as this is a more efficient, safe, and economical option. DMICDC and multimodal logistics parks (with common user facilities) will give a good chance to private container rail operators to expand businesses with a level playing field. The container train operators will benefit significantly with (1) an improvement in the rail network, (2) increase in asset turnaround, and (3) rationalisation of haulage charges. Revival of coastal and inland water Coastal shipping accounts for less than 6% of total domestic freight movement, even though it is approximately 60% more economical, safer, and less polluting than road transport. The government plans to lower India’s logistics costs (as % of GDP) to around 9‐10% from current 13%. To do this, it plans (1) significant investment in waterways, (2) to provide an enabling environment, and (3) to focus on developing waterways with institutional arrangements. This fits in nicely with the government’s mission of a ‘clean India’ and ‘Make in India’ besides reducing cost of transportation, accidents, and environmental pollution. Companies Navkar Corporation Reco BUY CMP, Rs 205 Target Price, Rs 288 Gateway Distriparks Reco BUY CMP, Rs 272 Target Price, Rs 363 Container Corporation of India Reco Neutral CMP, Rs 1435 Target Price, Rs 1530 Allcargo Logistics Reco BUY CMP, Rs 186 Target Price, Rs 200 VRL Logistics Reco SELL CMP, Rs 312 Target Price, Rs 316 Aegis Logistics Reco NOT RATED CMP, Rs 122 Blue Dart Reco NOT RATED CMP, Rs 5,680 Transport Corporation of India Reco NOT RATED CMP, Rs 355 Gati Ltd Reco NOT RATED CMP, Rs 164 Snow man Logistics Reco NOT RATED CMP, Rs 73 Sical Logistics Reco NOT RATED CMP, Rs 154 Vikram Suryavanshi (+ 9122 6667 9951) vsuryavanshi@phillipcapital.in
- 3. Page | 4 | PHILLIPCAPITAL INDIA RESEARCH INDIA LOGISTICS SECTOR UPDATE INDEX Indian logistics overview .................................................................. 5 Sector Performance: Significant re‐rating, will it sustain? ............. 8 Where does India stand in the logistics space? .............................. 9 Growth drivers for the logistics sector ........................................... 12 Key opportunities emerging in the Indian logistic space ................ 19 Annexure: Technological impact on truck transport ..................... 26 Companies Section Navkar Corporation ................................................................................... 28 Gateway Distriparks ................................................................................... 39 Container Corporation ............................................................................... 47 Allcargo Logistics ........................................................................................ 49 VRL Logistics ................................................................................................ 51 Aegis Logistics ............................................................................................ 53 Blue Dart .................................................................................................... 55 Transport Corporation of India ................................................................... 57 Gati .............................................................................................................. 59 Snowman Logistics ...................................................................................... 61 Sical Logistics .............................................................................................. 63
- 4. Page | 5 | PHILLIPCAPITAL INDIA RESEARCH INDIA LOGISTICS SECTOR UPDATE Indian logistics overview Operationally, logistics is mainly divided into transportation, storage and warehousing, and distribution. Currently, India uses road transport more extensively vs. rail and waterways, thereby increasing cost of transportation. In storage and distribution, contribution of third party logistics (3PL) activity is significantly lower and major focus is on freight forwarding. TTrraannssppoorrttaattiioonn SSttoorraaggee DDiissttrriibbuuttiioonn RRooaadd RRaaiill AAiirr WWaatteerr //SSeeaa GGooddoowwnn IInnllaanndd ccoonnttaaiinneerr ddeeppoott ((IICCDD)) BBoonnddeedd wwaarreehhoouussee CCoolldd ssttoorraaggee wwaarreehhoouussee 33PPLL wwaarreehhoouussee SSttoocckk‐‐kkeeeeppiinngg uunniittss EExxpprreessss ddiissttrriibbuuttiioonn UUnnoorrggaanniisseedd;; mmaaiinnllyy tthhrroouugghh ssmmaallll ccaarrrriieerrss India mostly uses the costliest mode of transport – roads Modal mix Cost per tonne per km (Rs) Logistics is driven by basic need of transportation & storage In India rail passengers are subsidiesed Source: Industry, World Bank, PhillipCapital India Research Railway 33% Road 60% Coastal 6% Air 1% 0.0 0.2 0.4 0.6 0.8 1.0 1.2 1.4 1.6 Railway Road Coastal Transportatio n 61% Warehousing 25% Freight forwarding 10% Value added logistics 4% 0 1 2 3 4 5 6 Passenger Service Yield US Cents / Passenger‐KM at nominal prices Freight Yield US Cents/ Total Tonne‐KM at nominal prices India China Russia
- 5. Page | 6 | PHILLIPCAPITAL INDIA RESEARCH INDIA LOGISTICS SECTOR UPDATE Typical flow of material: Multimodal logistics for exim containers W/H: Warehouse, CHA: Custom house agent, CFS: Container freight station, ICD: Inland Container Depot Leading logistics players’ business profile Road Transport Container Rail Express Logistics Coastal Shipping NVOCC CFS FTWZ Cold Chain Project Engineering Equipment leasing 3PL Blue Dart Concor Allcargo Navkar Gateway Arshiya In VRL TCI Gati Aegis Sical Snowman Patel Int. Source: Company, Bloomberg, PhillipCapital India Research Estimates (Note: Based on material revenue contribution)
- 6. Page | 7 | PHILLIPCAPITAL INDIA RESEARCH INDIA LOGISTICS SECTOR UPDATE Key Financials Company Blue Dart Concor Allcargo Navkar Gateway VRL TCI Gati Aegis Sical Pate Snowman MCap (Rs mn) 134,786 279,825 46,872 29,233 29,566 28,467 27,005 14,386 40,748 8,562 1,667 12,191 EV (Rs mn) 135,936 254,182 51,470 31,812 30,257 32,819 30,375 18,601 41,711 19,813 2,106 13,432 P/E (x) FY16 69.9 35.5 16.9 26.2 27.0 27.8 33.1 39.3 36.0 60.2 20.1 59.2 FY17 72.0 28.0 14.5 19.0 25.0 25.6 31.0 31.1 32.3 30.4 16.5 106.6 FY18 59.4 22.6 11.2 12.8 15.6 19.8 24.8 23.1 24.1 21.2 10.7 68.0 P/B (x) FY16 33.5 3.5 2.1 2.2 3.1 5.5 3.9 3.0 8.8 3.1 1.6 2.8 FY17 26.8 3.1 1.9 2.0 3.0 5.0 3.8 2.9 7.7 2.9 1.5 2.8 FY18 21.4 2.8 1.7 1.8 2.8 4.4 3.4 2.7 6.6 2.6 1.4 2.7 EV/EBITDA FY16 35.6 25.7 5.0 21.2 13.9 11.7 15.4 14.2 22.5 18.4 9.3 26.3 FY17 35.2 20.0 8.2 12.1 14.2 11.0 13.3 12.4 18.8 15.2 8.3 22.6 FY18 30.7 15.0 6.5 8.8 10.4 9.1 11.6 10.6 14.7 12.7 6.3 18.0 P/Cash EPS (x) FY16 49.0 24.3 10.9 22.3 15.6 14.8 19.2 19.2 29.8 13.7 13.5 23.9 FY17 47.6 20.2 9.7 14.9 14.9 13.7 16.6 16.6 25.9 11.4 9.5 23.4 FY18 40.1 16.0 7.7 10.7 10.5 11.6 14.0 13.7 19.9 9.3 6.4 19.6 RocE (%) FY16 40.5 12.7 13.1 8.1 12.5 20.0 13.1 9.2 22.4 4.1 12.2 4.7 FY17 35.1 14.1 13.6 12.4 11.8 20.3 13.3 10.3 22.3 5.4 13.1 5.9 FY18 41.9 15.9 15.8 16.0 16.5 24.8 14.4 11.5 24.7 6.3 16.0 6.6 D/E (x) FY16 1.0 0.0 0.2 0.4 0.2 0.6 0.6 0.9 0.4 4.3 0.6 0.3 FY17 0.8 0.0 0.3 0.3 0.2 0.5 0.7 0.9 0.5 4.0 0.6 0.5 FY18 0.4 0.0 0.2 0.2 0.2 0.4 0.6 0.8 0.4 3.7 0.6 0.7 Key Financials (Rs mn) Revenue FY16 25645 57426 56879 3473 10509 17225 25214 16671 22132 8352 5114 2401 FY17 26674 65834 62738 6850 11218 18616 27182 19113 37694 9396 5616 2201 FY18 29341 78388 71439 8960 12862 20802 30380 21800 45404 10631 6179 2720 EBITDA FY16 3817 10815 5220 1501 2487 2677 1968 1309 1853 1078 217 507 FY17 3859 13543 6201 2693 2470 2800 2280 1495 2218 1300 257 641 FY18 4427 17591 7566 3597 3382 3318 2618 1746 2845 1566 343 809 PAT FY16 1928 7876 2783 1117 1096 1023 816 366 1133 142 84 206 FY17 1872 9978 3238 1542 1181 1111 872 463 1260 282 102 132 FY18 2268 12360 4193 2276 1893 1440 1089 623 1691 403 157 175 Capital Employed FY16 8150 83484 28184 19103 15082 9212 11078 11630 7600 18261 1740 5351 FY17 9165 93351 33586 19170 16151 9436 12003 12126 9037 18516 1830 6104 FY18 8772 102413 36040 20624 17148 9745 12958 12759 10529 19400 2022 7204 Source: Company, Bloomberg, PhillipCapital India Research Estimates
- 7. Page | 8 | PHILLIPCAPITAL INDIA RESEARCH INDIA LOGISTICS SECTOR UPDATE Significant sector rerating; will it sustain? Logistics stocks have been rising since 2014 on broader hopes of GST and an economic recovery. However, their performance was mainly driven by a rerating in their earnings multiples (see charts below). Concor and Gateway are trading at ~97% and 70% premium to their historical average PEs of 18x and 17x respectively while Allcargo is close to its average PE multiple of 16x. Container Corporation price performance P/E trailing 12 months Allcargo Logistics price performance... ...P/E trailing 12 months Gateway Distriparks price performance... ...P/E trailing 12 months Source: Ace Equity, PhillipCapital India Research 0 200 400 600 800 1000 1200 1400 1600 1800 2000 CCRI IN Equity 0 5 10 15 20 25 30 35 40 Apr‐03 Apr‐04 Apr‐05 Apr‐06 Apr‐07 Apr‐08 Apr‐09 Apr‐10 Apr‐11 Apr‐12 Apr‐13 Apr‐14 Apr‐15 Apr‐16 PE TTM (RHS) average ~97% premium to historical PE multiple 0 50 100 150 200 250 AGLL IN Equity 0 10 20 30 40 50 60 Jun‐06 Jan‐07 Aug‐07 Mar‐08 Oct‐08 May‐09 Dec‐09 Jul‐10 Feb‐11 Sep‐11 Apr‐12 Nov‐12 Jun‐13 Jan‐14 Aug‐14 Mar‐15 Oct‐15 May‐16 Allcargo average Trading at close to average multiple 0 100 200 300 400 500 GDPL IN Equity 0 5 10 15 20 25 30 35 40 Mar‐06 Oct‐06 May‐07 Dec‐07 Jul‐08 Feb‐09 Sep‐09 Apr‐10 Nov‐10 Jun‐11 Jan‐12 Aug‐12 Mar‐13 Oct‐13 May‐14 Dec‐14 Jul‐15 Feb‐16 Gateway average ~70% premium to historical PE multiple 0
- 8. Page | 9 | PHILLIPCAPITAL INDIA RESEARCH INDIA LOGISTICS SECTOR UPDATE Where does India stand in the logistics space? Lots of opportunities, but quite behind in terms of service level and value add India is burdened with high logistics costs – about 15% of the value of goods compared to 6‐8% in other developed/developing countries. India’s average cost to export or import one container is about 72% higher than China’s (direct cost comparison). India is unique in both the opportunities and challenges that it presents in logistics. Inadequate infrastructure has resulted in an inefficient logistics network created using smaller warehouses to save on state taxes, resulting in higher costs and increased inventory levels for companies. Third‐party logistics outsourcing is at nascent stage, but provides growth opportunities for organised players. We believe India has a long way to go to in bringing in an efficient modal shift in cargo transportation and improving the supply chain. Logistics growth life cycle India logistics performance vs. China Source: World Bank database 0 1 2 3 4 LPI Score Customs Infrastructure International shipments Logistics competence Tracking & tracing Timeliness China India Inadequate infrastructure has resulted in an inefficient logistics network, created using smaller warehouses to save on state taxes
- 9. Page | 10 | PHILLIPCAPITAL INDIA RESEARCH INDIA LOGISTICS SECTOR UPDATE Due to its insufficient infrastructure, India ranks 32nd on global competitiveness. Within BRICS economies, India is below South Africa (20) and China (27), while it is above Brazil (55) and Russia (99). Roads dominate – making up for about 60% of total freight traffic. Rail/coastal shipping account for about 33%/6%, while inland waterways transportation and air is less than 1% each. Logistics costs (% of GDP) in China are higher than India due to higher share of manufacturing. India logistics compared to USA and China USA China India Logistics Performance index (LPI 2016) Score:3.99 (Rank 10 /160) Score: 3.66 (Rank 27/160) Score: 3.45 (Rank 35/160) Agricultural GDP % 1.2 10.1 17.0 Industry DGP % 19.1 46.9 18.0 Service GDP % 79.7 43.0 65.0 Logistics spent as % of GDP 8.5 18.0 14.0 Warehousing as % of GDP 2.8 8.1 4.1 Total container handled (mn TEU) 43.0 180.0 12.0 Road network (mn km) 6.5 4.0 4.8 Rail network (km) 2,40,000 1,00,000 65,000 Coast line (Km) 19,924 14,500 7,500 Source: World Bank, Industry, PhillipCapital Rail network: Lots needs to be done Indian rail network is fourth largest after the US, China, and Russia. It is the largest passenger carrier in the world. India has historically had sub‐optimal investment in transportation. In the last 64 years, freight loading has grown by 1344% and passenger kilometres by 1642%, while railway capacity (route kilometres) have grown by only 23%! Share of transport in public sector expenditure: Five Year Plans (%) Sector 1st to 6th Plan (1951‐85) 7th plan (1985‐90) 8th plan (1992‐97) 9th Plan (1997‐2002) 10th plan (2002‐07) 11th Plan (2007‐12) Railways 46.4 56.1 49.1 38.2 35.7 29.7 Roads 28.5 21.5 24.4 39.9 45.6 39.9 Road transport 7.6 7.3 5.9 5 2.4 2.3 Ports 6.3 5.1 3.5 4.2 1.4 3 Shipping 4.7 2.4 5 2.5 1.3 1.3 Light house 0.1 0 NEG NEG NEG 0.02 Inland water transport 0.4 0.6 0.2 0.3 0.2 0.4 Civil Aviation 6.1 6.6 11.4 5.8 3.6 7.9 Pradhan Mantri Gram Sadak Yojana 0 0 0 4.1 7.5 13.4 Other transport 0 0.2 0.4 0 2.1 2.1 Total (Rs bn) 255 295 656 1,196 2,422 6,472 Total Public Sector expenditure (Rs bn) 1,797 2,187 4,855 8,140 16,185 37,510 Transport sector % of total public sector expenditure 14.2 13.5 13.5 14.7 15.0 17.3 Source: Planning commission Indian Railways has suffered from considerable under‐investment during the last several years. It has added a track length of ~3,700km in 25 years (since 1990). In contrast, China has set up 30,500km of new railway lines in just three years (2012‐15) at a cost of CNY 3.58tn and is investing CNY 2.8tn to lay out 23,000km over 2016‐20 and targets +270,000km by 2050. The Indian government targets increasing railways’ share in local transport to 45% by 2030 from 33% right now, with the development of six freight corridors. In 2016‐17, it aims to commission 2,800km of track at ~7km per day vs. an average of about 4.3km per day in the last six years. Its plans is to construct ~19 kms of railway network per day with an investment of about Rs 8.5tn in the next four years. In the last 64 years, India’s railway capacity (route kilometres) has grown by only 23%! India ranks 32 on global competitiveness in logistics due to insufficient infrastructure
- 10. Page | 11 | PHILLIPCAPITAL INDIA RESEARCH INDIA LOGISTICS SECTOR UPDATE Increase in railway track length (km) Source: PhillipCapital research, Indian railway, World bank Poor spending on inland waterways After its independence, India took nearly forty years to set up the Inland Waterways Authority of India (IWAI, 1986) and has spent a dismal US$ 200mn so far on inland waterways. This compares very badly to China’s US$ 15bn expenditure in the last five years alone and Germany’s annual budget of € 15bn in CY14. 0 20000 40000 60000 80000 100000 120000 140000 1950 1960 1970 1980 1990 2000 2005 2010 2015 Cina India India 23% China 4.5x
- 11. Page | 12 | PHILLIPCAPITAL INDIA RESEARCH INDIA LOGISTICS SECTOR UPDATE Growth drivers for the logistics sector The major drivers for logistic players are implementation of GST for efficient tax system, growth in retail and e‐commerce, and a revival of water and rail transport. India’s logistic and warehousing industry presents a big opportunity – with growth in consumption along with infrastructure and regulatory support from the government. The Make in India movement and ease of doing business will revive growth in the industry and in services, resulting in increased movement of goods and services. We expect a significant pick up in investments in transport and logistics ahead, with the government focused on reducing cost of logistics and increasing the competitiveness of Indian exports. Significant investment in DFCC (about Rs 1tn) and in DMICDC (about Rs 3tn) along with focus on water transport should create an enabling infrastructure for efficient logistics. Demand drivers are also affecting the need for logistics. The changing dynamics of the retail industry has shifted the focus from supplier to consumer and delivering products in less time is gaining importance. Retailers are now maintaining steady flow of stock, as delay in the delivery of products could threaten their entire business model. Focus is on real‐time inventory management and order placement and retailers are becoming heavily dependent on smooth and efficient supply management. Key growth drivers for logistics GST implementation to rationalize tax structure India has made significant progress towards improving its structure (first VAT, now very close to implementing GST). Under GST, a specific product or service would have the same level of taxation across the entire country, irrespective of being manufactured and sold in different sub‐national territories (states). GST will replace almost all indirect taxes including excise duty, service tax, value added taxes (VAT), central sales tax (CST), and entry taxes. Certain products such as petroleum and gas, alcoholic products, and farm produce may be exempted from GST’s purview. Interstate sales (including stock transfers) and imports will attract an integrated GST (IGST) collected by the central government. This tax will then be distributed between GDP • Overall GDP growth, increased industrial activities and export‐import trade • Make in india • Ease of doing buisness Infra‐ structure • Logistics parks, SEZ, FTW • Dedicated freight corridors for efficient rail movement • Road network • Developemt of water ways with coastal and inland waterways • Revised land acquisition act • Development of regional transporation links in South Asia GST • Inplementation of Goods and Service tax • support from state and central governemnt Organised structre • Increased FDI, entry of foreign players • Increasing focus on 3PL activities and cost competitiveness • Ecommerce GST is defined as a ‘nationwide uniform taxation system’ and usually replaces multiple taxations by central and state governments within a country. The GST system is based on taxing only the component of ‘value addition’ at each level of goods or services supply by offsetting the tax paid already at the previous level of the value chain. Thus, it automatically incorporates a mechanism that compels every level of the value chain to ensure that the appropriate tax has already been paid in the previous level
- 12. Page | 13 | PHILLIPCAPITAL INDIA RESEARCH INDIA LOGISTICS SECTOR UPDATE the central government and the ‘destination’ state governments. As a result of this new tax model, individual state administrative borders are expected to become irrelevant for most industries, thereby driving them towards the rationalisation of their logistics operations and infrastructure. Huge impact on logistics players: Opportunities within Currently, companies need to have specific warehouses for each state because selling stock stored in one state to another one, attracts sales tax from both states. This means significantly high level of investments in assets and inventory holding costs than ideally needed. With the rollout of GST, state‐level warehouses are likely to be replaced with regional hub‐level large integrated warehousing facilities, thus significantly bringing down the number of warehouses needed. Various value‐added logistics functions (packing, kitting, labelling) are also likely to be performed at these warehouses. This would eventually require logistics service providers to restructure their operations and infrastructure. Major changes we expect: Consolidation of warehouses Industry players could consolidate their warehouses and set up larger facilities, which would bring in supply‐chain efficiencies. Current supply‐chain models have to depend more on tax considerations instead of the more logical operational considerations. Tax rationalisation is also likely to increase third‐party outsourcing for logistics and lead to companies focusing more on their core competencies. Improved efficiencies due to reduction of trade barriers With the removal of trade barriers, the downtime of vehicles (check‐post inspection, filing of waybills/entry permits, compliances under entry tax laws, and local levies) is likely to reduce. After GST, interstate movement of goods will be subject to IGST, under which all movements will be ‘tax paid’. Additionally, the GSTN will have an audit trail of the movement of goods across state boundaries, which would lead to optimisation of delivery schedules and operational costs of transporters, resulting in competitive pricing. Shift in sourcing and manufacturing decisions Currently sourcing and manufacturing decisions are dependent on indirect tax considerations. Under the GST regime, due to fungibility of credits, these decisions will be made from a supply‐chain perspective – which will lead to logistics hubs in new locations. Free‐flowing movement of goods across the country would result in logistics players gaining larger volumes and nationwide contracts from clients. To fulfil large and long‐distance consignments in the new scenario, logistics players would need a significantly larger share of heavy trucks (20+ tonnes); they would also need mini trucks for efficient last‐mile delivery. Currently most logistics service providers have a large share of medium‐sized trucks in their fleet and a very low share of large truck‐trailers or small trucks. Ecommerce and Free Trade Warehousing Zones (FTWZ) Under the present indirect tax regime, the ecommerce industry is facing significant challenges in terms of VAT payments in destination states. Clear guidelines on the taxability of ecommerce transactions would provide much‐needed relief to the ecommerce industry. If GST extends benefits of tax‐free supply to an FTWZ unit for onward exports, these units will be able to attract significant volumes. Emergence of Multimodal Logistics Parks (MMLP) The focus of logistics companies is shifting towards handling multiple cargos and increasing the share of value‐added services. Leading players are setting up Multimodal Logistics Parks (MMLP) instead of simple ICDs/CFS. MMLP are mainly connected with rail network (for efficient handling of large cargo parcels),container yards, and warehousing (with value added services such as cross docking, palletisation, inventory management, wrapping, packing, bar coding and labelling). Current supply‐chain models have to depend more on tax considerations instead of the more logical operational considerations. Rest and other 35% Check post/ official stoppage 25% Travel time 40% Indian trucks’ productivity is very low at ~250 km per day vs. ~800 km in developed countries. This could easily be increased to at least 350 km per by cutting congestion and introducing electronic toll collections
- 13. Page | 14 | PHILLIPCAPITAL INDIA RESEARCH INDIA LOGISTICS SECTOR UPDATE They also provide supporting infrastructure and ancillary services such as staff housing, weigh bridges, banking and insurance, maintenance and fuel stations, and recreational centres. Rise of ecommerce in the Indian retail sector We expect the Indian retail sector to increase to US$ 765bn by FY20 from ~US$ 500bn in FY16 – an 11% CAGR. Online retailing has about 7% of the pie and has seen strong 60% CAGR over the last five years. Urbanisation is leading to expansion of cities, creating the need for a wider retail foot print around the country. Consumers are increasingly moving from just shopping for needs, to looking for an experience while they shop. Organized retail companies are looking at improving in areas relating to supply chain‐efficiencies and inventory management. This will open doors for logistics companies – creating new and innovative logistics and supply‐chain models. Considering the dynamic and highly technology‐dependent operations, the online retail segment needs to make supply‐chain management models efficient and advanced. India has an internet user base of about 462mn (about 35% penetrations). Despite being the second‐largest user base in world (only behind China’s 721mn, 52% of its population), the penetration of ecommerce is low in India compared to markets like the United States (266mn, 84%), or France (54mn, 81%). India’s internet user base is likely to see a CAGR of 25‐30% over the next five years and we estimate a much faster CAGR of 30‐35% for logistics related to e‐commerce over the next five years. Online retailers are competing on both prices and shorter delivery cycles, creating opportunities for express logistics services and a host of value‐added services. Growing ecommerce is also increasing the need for specialised reverse logistics. Offline customers purchase product only after seeing/experiencing them, thereby limiting scope for returns or exchange. This is not the case with online customers, where returns and exchanges are quite high – which calls for an extremely efficient reverse logistics network. Key characteristics of logistics services for the ecommerce sector are – network reach, timely express delivery, efficient sourcing, standard packaging practices to facilitate easy and secure shipping, ability to service a high number of stock keeping units (SKUs), and multiple modes of payment collection. Implementation of DFCC and DMICDC Cargo movement by train is more cost competitive than movement by road, particularly for a distance of more than 500km. However, in India, containers are moved by road even for a distance of more than 1,000km, due to poor rail infrastructure. In addition, the Indian railways tends to increases haulage charges for goods transport while subsidising passenger tariff, even as its main earnings come from its freight operations. Due to shortage of tracks, passenger trains are given preference and cargo trains are made to wait. As a result, the average speed of a goods train is ~25kms per hour, which makes trucks a better option for many customers. Railways’ share in the goods movement of the country has come down to around 34% from 65% in 1987 while the road sector's share has gone up to 60% from 34%. Dedicated Freight Corridors (DFCs) will strengthen India’s rail transport infrastructure to meet expected high future demand for freight movement. Development of DFCs would result in enhancing the market share of railways in freight by providing an efficient, safe, economical, and environment‐friendly option. DFCCs will reduce unit cost of transportation by creating rail infrastructure to carry higher throughput per train. They will provide non‐discriminatory access to freight trains belonging to Indian railways and other qualified operators. India’s internet user base is expected to grow at a much faster CAGR of 25‐30% over the next five years.
- 14. Page | 15 | PHILLIPCAPITAL INDIA RESEARCH INDIA LOGISTICS SECTOR UPDATE Construction of DFCs across the country is the most ambitious project ever conceived by the Indian Railways. Out of six DFCs planned in a phased manner, two corridors (eastern and western) are scheduled to be fully commissioned by FY18‐19. The eastern corridor will run from Ludhiana in Punjab to Dankuni near Kolkata (1,839km) and the western corridor will stretch from JNPT near Mumbai to Dadri in Delhi (1,534kms). The phasing of corridors is synchronised with the most‐saturated sections on the Mumbai‐Delhi and Delhi‐Kolkata rail links. Efficient infrastructure for container trains post DFCC Feature Existing Western DFC Height 4.26m 7.1m Width 3200mm 3660mm Container Stack Single Stack Double Stack Train Length 700m 1500m Train Load 4000 ton 15000 ton Axle Load 22.9t /25t 32.5t / 25t Track loading Density 8.67 t/m 12 t/m Maximum speed 75 km per hour 100 km per hour Traction Electrical (25KV) Electrical (2x25 KV) Station Spacing 7‐10 Km 40Km Signalling Absolute /Automatic with 1 km spacing Automatic with 2km spacing Communication Emergency Sockets /Mobile Train Radio Mobile Train Radio Source: DFCCIL Delhi Mumbai Industrial Corridor (DMICDC) DMICDC acts as a pass‐through entity for specific projects and is developing industrial cities around a multi‐modal high‐axle‐load dedicated freight corridor between Delhi and Mumbai, covering an overall length of 1,400km. It will develop an area of around 150‐200kms on both sides of its alignment. Its project influence area (PIA) comprises 430,000 sq. km., which constitutes around 14% of India’s total geographical area. Six DMICDC states contribute ~50% of India’s principal crops, constitute 45% of the country’s GDP, and 58% of value of output. The development of industrial regions in these states will result in a 70% contribution to GDP by 2030. DMIC aims to double employment potential in five years (15% CAGR), triple industrial output in five years (25% CAGR), and quadruple exports from the region in five years (32% CAGR).
- 15. Page | 16 | PHILLIPCAPITAL INDIA RESEARCH INDIA LOGISTICS SECTOR UPDATE DMIC will have 24 investment regions developed in three phases out of which seven will be developed in the first phase over the next five years. Each state has one investment region, except Maharashtra, which has two. The master plan for all seven industrial regions is ready. DMICDC is planning to use information technology to the fullest, in addition to having a physical master plan for all these cities. Cisco and IBM are to create a digital layer on top of the physical plan for these cities. The entire city control and governance will be managed from one place with an integrated approach on a massive scale. To monitor real‐time container movement, DMICDC is working on logistics data software for connectivity with all logistic players. Apart from DMICDC, four more corridors will be developed by the ministry of commerce, where DMC will provide support. With the development of the Dedicated Freight Corridor Corporation (DFCC) and Delhi Mumbai Industrial Corridor Corporation (DMICC), the growth rate in the container trade could see a structural shift in the coming years. Progress on DFCC Land: The land acquisition is 85% complete (out of the total land requirement of 11,539ha for 3,300km). For the Western DFC, most of the land has been acquired with compensation pay‐outs of of Rs 41.42bn; for the Eastern DFC, land acquisition for 1,318km is largely over with compensation pay‐outs of Rs 27.4bn, but it is pending for the Sonnagar–Dankuni section (538km). DFCC Corporation has spent ~Rs 220bn so far and has awarded contracts worth ~Rs 450bn. Contracts for 65% track and civil (1,830 km) and 50% systems and 48% electrical have been awarded. There has been improvement in speed of work with mechanised track laying with earth work of 100,000 m3/day, concreting of 1,000 m3/day, and ballast supply of 3,000 m3/day on each corridor. DFCC has been given very stiff targets for completion of major works in both the corridors by December 2018 and commissioning by December 2019. New track‐laying machine to speed up work Source: DFCCIL It can lay 1.5km of tracks per day compared to ~100m‐ 150 per day when done manually
- 16. Page | 17 | PHILLIPCAPITAL INDIA RESEARCH INDIA LOGISTICS SECTOR UPDATE Revival of coastal and inland water India has long coast line spanning 7,500km, forming one of the largest peninsulas in the world; but, coastal shipping accounts for less than 6% of total domestic freight movement – though this mode of transport is approximately 60% more economical, safer, and cleaner compared to road transport. The government’s plan is to lower India’s logistics cost as percentage of GDP to around 9‐10% (from current 13%) with an investment in waterways and railways. It is committed to provide an enabling environment and is focusing on development of waterways with institutional arrangements. The modal shift of cargo to water from roads is expected to reduce cost of transportation, accidents, and environmental pollution, supporting government’s mission of ‘clean India’ and ‘Make in India’. The necessary institutional framework is being created to enable the central and state authorities to work together for ensuring inclusive growth. The government highlighted that IRRs in waterway development would be very attractive and is ready to develop innovative models in PPP. Issues related to financing, taxation, and customs are under consideration to attract investment into the sector. India has almost 14,500km of navigable inland waterways, of which 5,200km are major rivers and 500km are canals suitable for mechanized crafts. It has five declared National Waterways (NW 1 to 5), out of which three are operational with an annual cargo movement of ~7mn mt (miniscule compared with ~1bn mt of port volumes), representing only 0.7% share. IWAI is developing NW‐1, from Haldia port in West Bengal to Allahabad in Uttar Pradesh, at a capital expenditure of ~US$ 1bn with World Bank’s technical and financial assistance. The government has widened its portfolio by declaring 101 rivers as ‘waterways’. Inland Water Transport (IWT) Declared national waterways National Waterway Location Stretch (kms) 1 NW 1 Ganga‐Bhagirathi‐Hooghly river system from Allahabad to Haldia 1620 2 NW 2 Brahmaputra river from Sadiya to Dhubri 891 3 NW 3 West Coast Canal from Kottappuram to Kollam along with Champakara and Udyogmandal canals 205 4 NW 4 Godavari & Krishna rivers & Canals between Kakinada and Puducherry 1095 5 NW 5 Brahmani river & Mahanadi delta system along with East Coast Canal 623 Source: Company, PhillipCapital India Research The government is setting up ten coastal economic regions (CERs). To develop each CER, a Special Purpose Vehicle (SPV) would be formed with equity participation from the concerned state government and the Sagar Mala Company. The management of the CER SPV would vest with the state government. The CER SPV would be responsible for implementing the DPR prepared for the development of the CER. The government is working on seamless movement of cargo on waterways with integration of coastal and inland waterways.
- 17. Page | 18 | PHILLIPCAPITAL INDIA RESEARCH INDIA LOGISTICS SECTOR UPDATE Sagarmala Project to develop coastal regions and maritime sector Source: Ministry of shipping Government’s focus on cold chain India’s cold chain industry is still evolving, not well organized. The Indian cold chain market is highly fragmented with more than 3,500 companies in the whole value system. Organized players contribute only ~8%–10% of the cold chain industry market and most equipment in use is outdated and single commodity based. According to industry estimates, approximately 105 mn tons of perishable produce is transported between cities each year and about 100 million tons moves via non–reefer mode and only ~5 mn tons are transported by reefer trucks. India’s temperature controlled logistics Industry is estimated to grow at 15‐20% each year for the next 3‐5 years, driven by an increased consumption of perishable items that depend upon temperature‐controlled logistics, deeper penetration of these logistics in key categories (including pharmaceuticals, fruits and vegetables), and an increasing number of niche and high end products that require cold chain services. Development of coastal economic zones, enhancement of port infrastructure and efficient evacuation through integration of rail, road and inland waterways
- 18. Page | 19 | PHILLIPCAPITAL INDIA RESEARCH INDIA LOGISTICS SECTOR UPDATE Key emerging opportunities in Indian logistics Increase in containerisation of cargo Most of India’s container cargo moves through gateway ports in north‐west India, which account for around 65% of the container trade. Containers remains a ‘unique’ cargo and traffic mostly belongs to select major ports, unlike bulk cargo handled by almost all ports. Earlier, JN Port, Chennai, and select private ports such as Pipavav Port and Mundra were major container‐handling ports, but with the emergence of container trade, many private and government ports are focusing on container cargo – there is an emergence of container trade at Visakhapatnam, Cochin, and Vo Chidambaranar (Tuticorin). CFS operators are also increasing their presence across the country along with their presence at JN Port. Four ports handle 80% of India’s volume (mn TEU) Cargo handled at major port (mn TEU) Source: Indian Ports Association The share of container cargo as a percentage of total cargo at major ports has increased to 20% in 2016 from 14% in 2004. Historically, container cargo has grown at 1.1x GDP over the past 10 years (multiplier is high at ~1.6x during economic recovery). With increased container penetration and development of industrial corridors, this growth should increase. Substantial incremental demand should come from a shift of general cargo in break bulk to containerised form. 0 1 2 3 4 5 FY15 FY16 Four ports handle ~80% volume 0 2 4 6 8 10 12 14 16 18 20 FY05 FY06 FY07 FY08 FY09 FY10 FY11 FY12 FY13 FY14 FY15 FY16 FY… FY… FY… FY… Total Container volume Volume at Major Prots Container traffic has remained one of the highest growing cargoes in India historically, with a GDP multiplier of around 1.1x Logistic players related to container movement and trade are uniquely placed to benefit from growing international trade and a shift to containerised cargo from bulk form Container Logistics: Opening doors of opportunities
- 19. Page | 20 | PHILLIPCAPITAL INDIA RESEARCH INDIA LOGISTICS SECTOR UPDATE Growing containerisation of cargo has brought about a significant change in the organisation of port terminal services and resulted in demand for highly sophisticated handling equipment, inland logistics capabilities, and service efficiencies. Even goods that were formerly never transported exclusively as bulk cargo are now being containerised due to the latter’s advantages (a few examples – tea, rice, food grains and newsprint). Due to standardisation, handling costs are lower for containerized cargo vs. break bulk. This cost advantage is more pronounced due to India’s balance of trade –India has an exim imbalance with more imports than exports. As a result, incoming containers wait for repositioning to other locations. Instead of shipping out these ‘empties’, container lines offer good deals to specific locations – as a result, soya, sugar, steel plates, and agricultural products are increasingly getting containerised. Damages eat up 20% of break bulk cargo, which also offers a strong incentive to ‘box it’. This is also true for small consignments. Shippers wanting to handle smaller parcel sizes because customers want just‐in‐time deliveries prefer containers – because for these, tracking transit and transit times are easier due to the technology and communication facilities. Indian container trade (despite being higher growth than other commodities) is lower than other developing countries. Total container trade in China has increased by 122mn TEU to ~188mn TEU since 2005, while India container trade grew by 6.8mn TEU over the same period. In fact, India’s total container trade is significantly lower than volumes in many single ports in China and Singapore (see chart below). With improved port infrastructure and rail network, container trade provide secular growth opportunities. Container volume trend (mn TEU) Container volumes at global ports (mn TEU) Source: World Bank, Indian Ports Association, Industry 0 20 40 60 80 100 120 140 160 180 200 2000 2005 2010 2015 India China 0 10 20 30 40 Ports in China Ports in India Main containerised cargo includes auto and engineering components, garments, electronic goods, agro products, cotton yarn, machinery/parts, granite products, coir products, leather products and jute products Indian ports have been seeing many former break bulk cargo (rice, maize, glass, granite, garnet sand, soya, cement and flowers) moving into containers
- 20. Page | 21 | PHILLIPCAPITAL INDIA RESEARCH INDIA LOGISTICS SECTOR UPDATE Model shift to benefit container train operators In 2006, Indian Railways deregulated rail transportation of containers –– its first major effort towards attracting private capital to the sector. Currently, there are around 15 private container‐train operators in India, out of which 3‐4 are inactive. Since deregulation, private investors have pumped in +Rs 40bn in wagons, containers, and terminals in addition to Rs 6.5bn in license fees. Frequent and steep increase in rail haulage charges for container trains and incongruous policy decisions have impacted investments in this segment. Even in other commodities, railways consistently lost out to roads, as it did not install adequate capacity or respond to market needs. Economic growth, as seen in India over the past decade, has led to congested roads and an over‐burdened railway network. India has 4mn kms of roads, accounting for nearly 60% of domestic traffic of which the National Highways constitute only 1.7% but carry as much as 40% of the total road freight. The divide between the two modes became even more pronounced as roads expanded rapidly on focused policy and investments, particularly during the last decade. This consistent and unchecked fall in the share of railways through the years was estimated by RITES to have cost the Indian economy about Rs 385bn (16% of the total transport cost). Railway share in cargo transport to recover (%) Source: Planning commission The freight segment generates around 70% of railways’ revenues. Rail Vikas Nigam Ltd is responsible for executing projects under national Rail Vikas Yogana, which was initiated in 2002. These projects pertain to rail‐port connectivity and include strengthening of the golden quadrilateral and diagonals linking the four metro cities (Delhi, Mumbai, Chennai and Kolkata) ‐ they total about 10,000km and include developing multi‐modal corridors to the hinterland. The dedicated freight corridor corporation of India is formed to implement the country’s most ambitious dedicated freight corridor project. Six special purpose vehicles (SPV) out of three are operational. We believe the share of railways will increase to ~45% over FY30 with the beginning of DFCC and strengthening of the existing rail network. The government is expected to support a shift in cargo to railways from roads. We expect container train operators to benefit significantly – with an improvement in rail network, increase in asset turnaround, and rationalisation of haulage charges. 0 20 40 60 80 100 1950‐51 1978‐79 1986‐87 2007‐08 2014‐15 2029‐30 Railway share The Indian Railway network, one of the largest in the world, is overburdened and operating at over 100% utilisation Policy support to make huge investment in DFCC – ~Rs 1tn
- 21. Page | 22 | PHILLIPCAPITAL INDIA RESEARCH INDIA LOGISTICS SECTOR UPDATE India Cargo: Modal mix Source: Planning commission The future: Integrating coastal shipping and inland waterways India has a long coastline, spanning 7,516km, forming one of the biggest peninsulas in the world. It is serviced by 13 major ports (12 governments, one private) and 187 notified minor and intermediate ports. These ports account for nearly 90% (by volume) of India’s international trade. However, for India, the share of coastal shipping in overall cargo is only about 6% compared to ~30% in China and 40% in Japan. In fact, in China, waterways have a larger share than roads. Presently, India has just 140 vessels for coastal movement while China has around 12,000 specially built coastal cargo ships for carrying coal, steel, grains, and fertilisers. Country‐wise share of water in overall transport (%) Source: Industry Reports The potential of coastal shipping and inland waterways is untapped, but it is receiving much‐need attention from the government of late. There are many inherent advantages of this mode of transportation. Coastal shipping or use of water as a mode of transportation is much safer, more economical, and less polluting (see table below). Waterways are 50% cheaper than road and nearly 30% cheaper than railways. The coastal leg, apart from being more fuel efficient, can also carry larger parcel sizes and provide a great opportunity for consolidation of loads and over‐dimensional cargo. 57 69 45 36 25 45 6 5 9 1 1 1 2010 2030 2030 Road Rail Water Air Wtih current trajectory towards balance mix 0 5 10 15 20 25 30 35 China USA India
- 22. Page | 23 | PHILLIPCAPITAL INDIA RESEARCH INDIA LOGISTICS SECTOR UPDATE IWT is more fuel efficient vs. road and train Operating cost per ton kn Fuel efficiency ton km/litre Shipping 0.75 105 Rail 1.18 85 Road 1.51 24 Source IWA Cargo breakup for coastal movement Source: Indian Ports Association Major government initiatives to encourage coastal shipping include (1) relaxation in Cabotage law, (2) concession on port charges, (3) reduction in duty on bunker, and (4) dedicated berth for coastal shipping at major ports. Development of coastal shipping will also be linked to increased opportunities in container‐feeder service. The possibility of a dedicated sea corridor with inter‐port connectivity is being explored. Coastal shipping has the potential to transport 160mtpa of coal and 80mtpa of steel, cement, and food grains. Major coastal routes in India Source: Company Petroleum Oil and Lubricants 49% Thermal Coal 27% Iron ore 5% Cement / Clinker 6% Other 13%
- 23. Page | 24 | PHILLIPCAPITAL INDIA RESEARCH INDIA LOGISTICS SECTOR UPDATE Cargo movement on national waterways (mn tonnes) Source: Company, PhillipCapital India Research The government is inviting private‐sector participation for development of river ports, multimodal terminals, construction and repair facilities, and operation of barges on rivers. IWAI is setting up four multimodal terminals at Varanasi, Haldia, Kolkata, and Sahibganj, which will have rail and road connectivity. It has also signed an MoU with DFCC for creating a logistic hub and rail connectivity at Varanasi. NTPC is using NW‐1 for transportation of 3mtpa of imported coal from Haldia to Farakka in West Bengal and has a seven‐year contract with Jindal ITF. NTPC has also finalized a contract for its Barh power plant (3mpta coal transport on NW‐1 for 10 years) for which work orders are in process. NTPC coal import – a success story NTPC is using NW‐1 for transportation of 3mtpa of imported coal from Haldia to Farakka and has a seven‐year contract with Jindal ITF. NTPC has also finalised a contract for its Barh power plant for 3mpta coal transport on NW‐1 for 10 years for which work orders are expected from August 2015. Jindal ITF has invested ~Rs 8bn in setting up infrastructure and operating 30 barges for the Farakka plant. Thermal power plants, cement companies, fertiliser companies, edible oil companies and Food Corporation of India will be able to use NW‐1 extensively for cargo transport. The project would have terminals at Allahabad, Varanasi and Gazipur in Uttar Pradesh, Sahibganj in Bihar and Katwa in West Bengal to facilitate transhipment and movement of bulk cargo and is expected to take 5‐6 years to fully complete. At present, 10 thermal power stations are operational in the proximity of NW‐1. Another 11 are expected to come up along NW‐1 in the next 5‐8 years with the total installed capacity of 15,000 MW. NW‐1 is fully ready to cater to the transportation needs of NTPC and other industrial units for transportation of bulk cargo required for the plants located on the banks of the Ganga. 0 1 2 3 4 5 6 7 8 2002 2003 2004 2005 2006 2007 2008 2009 2010 2011 2012 2013 2014 NW III NW II NW1
- 24. Page | 25 | PHILLIPCAPITAL INDIA RESEARCH INDIA LOGISTICS SECTOR UPDATE Thermal power plants on NW‐1 Source: Ministry of Shipping Cargo movement by IWT increased to 70mn tonnes in 2015‐16 from 32mn tonnes in 2003‐04. Most of the cargo movement by IWT takes place in Goa and Maharashtra, which account for around 90% share of its cargo traffic. There is a 147mn‐tonne potential to divert traffic to national waterways from rail and road. The government is investing ~Rs 227bn in providing basic infrastructure on NW1‐6 while private investment is seen at ~Rs 656bn in buying barges and creating other operational assets. Capex plan for waterways Rs bn Phase 1 Phase 2 Total Waterway development 15.4 173.2 188.5 Terminal development 6.6 13.9 20.5 Port Connectivity 3.4 8.1 11.5 Road Connectivity 0.9 2.3 3.2 Rail connectivity 0.0 3.9 3.9 Total 26.3 201.3 227.6 Source: IWA Companies such as Allcargo, TCI, and SCI have already started operating in coastal shipping to handle bulk and container cargo. We believe these logistics players will benefit more than pure shipping companies in this segment due to advantage of cargo aggregation and end‐to‐end solutions. Most of the cargo movement by IWT takes place in Goa and Maharashtra, which account for around 90% share of its cargo traffic.
- 25. Page | 26 | PHILLIPCAPITAL INDIA RESEARCH INDIA LOGISTICS SECTOR UPDATE Annexure Technological impact on truck transport Innovations and market disruption Today, information availability, visibility, operational flexibility, and scalability are critical to a successful logistics function. Market innovators are changing the business models based on technology (like what Uber and OLA did in taxi transport). These entrants should be watched closely for market disruption. New players are connecting last‐mile logistics companies with customers, for inter‐ city transport. Logistics tech ventures such as TruckSuvidha and BlackBuck follow an asset‐light model and do not own vehicles themselves; they are mostly a booking platform (like Ola and Uber). • Rivigo is among the few players that owns a fleet of trucks. Rivigo’s drivers do not spend more than a day on the road (it has a system it calls ‘Driver Relay’ which makes sure drivers get back home on the same day). • Dipper logistics run by Dipper Technologies Pvt Ltd serves the long‐haul (inter‐ city) full truckload market. It provides a technology platform enabled with IoT devices to large‐fleet owners, small‐to‐mid‐sized trucking carriers, and transporters. It has about 2,000 verified, GPS‐enabled vehicles. • Flywheel Logistics: Started in 2009, it has a unique model ‐ it transports domestic containers by operating on a 'network style' with 160 daily departures on 60 national routes with its 750‐strong fleet of 40‐feet and 20‐feet TEU containers reaching 18 states.
- 27. INSTITUTIONAL EQUITY RESEARCH Page | 28 | PHILLIPCAPITAL INDIA RESEARCH Navkar Corporation (NACO IN) Favourable mix, rail connectivity, VAS INDIA | LOGISTICS | Initiating Coverage 8 August 2016 Why Navkar? • High growth: Over FY16‐18, revenue/EBITDA/earnings CAGRs will be 61%/55%/43% • Leading player in container‐handling and storage with CFS and ICD facilities in Mumbai and Vapi. It has significantly outperformed industry growth • Creating new market opportunities in Vapi to cater to Gujarat’s industrial belt • Competitive advantage of rail connectivity Differentiated service in JN Port’s crowded market Navkar has three CFS (container freight stations) with a total handling capacity of 310,000 TEU per annum at Panvel, Mumbai, close to National Highway 4 and JN Port (Jawaharlal Nehru Port, NhavaSheva, Navi Mumbai), which accounts for 40% of India’s total container trade. This port has 30 CFSs with average capacity utilisation of ~55% each, but Navkar has been able to raise its utilisation to 97% in FY16 from 60% in FY12 with a container volume CAGR of 13%. We believe its competitive advantages include: (1) favourable cargo mix (exim), (2) cost‐effectiveness due to rail connectivity, and (3) value‐added services. VapiI CD should provide strong growth and value creation opportunities It is developing a 474,000 TEU p.a. ICD (inland container depot) at Umergaon (near Vapi), Gujarat. The Vapi‐Valsad‐Daman‐Silvassa‐Surat‐Ankleshwar‐Bharuch‐Baroda belt is one of the largest and vibrant industrial clusters in India, covering industries such as chemicals, textiles, engineering, food products, steel, and paper. Due to rail connectivity, Navkar is in an advantageous position for providing cost‐effective solutions. Importers and exports can save ~20‐25% by transporting goods through rail to JN Port directly using Navkar ICD compared to road transport, which requires multiple handling. We believe Vapi ICD can generate revenue of Rs 3bn and EBITDA of Rs 1bn in FY18. Warehousing services to complement its Vapi ICD Navkar is setting up a fully‐integrated logistics park close to its ICD at Umergaon at an estimated cost of Rs 3.14bn; it is likely to be ready in 2HFY17. This park would provide warehousing (~4.7mn sq. ft.) and value‐added services including a cold‐storage facility (5,000 sqm), container maintenance, a repair and cleaning yard, an empty container yard, and a modern garage facility with a workshop for vehicle maintenance. We have assumed 45% utilisation with revenue of Rs 1.38bn and EBITDA of Rs 698mn in FY18. Containers to remain an attractive cargo CFS / ICD are a critical link in container logistics and should benefit from secular growth in containerised cargo in India. Containers have remained one of the highest growing cargoes in India historically, with a GDP multiplier of around 1.1x. Incremental demand is likely to come from a shift of general break bulk cargo to the containerised form. We believe DFCC, and an increase in container capacity at JN Port, with the fourth container terminal of ~4.8mnTEU, will increase container trade at the port significantly (trade was adversely impacted due to capacity constraints) – this will benefit Navkar’s Panvel CFS. Valuations At CMP, stock is trading at 13x FY18 earnings and 8.8x EV/EBITDA. The company has a limited valuation history and came out with an IPO in December 2015. Navkar with strong execution back ground offer both short term and long term growth opportunities. We have valued the company at 18x FY18 EPS (average multiple of our logistic coverage) to arrive at target price of Rs 288, which offers almost 40% upside from current levels. BUY CMP RS 205 TARGET RS 288 (+40%) COMPANY DATA O/S SHARES (MN) : 143 MARKET CAP (RSBN) : 29 MARKET CAP (USDBN) : 0.45 52 ‐ WK HI/LO (RS) : 224 /151 LIQUIDITY 3M (USDMN) : 0.4 PAR VALUE (RS) : 10 SHARE HOLDING PATTERN, % Jun 16 Mar 16 Dec 15 PROMOTERS : 32.5 32.5 32.5 FII / NRI : 29.3 35.0 38.5 FI / MF : 2.0 2.2 2.3 NON PRO : 8.5 4.1 2.8 PUBLIC & OTHERS : 27.8 26.3 23.9 PRICE PERFORMANCE, % 1MTH 3MTH 1YR ABS ‐2.7 17.3 NA REL TO BSE ‐6.1 6.2 NA PRICE VS. SENSEX Source: Phillip Capital India Research KEY FINANCIALS Rs mn FY16 FY17E FY18E Net Sales 3,473 6,850 8,960 EBIDTA 1,501 2,693 3,597 Net Profit 1,117 1,542 2,276 EPS, Rs 7.8 10.8 16.0 PER, x 26.2 19.0 12.8 EV/EBIDTA, x 21.2 12.1 8.8 P/BV, x 2.2 2.0 1.8 ROE, % 8.5 10.8 13.7 Debt/Equity (%) 41.5 30.7 20.1 Source: PhillipCapital India Research Est. Vikram Suryavanshi(+ 9122 6667 9951) vsuryavanshi@phillipcapital.in 80 90 100 110 120 130 140 150 Oct‐15 Jan‐16 Apr‐16 Jul‐16 Navkar BSE Sensex
- 28. Page | 29 | PHILLIPCAPITAL INDIA RESEARCH NAVKAR CORPORATION INITIATING COVERAGE Investment Positives Differentiated service in crowded market at JN Port Navkar has three CFS with a total handling capacity of 310,000 TEU per annum at Panvel, Mumbai, close to National Highway 4 and JN Port, which accounts for 40% of India’s total container trade. JN Port’s container cargo was adversely affected due to capacity constraints and the economic slowdown over the past three years. This Port is serviced by 30 CFS’, which have an average capacity utilisation of ~55%, but Navkar has been able to raise its utilisation to 97% in FY16 from 60% in FY12 with a container volume CAGR of 13%. We believe its competitive advantages include: • Favourable mix of exim cargo: Navkar’s export and import cargo mix is favourable at 44.5% and 55.5%, which helps it to manage empty containers efficiently and to provide cost‐effective service to shipping lines. Rail connectivity through a Private Freight Terminal (PFT) helps it to attract large‐parcel agricultural cargo, which accounts for ~41% of its total container volume. It specialises in handling hazardous cargo at its CFS – this has seen 20% CAGR to ~42,400 TEU, contributing to 14% of its volume. Diverse mix in cargo significantly reduces volatility. • Cost‐effective service with rail connectivity: Navkar is the only CFS with rail connectivity out of the total 30CFS at JN Port. Roads leading to the port are often congested resulting in transportation delays and difficulties in managing larger cargo size. Navkar has entered into an agreement with the Central Railways to operate a private freight terminal (PFT) at its Somatane CFS in 2012, which enables cargo transportation by rail between its CFS and JN Port. Rail connectivity reduces the cost for long distance cargo compared to road. Its PFT allows transportation of cargo from inland destinations on the Indian rail network to CFS increasing the marketable area for the facility. Its CFS’ are located close to National Highway 4 and National Highway 17, which provide good connectivity to interior parts of the country. • Supporting services: The company is following the asset‐ownership model and has an in‐house fleet for reliable cargo delivery. It also provides ancillary services such as empty container storage, repair, and maintenance. The Somathane CFS has a unit for the inspection and approval of agricultural cargo set up by “The plant and quarantine authority” of the Ministry of Agriculture, Government of India. Agricultural cargo at this CFS has seen 16% CAGR to ~124,000 TEU, which compares favourably with just 1% cargo CAGR at JN Port over the past four years. It has set up an empty container yard and provides services for the repair and maintenance of containers at CFS. Navkar: Significant outperformance at JN Port Source: Indian Port Association, Company 0 100 200 300 400 500 0 1000 2000 3000 4000 5000 FY12 FY13 FY14 FY15 FY16 FY17 FY18 JNPT Panvel (RHS) Vapi (RHS) Navkar has been able to raise its utilisation to 97% in FY16 from 60% in FY12 – with a container volume CAGR of 13% Has three CFS with a total handling capacity of 310,000 TEU per annum at Panvel, Mumbai Navkar is the only CFS with rail connectivity out of the total 30 CFS’ at JN Port Its CFS’ are located close to National Highway 4 and National Highway 17, which provide good connectivity to interior parts of the country
- 29. Page | 30 | PHILLIPCAPITAL INDIA RESEARCH NAVKAR CORPORATION INITIATING COVERAGE Navkar is adding capacity at Panvel by installing six rubber‐tyred gantry cranes (RTGS) out of which it has installed two and will installed the rest by August 2016. We have assumed volume CAGR of 11% to 3,73000 TEU at Mumbai CFS over FY16‐18. ICD at Vapi to provide strong growth and value‐creation opportunities The company is developing an ICD at Umergaon (Valsad district, near Vapi) in Gujarat, with an initial capacity of 474,000 TEUs per annum. The Vapi‐Valsad‐Daman‐Silvassa‐ Surat‐Ankleshwar‐Bharuch‐Baroda belt is one of the largest and vibrant industrial clusters in India, covering industries such as chemicals, textiles, engineering, food products, steel, and paper. Vapi is also being considered for inclusion into the 100 ‘smart cities’ planned all across India. VapiI CD: An attractive location with competitive advantage Source: Company Vapi is 205km from the JN Port and approximately 145km from Hazira Port. It is well connected through road and railway networks with NH8, which actually passes through the city. Due to rail connectivity, Navkar has a significant advantage in providing cost‐ effective solutions. Importers can save ~20‐25% by transporting goods through rail to JN Port directly compared to road transport, which requires multiple handling. We have assumed the container volumes at its Vapi ICD at ~100,000 TEU in FY17 and at 125,000 TEU in FY18 with 21% and 27% capacity utilisation respectively. We estimate that in FY18, Navkar’s Vapi ICD will generate Rs 3.04bn in revenue and an EBITDA of Rs 1bn. Vapi ICD revenue and EBITDA estimates (Rs mn) Source: PhillipCapital India Research Estimates 2339 3040 3545 5477 823 1074 1269 1981 0 1000 2000 3000 4000 5000 6000 FY17 FY18 FY19 FY20 Revenue EBITDA
- 30. Page | 31 | PHILLIPCAPITAL INDIA RESEARCH NAVKAR CORPORATION INITIATING COVERAGE Warehousing to complement its Vapi ICD Navkar is setting up a fully‐integrated logistics park close to its ICD at Umergaon at an estimated cost of Rs 3.14bn; it is likely to be ready in 2HFY17. This park would provide warehousing and value‐added services including a cold storage facility, container maintenance, a repair and cleaning yard, an empty container yard, and a modern garage facility with a workshop for maintenance of vehicles enabling trailer operators to reduce waiting time. It will have total warehousing space of 4.7mn sq. ft. and we have assumed 45% utilisation with revenue of Rs 1.38bn and EBITDA of Rs 698mn in FY18. The logistics park will be able to provide comprehensive logistics and warehousing services to customers and attract more volumes for the company. Expansion to benefit from lower capex; to improve return ratios Navkar has an asset‐ownership model to ensure reliable service to its customers. It owns and operates 513 trailers for transporting cargo between its CFS’ and the JN Port. It has ~32 forklifts, 21 reach‐stackers, and five heavy‐duty cranes to load and unload freight containers from trains and trailers. It also owns five weighbridges each with a capacity of 100MT to weigh cargo loaded on to trailers, and an in‐motion weighbridge with a capacity of 120MT to weigh rail wagons. It is expanding its capacity at Panvel by installing six rubber‐tyred gantry cranes (RTGC), which would increase its container‐handling capacity by ~252,000 TEUs and improve efficiency. It was able to buy these RTGCs at a significant discount from Mitsubushi due to the cancellation of an order by a previous buyer and save around Rs 346mn on capex. The decline in commodity prices also helped it to save Rs 450mn in project costs at its logistics park, which helped it to repay loans worth Rs 873mn in FY16 – this will improve its return ratios. Savings in capex helped to repay loan Rs mn Proposed amount Revised amount Amount utilised till Q4FY16 Capacity enhancement at Somathane CFs 1145 799 362 Dev. of non‐notified area of CFS 543 469 192 Logistics park at Valsad 3146 2693 678 Repayment of loan 0 873 745 Total 4833 4833 1978 Source: Company Containers to remain attractive cargo CFS / ICD are critical links in container logistics and are expected to benefit from secular growth in containerised cargo in India. Container traffic has remained one of the highest growing cargoes in India historically; with a GDP multiplier of around 1.1x. India has seen growth of 15‐17% in its container volumes in FY06‐08 signalling higher multiplier of ~1.6x during economic recovery. The share of container cargo as a percentage of total cargo at major ports has increased to 20% in 2016 from 14% in 2004. Substantial incremental demand should come from a shift of general cargo in break bulk to containerised form. Most of India’s container cargo moves through gateway ports in north‐west India, accounting for around 65% of the container trade. Container traffic mostly belongs to major ports. Only select non‐major/intermediate ports such as Pipavav Port and Mundra Port cater to containerised traffic. With increased container penetration and development of industrial corridors, growth in container traffic should increase. It will have total warehousing space of 4.7mn sq. Ft. And we have assumed 45% utilisation with revenue of Rs 1.38bn and EBITDA of Rs 698mn in FY18 It is expanding its capacity at Panvel by installing six rubber‐tyred gantry cranes
- 31. Page | 32 | PHILLIPCAPITAL INDIA RESEARCH NAVKAR CORPORATION INITIATING COVERAGE Container volume in India (mn TEU) Source: Indian Ports association DFC/DMICDC: Changing paradigm for long‐term growth We believe that its Panvel facilities will see higher and faster growth as (1) additional capacity at JN Port comes up (by FY18), and (2) with the completion of the Dedicated Freight Corridor (DFCC). Dedicated freight corridors will enhance railways’ competitive edge significantly with the hub‐and‐spoke model gaining prominence by reducing lead times with higher speed (~2x) and higher cargo‐carrying capability by double‐stacking of containers. Currently, a train from Mumbai to Delhi carries 90 containers each way in ~40 hours; after the DFCC starts, one train should carry 360 containers in ~25 hours. This implies more than 4x cargo carriage per year, thus yielding significant reduction in capital intensity, in turn resulting in better return ratios. DFCC and DMICDC alignment Source: DMICDC 0.0 2.0 4.0 6.0 8.0 10.0 12.0 14.0 16.0 18.0 FY05 FY06 FY07 FY08 FY09 FY10 FY11 FY12 FY13 FY14 FY15 FY16 FY17 FY18 FY19 FY20 Total Country Volume Major Ports JNPT CAGR 8.6%
- 32. Page | 33 | PHILLIPCAPITAL INDIA RESEARCH NAVKAR CORPORATION INITIATING COVERAGE The Ministry of Commerce and Industries, GOI, is developing an industrial corridor along the western dedicated freight corridors (DFCC) to create an economic base with a globally‐competitive environment and modern infrastructure. It is India's most ambitious infrastructure project for developing new industrial cities as "Smart Cities" implementing next‐generation technologies across infrastructure sectors. It will expand India's manufacturing and services base and develop DMIC as a global manufacturing and trading hub. The western corridor is specifically dedicated to the container traffic requirements for existing as well as emerging ports of Gujarat, Maharashtra, and the northern hinterland. Its route comprises of the following main destinations: JNPT‐Surat‐Vadodara‐Ahmedabad‐Palanpur‐Ajmer‐Rewari. We believe DFCC and the increase in container capacity at JN Port with fourth container terminal of ~4.5mn TEU will increase container traffic at JN Port significantly, which was otherwise constrained by capacity. This will benefit Navkar’s Panvel CFS. The rail connectivity of Vapi CFS and its location advantage will provide competitive advantage to cater to northern container trade efficiently. Financials We forecast revenue CAGR of 61% to Rs 8.96bn over FY16‐18 driven by an 11% CAGR in volume growth at its Panvel CFS and revenue addition from the Vapi ICD and warehousing. The Vapi expansion is likely to lead to a 29% CAGR in container volumes to 476,688 TEU over FY16‐18. We expect warehousing and value‐added activates to contribute revenue of Rs 1.38bn in FY18 (about 15% of total). Revenue CAGR of 61% over FY16‐18 (Rs mn) Source: Company, PhillipCapital Over FY12‐16, the company’s average realisation per TEU at its Panvel CFS was about Rs 11,400 – with a 1.7% CAGR. We have assumed average increase of 3% per annum to Rs 12,150 per TEU. Its FY16 EBITDA margin was 43%; we have assumed sustainable margin of ~40% for the Panvel CFS over FY17‐18. We expect EBITDA CAGR of 10% to Rs 1.8bn over FY16‐18 for the Panvel CFS. In FY18, we estimate the EBITDA of its Vapi ICD at Rs1bn and at Rs 700mn for its warehousing facility. We expect an EBITDA CAGR of 55% to Rs 3.6bn over FY16‐18. 0 2000 4000 6000 8000 10000 FY10 FY11 FY12 FY13 FY14 FY15 FY16 FY17 FY18 Agri‐Treading Warehousing Vapi ICD Panvel CFS
- 33. Page | 34 | PHILLIPCAPITAL INDIA RESEARCH NAVKAR CORPORATION INITIATING COVERAGE EBITDA and margin Earnings CAGR of 44% over FY16‐18 Source: Company, PhillipCapital India Research The company’s capital expenditure for the Vapi ICD is at Rs 3.8bn and is spending Rs 2.7bn for setting up warehousing. Navkar is expanding capacity at its Panvel CFS by ~80% to 562,000 TEU with capital expenditure of Rs 800mn. The company has raised Rs 4.8bn through its IPO in December 2015 and we expect it to generate Rs 4.6bn cash from operation over FY17‐18, resulting in comfortable D/E of 0.2x in FY18. Healthy balance sheet despite aggressive capex Return ratios to improve with increased utilisation Source: Company 0 10 20 30 40 50 60 0 500 1000 1500 2000 2500 3000 3500 4000 FY10 FY11 FY12 FY13 FY14 FY15 FY16 FY17 FY18 EBITDA (Rs mn) EBITDA margins (RHS) ‐100 ‐50 0 50 100 150 200 0 500 1000 1500 2000 2500 FY10 FY11 FY12 FY13 FY14 FY15 FY16 FY17 FY18 PAT (Rs mn) Growth (%) ‐RHS 0.00 0.50 1.00 1.50 2.00 2.50 0 1000 2000 3000 4000 5000 6000 FY10 FY11 FY12 FY13 FY14 FY15 FY16 FY17 FY18 Gross Debt (Rs mn) D/E (X) ‐RHS 0.0 5.0 10.0 15.0 20.0 25.0 30.0 35.0 40.0 FY10 FY11 FY12 FY13 FY14 FY15 FY16 FY17 FY18 RoCE (%) RoE (%)
- 34. Page | 35 | PHILLIPCAPITAL INDIA RESEARCH NAVKAR CORPORATION INITIATING COVERAGE Valuations Navkar’s rapid expansion – with an increase in its container‐handling capacity at Vapi and Panvel, and the setting up of its logistic and warehousing park – makes it an exciting play on container growth. It has been able to gain market share consistently, thereby appeasing investors’ concerns. We believe it is set for a rerating with the demonstration of a leadership position in a challenging environment. Relative valuation of logistics players Company Navkar Allcargo Concor Gateway VRL MCap (Rs mn) 29,233 46,872 279,825 29,566 28,467 EV (Rs mn) 31,812 51,470 254,182 30,257 32,819 P/E (x) FY16 26.2 16.9 35.5 27.0 27.8 FY17 19.0 14.5 28.0 25.0 25.6 FY18 12.8 11.2 22.6 15.6 19.8 P/B (x) FY16 2.2 2.1 3.5 3.1 5.5 FY17 2.0 1.9 3.1 3.0 5.0 FY18 1.8 1.7 2.8 2.8 4.4 EV/EBITDA FY16 21.2 5.0 25.7 13.9 11.7 FY17 11.8 8.2 20.0 14.2 11.0 FY18 8.8 6.5 15.0 10.4 9.1 P/Cash EPS (x) FY16 22.3 10.9 24.3 15.6 14.8 FY17 14.9 9.7 20.2 14.9 13.7 FY18 10.7 7.7 16.0 10.5 11.6 RocE (%) FY16 8.1 13.1 12.7 12.5 20.0 FY17 12.4 13.9 14.1 11.8 20.3 FY18 16.0 15.8 15.9 16.5 24.8 Source: Company The company has limited valuation history with its IPO coming out only about seven months ago. Strong execution back ground offers both short term and long term growth opportunities. We have valued the company at 18x our FY18 EPS (average multiple of our logistic coverage) to arrive at a target price of Rs 288. Additionally, we have also used DCF as a second reference (8% higher than our PE valuation), considering change in revenue mix with up‐front capacity addition. The major benefit of the Rs 7.3bn expenditure and operational benefit of DFCC should start materialising from FY18. Our DCF valuation is based on the following assumptions: WACC derived from cost of equity of 11.5%. Equity risk premium of 3.5% and effective tax rate of 23%. Perpetual growth rate of 5.5% in EBITDA from FY20 onwards, considering strong outlook for container trade in India along with the company’s increasing competitive market position. DCF valuation Present Value of Cash flow 5,337 Key Assumptions Present Value of Terminal Value 41,692 Cost of Equity 11.5% Total Present Value 47,029 Cost of Debt 9.2% Less: Net Debt 2,579 WACC 11.5% Equity value 44,450 Tax rate 23.0% Value Per Share 312 Terminal Growth rate 5.5% Source: PhillipCapital India Research
- 35. Page | 36 | PHILLIPCAPITAL INDIA RESEARCH NAVKAR CORPORATION INITIATING COVERAGE One‐year forward P/E: New assets to provide boost to topline and earnings Source: Company, PhillipCapital India Research Business risks Haulage charges: Container train operators have very limited control over the largest cost component — namely rail haulage. Increase in rates on an ad‐hoc basis by Indian Railways is a point of concern. Competition from road: Shift of cargo from road to rail may take some time. Improved road infrastructure in the country is facilitating direct road transfers with competitive transit times and costs, despite all environmental and energy advantages associated with rail transport. Concentration of business at one port: The business operations are geographically concentrated and are dependent on container traffic at the JN Port. Any decline in container traffic handled by this port or any significant social, political, economic, or geological disruption in the region could have an adverse effect on business. Project execution and business scale up: It is creating a new market (ICD at Vapi) and this business is not tested for different economic scenarios. A delay in scale up of operations will adversely impact financials. 10X 15X 20X 25X ‐ 100 200 300 400 500 Sep‐15 Oct‐15 Nov‐15 Dec‐15 Jan‐16 Feb‐16 Mar‐16 Apr‐16 May‐16 Jun‐16 Jul‐16 Aug‐16 Sep‐16 Oct‐16 Nov‐16 Dec‐16 Jan‐17 Feb‐17 Mar‐17 Price (Rs.) 10X 15X 20X 25X
- 36. Page | 37 | PHILLIPCAPITAL INDIA RESEARCH NAVKAR CORPORATION INITIATING COVERAGE Business Background Promoters and management • Promoted by Mr Shantilal Jayavantraj Mehta (MD) and Mr Nemichand Jayavantraj Mehta (CEO) who have several years of experience in the container freight business and have established business relationships with shipping lines, logistical service providers and customs house agents. • Senior operational team includes Captain Dinesh Gautama, Captain Ashish Chandna, and Mr Dinesh Mohanlal Jain who have extensive strategic and operational experience in the shipping and container freight business. • Operates three CFS at Panvel – close to the JN Port (India’s largest container port with a total container handling capacity of 310,000 TEU per annum). • Has a private railway freight terminal (PFT), which allows it to (1) load and unload cargo from container trains operating between its CFS and the JN Port and (2) to transport domestic cargo to and from inland destinations on the Indian rail network. • Offers services such as packing, labelling/bar‐coding, palletising, and fumigation at its warehouses spread over an aggregate area of 500,000 sq. ft., which includes a bonded warehouse of 60,782 sq. ft. and an area of 118,000 sq. ft. designated for the consolidation of less than container load (LCL). The company works with shipping lines, logistical service providers and customs house agents, importers and exporters including United Arab Shipping Agency Company (India) Private Limited, NYK Line (India) Limited, Hyundai Merchant Marine India Private Limited, Evergreen Shipping Agency (India) Private Limited. The top three shipping lines contribute 40‐45% of its volume handled. Panvel CFS: Operational details Particular Ajivali CFS I Ajivali CFS II Somathane CFS Location Panvel, Mumbai Panvel, Mumbai Panvel, Mumbai Area Custom Notified 135156 sqft 428400 sqft 1073224 sqft Operational May‐08 May‐06 May‐09 Installed capacity (TEU) 25000 65000 220000 Bonded warehouse 0 27641 33141 Reefer Points 16 24 52 Temperature controlled chamber 0 500m3 0 Hazardous cargo 0 yes yes Connectivity Road Road Rail and Road Source: Company • Planning a rail logistics network across the country by setting up distribution hubs or ICDs near railway sidings in major business cities – to capitalise on the growing container traffic in the country. Railways in India are the preferred mode of transport for bulk commodities since they have large rakes that can carry a higher load. A single railway rake can carry 2,610‐3,465 tonnes while a multi‐axle vehicle can carry a maximum payload of only 45 tonnes at a time. Navkar Operations CFS At Panvel with 310,000 TEU capacity ICD At Vapi 447,000 TEU capacity 100% subsidiary Logistics Park, Vapi Warehousing, Cold storage, value added services Equipment Total Reach stackers 21 Forklifts 32 Heavy duty cranes 5 Weigh bridges 5
- 37. Page | 38 | PHILLIPCAPITAL INDIA RESEARCH NAVKAR CORPORATION INITIATING COVERAGE Financials Income Statement Y/E Mar, Rs mn FY15 FY16 FY17e FY18e Net sales 3,288 3,473 6,850 8,960 Growth, % ‐6 6 97 31 Operating expenses ‐1,383 ‐1,437 ‐3,041 ‐3,869 Employee expenses ‐222 ‐248 ‐427 ‐580 Other Operating expenses ‐344 ‐287 ‐689 ‐915 EBITDA (Core) 1,339 1,501 2,693 3,597 Growth, % 7.9 12.1 79.4 33.5 Margin, % 40.7 43.2 39.3 40.1 Depreciation ‐152 ‐193 ‐425 ‐453 EBIT 1,187 1,308 2,268 3,144 Growth, % 6.9 10.2 73.4 38.6 Margin, % 36.1 37.7 33.1 35.1 Interest paid ‐264 ‐231 ‐376 ‐346 Other Non‐Operating Income 22 232 111 159 Pre‐tax profit 944 1,308 2,002 2,956 Tax provided ‐117 ‐191 ‐461 ‐680 Profit after tax 828 1,117 1,542 2,276 Others (Minorities, Associates) 0 0 0 0 Net Profit 828 1,117 1,542 2,276 Growth, % (3.5) 34.9 38.1 47.6 Net Profit (adjusted) 828 1,117 1,542 2,276 Unadj. shares (m) 110 143 143 143 Wtd avg shares (m) 143 143 143 143 Balance Sheet Y/E Mar, Rs mn FY15 FY16 FY17e FY18e Cash & bank 11 2,903 1,083 1,021 Debtors 775 480 959 1,344 Inventory 16 40 43 46 Loans & advances 1,435 1,359 1,386 1,317 Other current assets 233 191 210 231 Total current assets 2,469 4,973 3,681 3,959 Investments 114 74 221 664 Gross fixed assets 11,602 15,755 17,508 18,958 Less: Depreciation ‐594 ‐787 ‐1,212 ‐1,665 Add: Capital WIP 0 0 0 0 Net fixed assets 11,008 14,968 16,295 17,292 Total assets 13,591 20,015 20,198 21,916 Current liabilities 194 820 934 1,196 Provisions 77 92 94 96 Total current liabilities 271 912 1,027 1,291 Non‐current liabilities 5,870 5,885 4,869 3,945 Total liabilities 6,141 6,797 5,896 5,236 Paid‐up capital 1,120 1,449 1,426 1,426 Reserves & surplus 6,320 11,758 12,865 15,243 Shareholders’ equity 7,450 13,217 14,301 16,679 Total equity & liabilities 13,591 20,015 20,198 21,916 Source: Company, PhillipCapital India Research Estimates Cash Flow Y/E Mar, Rs mn FY15 FY16 FY17e FY18e Pre‐tax profit 944 1,308 2,002 2,956 Depreciation 152 193 425 453 Chg in working capital ‐423 1,030 ‐413 ‐76 Total tax paid ‐70 ‐108 ‐380 ‐562 Cash flow from operating activities 604 2,422 1,634 2,771 Capital expenditure ‐4,169 ‐4,153 ‐1,753 ‐1,450 Chg in investments 89 40 ‐148 ‐443 Other investing activities 0 0 0 0 Cash flow from investing activities ‐4,080 ‐4,113 ‐1,900 ‐1,893 Free cash flow ‐3,476 ‐1,690 ‐266 878 Equity raised/(repaid) 914 4,816 ‐23 0 Debt raised/(repaid) 1,200 ‐67 ‐1,096 ‐1,042 Dividend (incl. tax) ‐129 ‐170 ‐424 ‐594 Cash flow from financing activities 1,984 4,579 ‐1,544 ‐1,636 Net chg in cash ‐1,492 2,889 ‐1,810 ‐758 Valuation Ratios FY15 FY16 FY17e FY18e Per Share data EPS (INR) 5.8 7.8 10.8 16.0 Growth, % (3.5) 34.9 38.1 47.6 Book NAV/share (INR) 52.2 92.6 100.2 116.9 FDEPS (INR) 5.8 7.8 10.8 16.0 CEPS (INR) 6.9 9.2 13.8 19.1 CFPS (INR) 4.1 15.4 10.7 18.3 DPS (INR) 0.8 1.0 2.5 3.5 Return ratios Return on assets (%) 10.4 9.8 13.6 17.4 Return on equity (%) 11.1 8.5 10.8 13.7 Return on capital employed (%) 9.1 8.1 12.4 16.0 Turnover ratios Asset turnover (x) 0.3 0.2 0.4 0.5 Sales/Total assets (x) 0.3 0.2 0.3 0.4 Sales/Net FA (x) 0.4 0.3 0.4 0.5 Working capital/Sales (x) 0.7 0.4 0.2 0.2 Receivable days 86.0 50.5 51.1 54.8 Inventory days 1.8 4.2 2.3 1.9 Payable days 21.8 132.7 72.2 73.2 Working capital days 251.4 131.3 88.7 71.0 Liquidity ratios Current ratio (x) 12.7 6.1 3.9 3.3 Quick ratio (x) 12.7 6.0 3.9 3.3 Interest cover (x) 4.5 5.7 6.0 9.1 Total debt/Equity (%) 74.6 41.5 30.7 20.1 Net debt/Equity (%) 74.5 19.5 23.1 13.9 Valuation PER (x) 35.3 26.2 19.0 12.8 PEG (x) ‐ y‐o‐y growth (10.0) 0.8 0.5 0.3 Price/Book (x) 3.9 2.2 2.0 1.8 EV/Net sales (x) 8.5 9.2 4.7 3.5 EV/EBITDA (x) 20.9 21.2 12.1 8.8 EV/EBIT (x) 23.6 24.3 14.3 10.0