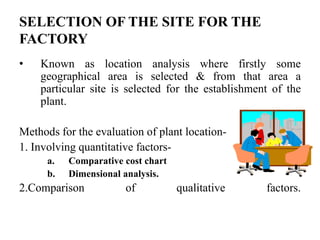
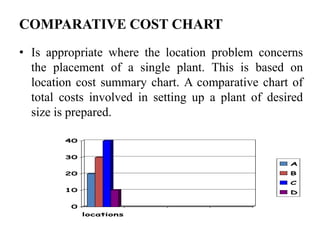
This document provides an overview of factors to consider for selecting an optimal factory location. It discusses:
1) Objective is to maximize location benefits to the firm.
2) Key factors include raw materials, markets, infrastructure, labor, transportation. Quantitative methods like comparative cost charts and dimensional analysis evaluate costs. Qualitative factors like community relations are also considered.
3) Doddaballapur taluk in Karnataka is proposed as a potential site. It has favorable soil and climate, adequate raw materials, labor, and infrastructure access. Demographic details and administrative division of the area are also outlined.
Natioanal Institute of Fashion Design.
The idea is to create a relationship between the built & the unbuilt spaces.
There are evidences of blend of traditional and contemporary architecture.
Aesthetics are cared for, sometimes at the stake of comfort if not function.
The site is well-segregated into various zones w.r.t the functions.
Circulation spaces are minimised to obtain efficiency in design.
report of dance, drama and music academy and auditoriumShourya Puri
case study of triveni kala sangam and kala kendra, goa.
site analysis of gurugram
literature study of dance, drama and music studio and auditorium
about gurugram
This Convention center located in Erode,Tamil Nadu consists multipurpose hall which is one of the largest in India with a seating capacity of 4500 persons.
Note : Compilation from various sources , not mentioned here.
Sabarmati riverfront case study for development of yamuna riverfront agradeeksha sharma
the
the Sabarmati riverfront ahmedabad is a huge successful project. this presentation is about the case study of that riverfront to take the features similar to the the Yamuna riverfront Agra for urban design development project.
PRECISION FARMING
It is an approach where inputs are utilized in precise amounts to get increased average yields, compared to traditional cultivation techniques. It is also known as precision Agriculture, A science of improving crop yield and assisting management decisions using high technology sensor and analysis tools. It is an approach to farm management that uses information technology (IT).
Kunal_Kumar_Regional Insights_#theindiadialogue Feb 2023.pdfDr. Amit Kapoor
Presentation by Kunal Kumar, Joint Secretary and Mission Director, Smart Cities Mission, GoI on "Regional Insights" at #TheIndiaDialog on February 23 at Stanford University. The #TheIndiaDialog was organised by Institute for Competitiveness and US Asia Technology Management Center at Stanford University.
Integrating GPS and SR Measures of Land in HH Surveys (Alberto Zezza, World B...ExternalEvents
Expert consultation on methodology for an information system on rural livelihoods and Sustainable Development Goals indicators on smallholder productivity and income
7 - 8 December, FAO headquarters
Green space suitability evaluation for urban resilience convertedShiva Pokhrel
The Kathmandu Metropolitan City is one of the fastest growing capital cities around. Excessive unplanned urban growth in the city leads to negative impacts on urban environments, publics, and communities. Metropolitan administrators and planners have been facing with impenetrability in making available of green space due to the unplanned urban growth tendency. The paper evaluates suitable sites for urban green space development using the analytical hierarchy process (AHP) based multi-criteria analysis methods with geographical information systems (GIS). Various spatial datasets were obtained from several organizations and further processed on the GIS environment for suitable site evaluation. After the analytical hierarchy process of a pairwise comparison matrix was created and criteria weights were calculated for different factors. Variables taken for this study are school point data, health facility's location data, emergency service's locations, water bodies, emergency road network data, land use/land cover data, population data, distance to existing park, and slope. The unit of a study is a metropolitan city. Evaluations demonstrate the spatial distribution of different not suitable areas, less suitable , moderate suitable, and highly suitable area respectively, of the 4.47 %, 7.19 % of the area are high and moderate suitable area, while the largest area 78.87 % is less suitable and 9.47 % are not suitable for the development of green open space. This finding could contribute a planner for spatial planning of green space development in KMC.
Presentation of Andre Nassar for the "2nd Workshop on the Impact of New Technologies on the Sustainability of the Sugarcane/Bioethanol Production Cycle"
Apresentação de Marcos S. Buckeridge realizada no "2nd Workshop on the Impact of New Technologies on the Sustainability of the Sugarcane/Bioethanol Production Cycle"
Date / Data : Novr 11th - 12th 2009/
11 e 12 de novembro de 2009
Place / Local: CTBE, Campinas, Brazil
Event Website / Website do evento: http://www.bioetanol.org.br/workshop5
June 3, 2024 Anti-Semitism Letter Sent to MIT President Kornbluth and MIT Cor...Levi Shapiro
Letter from the Congress of the United States regarding Anti-Semitism sent June 3rd to MIT President Sally Kornbluth, MIT Corp Chair, Mark Gorenberg
Dear Dr. Kornbluth and Mr. Gorenberg,
The US House of Representatives is deeply concerned by ongoing and pervasive acts of antisemitic
harassment and intimidation at the Massachusetts Institute of Technology (MIT). Failing to act decisively to ensure a safe learning environment for all students would be a grave dereliction of your responsibilities as President of MIT and Chair of the MIT Corporation.
This Congress will not stand idly by and allow an environment hostile to Jewish students to persist. The House believes that your institution is in violation of Title VI of the Civil Rights Act, and the inability or
unwillingness to rectify this violation through action requires accountability.
Postsecondary education is a unique opportunity for students to learn and have their ideas and beliefs challenged. However, universities receiving hundreds of millions of federal funds annually have denied
students that opportunity and have been hijacked to become venues for the promotion of terrorism, antisemitic harassment and intimidation, unlawful encampments, and in some cases, assaults and riots.
The House of Representatives will not countenance the use of federal funds to indoctrinate students into hateful, antisemitic, anti-American supporters of terrorism. Investigations into campus antisemitism by the Committee on Education and the Workforce and the Committee on Ways and Means have been expanded into a Congress-wide probe across all relevant jurisdictions to address this national crisis. The undersigned Committees will conduct oversight into the use of federal funds at MIT and its learning environment under authorities granted to each Committee.
• The Committee on Education and the Workforce has been investigating your institution since December 7, 2023. The Committee has broad jurisdiction over postsecondary education, including its compliance with Title VI of the Civil Rights Act, campus safety concerns over disruptions to the learning environment, and the awarding of federal student aid under the Higher Education Act.
• The Committee on Oversight and Accountability is investigating the sources of funding and other support flowing to groups espousing pro-Hamas propaganda and engaged in antisemitic harassment and intimidation of students. The Committee on Oversight and Accountability is the principal oversight committee of the US House of Representatives and has broad authority to investigate “any matter” at “any time” under House Rule X.
• The Committee on Ways and Means has been investigating several universities since November 15, 2023, when the Committee held a hearing entitled From Ivory Towers to Dark Corners: Investigating the Nexus Between Antisemitism, Tax-Exempt Universities, and Terror Financing. The Committee followed the hearing with letters to those institutions on January 10, 202
The Roman Empire A Historical Colossus.pdfkaushalkr1407
The Roman Empire, a vast and enduring power, stands as one of history's most remarkable civilizations, leaving an indelible imprint on the world. It emerged from the Roman Republic, transitioning into an imperial powerhouse under the leadership of Augustus Caesar in 27 BCE. This transformation marked the beginning of an era defined by unprecedented territorial expansion, architectural marvels, and profound cultural influence.
The empire's roots lie in the city of Rome, founded, according to legend, by Romulus in 753 BCE. Over centuries, Rome evolved from a small settlement to a formidable republic, characterized by a complex political system with elected officials and checks on power. However, internal strife, class conflicts, and military ambitions paved the way for the end of the Republic. Julius Caesar’s dictatorship and subsequent assassination in 44 BCE created a power vacuum, leading to a civil war. Octavian, later Augustus, emerged victorious, heralding the Roman Empire’s birth.
Under Augustus, the empire experienced the Pax Romana, a 200-year period of relative peace and stability. Augustus reformed the military, established efficient administrative systems, and initiated grand construction projects. The empire's borders expanded, encompassing territories from Britain to Egypt and from Spain to the Euphrates. Roman legions, renowned for their discipline and engineering prowess, secured and maintained these vast territories, building roads, fortifications, and cities that facilitated control and integration.
The Roman Empire’s society was hierarchical, with a rigid class system. At the top were the patricians, wealthy elites who held significant political power. Below them were the plebeians, free citizens with limited political influence, and the vast numbers of slaves who formed the backbone of the economy. The family unit was central, governed by the paterfamilias, the male head who held absolute authority.
Culturally, the Romans were eclectic, absorbing and adapting elements from the civilizations they encountered, particularly the Greeks. Roman art, literature, and philosophy reflected this synthesis, creating a rich cultural tapestry. Latin, the Roman language, became the lingua franca of the Western world, influencing numerous modern languages.
Roman architecture and engineering achievements were monumental. They perfected the arch, vault, and dome, constructing enduring structures like the Colosseum, Pantheon, and aqueducts. These engineering marvels not only showcased Roman ingenuity but also served practical purposes, from public entertainment to water supply.
Francesca Gottschalk - How can education support child empowerment.pptxEduSkills OECD
Francesca Gottschalk from the OECD’s Centre for Educational Research and Innovation presents at the Ask an Expert Webinar: How can education support child empowerment?
Unit 8 - Information and Communication Technology (Paper I).pdfThiyagu K
This slides describes the basic concepts of ICT, basics of Email, Emerging Technology and Digital Initiatives in Education. This presentations aligns with the UGC Paper I syllabus.
Introduction to AI for Nonprofits with Tapp NetworkTechSoup
Dive into the world of AI! Experts Jon Hill and Tareq Monaur will guide you through AI's role in enhancing nonprofit websites and basic marketing strategies, making it easy to understand and apply.
Read| The latest issue of The Challenger is here! We are thrilled to announce that our school paper has qualified for the NATIONAL SCHOOLS PRESS CONFERENCE (NSPC) 2024. Thank you for your unwavering support and trust. Dive into the stories that made us stand out!
Model Attribute Check Company Auto PropertyCeline George
In Odoo, the multi-company feature allows you to manage multiple companies within a single Odoo database instance. Each company can have its own configurations while still sharing common resources such as products, customers, and suppliers.
A Strategic Approach: GenAI in EducationPeter Windle
Artificial Intelligence (AI) technologies such as Generative AI, Image Generators and Large Language Models have had a dramatic impact on teaching, learning and assessment over the past 18 months. The most immediate threat AI posed was to Academic Integrity with Higher Education Institutes (HEIs) focusing their efforts on combating the use of GenAI in assessment. Guidelines were developed for staff and students, policies put in place too. Innovative educators have forged paths in the use of Generative AI for teaching, learning and assessments leading to pockets of transformation springing up across HEIs, often with little or no top-down guidance, support or direction.
This Gasta posits a strategic approach to integrating AI into HEIs to prepare staff, students and the curriculum for an evolving world and workplace. We will highlight the advantages of working with these technologies beyond the realm of teaching, learning and assessment by considering prompt engineering skills, industry impact, curriculum changes, and the need for staff upskilling. In contrast, not engaging strategically with Generative AI poses risks, including falling behind peers, missed opportunities and failing to ensure our graduates remain employable. The rapid evolution of AI technologies necessitates a proactive and strategic approach if we are to remain relevant.
How to Make a Field invisible in Odoo 17Celine George
It is possible to hide or invisible some fields in odoo. Commonly using “invisible” attribute in the field definition to invisible the fields. This slide will show how to make a field invisible in odoo 17.
Macroeconomics- Movie Location
This will be used as part of your Personal Professional Portfolio once graded.
Objective:
Prepare a presentation or a paper using research, basic comparative analysis, data organization and application of economic information. You will make an informed assessment of an economic climate outside of the United States to accomplish an entertainment industry objective.
Palestine last event orientationfvgnh .pptxRaedMohamed3
An EFL lesson about the current events in Palestine. It is intended to be for intermediate students who wish to increase their listening skills through a short lesson in power point.
Instructions for Submissions thorugh G- Classroom.pptxJheel Barad
This presentation provides a briefing on how to upload submissions and documents in Google Classroom. It was prepared as part of an orientation for new Sainik School in-service teacher trainees. As a training officer, my goal is to ensure that you are comfortable and proficient with this essential tool for managing assignments and fostering student engagement.
3. FACTORS AFFECTING LOCATION & SITE
DECISIONS
1. Availability of raw material
2. Nearness to the potential market
3. Near to the source of operating requirements like
electricity, disposal of waste, drainage facilities.
4. Supply of labor
5. Transport & communication facilities
6. Integration with other group of companies
7. Suitability of land & climate
8. Availability of housing, other amenities & services
9. Local building & planning regulations
10. Safety requirements
11. Others like low interest on loans, special grants, living
standards
4. SELECTION OF THE SITE FOR THE
FACTORY
• Known as location analysis where firstly some
geographical area is selected & from that area a
particular site is selected for the establishment of the
plant.
Methods for the evaluation of plant location-
1. Involving quantitative factors-
a. Comparative cost chart
b. Dimensional analysis.
2.Comparison of qualitative factors.
5. COMPARATIVE COST CHART
• Is appropriate where the location problem concerns
the placement of a single plant. This is based on
location cost summary chart. A comparative chart of
total costs involved in setting up a plant of desired
size is prepared.
40
30
A
20 B
C
10 D
0
locations
6. • The total cost is represented by the height of column for
each location. we select a location for which total cost is
minimum.
• The cost summary chart has advantage of clarity in
presentation. but analysis is restricted to certain specified
factors only.
Least cost centre analysis-
Here transportation cost associated with various location
alternatives is considered.
Limitation of these techniques-
1.Choice of plant location assumed to be entirely dependent
upon minimization of operational costs.
2.Operational costs are assumed to be linearly related to
distance involved.
7. DIMENSIONAL ANALYSIS
It involves
1. calculation of the relative merits or cost
ratios for each of the factors,
2. giving each of the cost factor an appropriate
weightage by means of an index to which the
cost ratio is raised
3. & multiplying these weighted ratios in order
to arrive at a figure on the relative merits of
alternative sites.
8. • Let Cm1,Cm2,Cm3,…..Cmz are the costs associated with
site M for various cost factors. Cn1,Cn2,Cn3,…….Cnz
are of site N.W1,W2,W3,…….Wz are weightage for
various factors.
Merit of location M=(Cm1)W1*(Cm2)W2*…(Cmz)Wz
Merit of location N=(Cn1)W1*(Cn2)W2*…(Cnz)Wz
Relative merits of sites M & N are-
merit of M
merit of N
If this value is > 1, then select site M & vice-versa.
Advantages- it compares both subjective & objective factors
& gives a quantitative figure.
9. COMPARISON OF QUALITATIVE FACTORS.
• These are the factors to which cost values can’t be
assigned. Like lack of good schools, community
attitude. These can be termed as good or excellent.
FACTORS LOCATION A LOCATION B
labor adequate excellent
relation good Very good
education Good Very good
Clearly location B appears to be better one.
10. RANKING & WEIGHT METHOD
1. Various locations are ranked acc. To their
contribution
2. Various factors are assigned weights acc. To
their importance
3. Weights are then multiplied with rank
assigned
4. Total of these products for each location is
calculated
5. Location having max. total is then selected.
11. • Advantages &disadvantages of urban, rural &
sub-urban sites for a plant-
URBAN RURAL SUB-URBAN
Better transportation More water Planned industrial
Large labor supply Cheaper land Larger area
Big local market Lower taxes
Easy finance Few ordinances
Municipal services
Better civil attitude Labor stability
12. BACKWARD AREA & INDUSTRIAL POLICY
• In the facilities location problems, the industrial policies of the
governments are very important inputs in the overall
consideration. In India, the industrial development of backward
areas for balanced regional development of the country has
always been emphasized. This has been attempted mainly
through:
1. Licensing policy (practice of leasing a legally protected property to another
party )
2. Location of public sector projects
3. Investment subsidy (money granted by the State to keep down the price of
commodities)
4. Concessional finance (by IDBI, IFCI , ICICI)
5. Concession on income tax import duty etc and
6. Setting up of industrial estates (property consisting of much land )
13. BACKWARD AREA & INDUSTRIAL POLICY
Contd.
• All the districts in the country have been classified into four
categories:
– No industry districts,
– Moderately backward districts
– Least backward districts, and
– Non-backward districts
14. DISTRICT WISE DISTRIBUTION OF READYMADE
GARMENTS
(Source: Directorate of Industries and Commerce, Govt. of Karnataka, Bangalore)
15. DISTRICT WISE DISTRIBUTION OF READYMADE
GARMENTS
(Source: Directorate of Industries and Commerce, Govt. of Karnataka, Bangalore)
16. DISTRICT WISE DISTRIBUTION OF READYMADE
GARMENTS
(Source: Directorate of Industries and Commerce, Govt. of Karnataka, Bangalore)
17. PRODUCT GROUPING
• In Bangalore, garment units are mainly
concentrated in the following area
– Bommanahalli
– Bommasandra
– Peenya
– Yeswanthpur
– Rajajinagar Industrial Estate
23. GENERAL INFORMATION
• Coordinates: 13 17′31″N 77 32′35″E /
13.292 N 77.543 E
• Country: India
• State: Karnataka
• District: Bangalore Rural
• Population: 71,509 (2001)
• Time zone: IST (UTC+05:30)
• Codes
– Pin code-561 203
– Telephone- +08119
24. SOIL
• Red sandy soils derived from peninsular gneiss,
granites and laterites.
• red to brownish in color,
• shallow to fairly deep shallow,
• loamy to sandy loamy in texture intermixed with fairly large
amounts of coarse gravel and pebbles.
• favorable for growing crops like paddy, ragi,vegetables and
plantation crops.
25. CLIMATE AND RAINFALL
• Salubrious climate and free from extremes.
• Receives rainfall from southwest monsoon from June
to September, the northeast monsoon from October to
November.
• Relative humidity during June to October is between
80% to 85%.
• Normal rainfall- 849 mm,
– actual rainfall during last year- 752.4 mm, which is below
the normal rainfall.
– During last year, rainy days were 40 days.
26. CLIMATE AND RAINFALL
Description The Taluk Bangalore (R)
District
Raingauge Stations 8 44
Normal rainfall (in mm) 849 817
Actual rainfall (in mm) 752.4 1003
Normal Rainy days 47 50
Actual Rainy days (2010) 40 53
Source: District at a Glance, Bangalore (R)
27. ADMINISTRATIVE DIVISION
• 2-revenue sub-divisions
• Ramanagaram Sub-division
– Ramanagarm,
– Channapatna,
– Kanakapura and
– Magadi taluk
• Doddaballapur sub-division
– Doddaballapur,
– Devanahalli, Nelamangala and
– Hosakote taluks.
• Taluk panchayat is incharge of development works under overall supervision of
Bangalore (Rural), Zilla Panchayat.
• 5 hoblies, 277 inhabited villages, 29 Gram Panchayats, one town / urban
agglomeration and one city / town municipality.
28. DEMOGRAPHIC DETAILS
Description Doddaballapura Bangalore (R)
Taluk District
Total Population 268332 8,81,500
Population – Male 137541 9,62,200
Population - Female 130791 9,19,300
Urban: Rural Population 29%: 71% 22%: 78%
Pop. Scheduled Caste 54728 (20%) 4,07,400 (46%)
Pop. Scheduled Tribe 11609 (4%) 3,77,600 (43%)
Density (Per sq.km) 344 321
Growth Rate - 1991-2001 19.45% 14.7%
Sex Ratio ( F : M) 951:1000 955 : 1000
Literacy – Total 69.1 % 64.7 %
Literacy - Male 79% 74%
Literacy - Female 58.8% 55%
Source: District at a Glance, Bangalore (R)
30. AVAILABILITY OF RAW MATERIAL
• Fabrics, which are required for these industries are
available from
– Salem,
– Erode,
– Chennai,
– Mumbai,
– Ahmadabad and
– Local suppliers (Agents).
31. AVAILABILITY OF SPACE
• 10 industrial estate developed by KSSIDC.
• KIADB is also providing the necessary support by
giving plots to the industries for construction.
• Private industrial estates.
32. LAND USAGE (AREA – HE)
Description Doddaballapura Bangalore (R) Taluk as %
Taluk District to Dist.
Forest Land 3895 (5%) 81268 5
Land not available for 14589 (19%) 94003 16
cultivation
Other un-cultivated land 8440 (10%) 53022 16
Fallow lands 4607 (6%) 50730 9
Cropped Area 47229 (60%) 306408 15
Total 79969 585431
Source: District at a Glance, Bangalore (R)
33. LAND USAGE (AREA – HE)
Forest Land not available for cultivation
Other Uncultivated Land Fallow Lands
Cropped Area
5% 18%
60%
10%
6%
Source: District at a Glance, Bangalore (R)
35. SKILLED LABOUR
• Low-income group of family adopted tailoring as the
main source of income for their livelihood.
• Tailors are abundantly available.
• Ready to be paid on the basis of piece-rate system.
• Hard-working.
40. INDUSTRIAL FACILITATION PLAN FOR 2006-
11
Type of No of Total Debt Equity Debt equity
industry industry investment (crores) (crores) ratio
(crores)
Tiny & SSI 1000 240 96 144 1.5:1
Medium & 162 1370 685 685 1:1
large
•Employment- 85000 (direct) & 35000 (indirect)
•Industrial area to be developed- 783 acres (estimate cost- Rs. 391 crores)
•Power requirement- 86 MW (estimated cost of generation & transmission- Rs. 688
crores)
•Water requirements- 39 lakhs litres/day (Possibilities of meeting industrial water
requirement from the BWSSB (Cauvery river sources) / other sources could be
explored.)
41. DETAILS & FUND REQUIREMENTS FOR INDUSTRIAL
PROMOTIONAL PROGRAMMES (2006-11)
Sl. No. Details No. of Candi- No. of No. of Progra- Cost Total
dates Candidates/ mmes (Rs. lakhs/ Prog.) (Rs. lakhs)
Programme
A Capacity Building
1 Entrepreneurship Awareness 3500 250 14 1.00 14.00
(EAP)
2 Entrepreneurship Development 800 50 16 3.00 48.00
Programme EDP)
3 Skill Development Programme 1800 25 72 1.00 72.00
(SDP)
4 Management Development 150 25 6 1.50 9.00
Programme (MDP)
5 Export Training Programme 120 20 6 1.50 9.00
Total 'A' 6370 114 152.00
B Facilitation Services
1 Consultancy & Mentoring Lumpsum @ Rs.12.00 lakh per annum 60.00
Services for 5 years.
2 Market Intelligence Report Lumpsum @ Rs. 40.00 lakh per annum 200.00
for 5 years.
3 Buyers' / Sellers' Meet, Trade Lumpsum @ Rs. 2.00 lakh per annum 10.00
Fair, etc. for 5 years.
Total 'B' 270.00
Grand Total (A+B) 422.00
42. FUND REQUIREMENTS
• Tiny and small scale industries :Rs. 239.34 crores
• Large & Medium industries :Rs. 1372.85 crores
• Power infrastructure – 86 MW :Rs. 688.00 crores
• Industrial Area (783 acres) :Rs. 391.00 crores
• Industrial Promotional Progrms :Rs. 4.22 crores
• Total fund requirement :Rs. 2695.41 crores
43. INDUSTRIAL FACILITATION PLAN – FUNDING
PATTERN
Amount (Rs. crores)
Unit
Particulars Govt
(Nos.) Total Equity** Credit
.
A. Investment for Industrial Development
Tiny & SSI Units 1041 239.34 - 95.74 143.60
Large & Medium Industries 162 1372.85 - 686.42 686.43
Sub Total-A 1203 1612.19 - 782.16 830.03
B. Industrial Infrastructure Development
Industrial area Development 783 (acres) 391.00 - - -
Power 86 MW 688.00 - - -
Sub Total-B 1079.00
C. Industrial Promotional Programmes
a) Capacity Building 5280* 1.52 1.52 - -
b) Facilitation Services 2.70 2.70 - -
Sub total-C 4.22 4.22
Grant total (A+B+C) 2695.41 4.22
* No. of participants. ** Including subsidy if any.
44. PHASING OF FUNDS - YEAR-WISE REQUIREMENTS
Sl. Particulars Total Year
No. 2006-07 2007-08 2008-09 2009-10 2010-11
A. Development of Tiny / SSI, Medium & Large Scale Industries
1. No. of Tiny / SSI units 1041 156.15 208.2 260.25 260.25 156.15
2. Investment in Tiny / SSI units 239.34 35.90 47.87 59.84 59.84 35.90
(Rs. crores)
3. No. of Medium /Large Inds. 162 24.30 32.40 40.50 40.50 24.30
4. Investment in Medium / Large 1372.85 205.93 274.57 343.21 343.21 205.93
Industries
(Rs.crores)
B. Industrial Infrastructure Development
1 Industrial area development – 391.00 234.60 156.40 - - -
783 acres (Rs. crores)
2 Power – 86 MW 688.00 412.80 275.20 - - -
(Rs. crores)
C. Industrial Promotional Programmes
1 Capacity Building 1.52 0.23 0.30 0.38 0.38 0.23
( Rs. crores)
2 Facilitation Services 2.70 0.41 0.54 0.68 0.68 0.41
( Rs. crores)
46. Description Doddaballapur Bangalore (R) Dist. Taluk as % to
a Taluk District
Area in Sq. Kms. 779.87 5860.45 13
Hoblis (Nos.) 5 35 14
Villages (2001 census) (Nos.)
In habited (2003-04) 277 1719 16
Town/Urban Agglomeration 1 4 25
T.Ps/TMCs/CMCs 0 5 0
Gram Panchayats 29 228 13
47. Description Doddaballapur Bangalore (R) Dist. Taluk as % to
a Taluk District
Population (Nos.)
Total 268332 1881500 14
Male 137541 962200 14
Female 130791 919300 14
Rural 190554 1474118 13
Urban 77778 407396 19
Urban : Rural 29% :71 % 28% : 72%
48. Description Doddaballap Bangalore (R) Taluk as % to District
ura Taluk Dist.
Literacy Rate % (2001 census)
Total 69.1 64.7
Male 79 74
Female 58.8 55
Relative Index
Sex Ratio ( F:M) 951:1000 955:1000
Population density 344 321
(Nos./Sq.Km)
Growth Rate (1991-2001) 19.45% 12.42%
Work force
Agri cultivators 48596(38%) 369102 13
Agri labourers 23954(19%) 182197 13
House hold industry workers 11339(8%) 42451 27
Others 43954(35%) 298781 15
Total 127843 892531 14
49. Description Doddaballapura Taluk Bangalore (R) Taluk as % to
Dist. District
Land Use (in Ha)
Forest Land 3895(5%) 81268 5
Land not available for 14589(19%) 94003 16
cultivation
Other un-cultivated land 53022 16
8440 (10%)
Fallow lands 4607 (6%) 50730 9
Cropped Area 47229(60%) 306408 15
Total 78760 585431 14
50. Description Doddaballapura Bangalore (R) Taluk as % to
Taluk Dist. District
Net Area Irrigated (Ha)
Tanks 2214 15198
Wells 1879 13844
Tube Wells 5716 34188
Canals 0 6590
Others 0 900
Total 9809 70720 14
Existing Infrastructure- Railway line (in Kms.)
Length of Railway Line 20 105
–
Broad gauge
Railway Stations (nos.) 2 22
51. Description Doddaballapura Bangalore (R) Taluk as % to
Taluk Dist. District
Roads (in Kms.)
National Highway 31 276
State Highway 69 374
District Major Roads 148 1202
Other District Roads 13.4 47.6
Village Roads 5017 6964.4
T.D.B Roads 0 550
Municipality Roads 47.25 627.25
Irrigation Roads 0 124
Panchayat Roads 0 647
Total 5325.65 12664.25 49
52. Description Doddaballapura Bangalore (R) Taluk as % to
Taluk Dist. District
Communication (Nos.)
Post Offices 39 313 12
Telegraph Offices 11 82 13
Telephone Exchanges 12 88 14
Phones in use 9022 64800 14
No. of Telephones / 34 34
1000 persons
No. of Telephones/100 1157 1106
sq.km.area
Transport Vehicles (31.03.2004)
Motorcycles 7164 57310
Cars 853 10897
Auto rickshaws 131 5529
53. Description Doddaballapura Bangalore (R) Taluk as % to
Taluk Dist. District
Commercial Infrastructure (Banks (2002-03) (Nos.)
Commercial Banks 11 80
Rural Banks 3 25
Urban Co-operative 1 4
Banks
Primary Agriculture 1 8
Development Banks
Total 16 117 14
54. Description Doddaballapura Bangalore (R) Taluk as % to
Taluk Dist. District
Education Infrastructure (Nos.)
Primary Schools 406 2825
High Schools 39 364
PU Colleges 6 62
Degree Colleges 2 10
Polytechnic Colleges 0 3
Engineering Colleges 1 5
Medical Colleges 0 0
Dental Colleges 0 0
Total Schools / Colleges 454 3269 14
55. Description Doddaballapura Bangalore (R) Taluk as % to
Taluk Dist. District
Health Infrastructure (Nos.)
Allopathic Hospitals 1 8
Private Hospitals & 2 24
Nursing Homes
Primary Health Centres 9 69
Primary Health Units 7 30
Dispensaries
Allopathic 0 0
Family welfare centers 2 12
Family welfare sub- 68 398
centres
Medical Stores 64 422
Total 134 963 14
56. Description Doddaballapura Bangalore (R) Taluk as % to
Taluk Dist. District
Sericulture (as on
2004)
Chawki Rearing Centres 4 82 5
Seeds Storage 2 253 1
Mulberry cultivated area 881 16073 5
Ha)
Cocoon Production (MT) 779 13663 6
No. Farmers engaged in 1636 40491 4
this activity
Value of silk produced 7.8 144.00 5
(Rs. Lakh)
57. Description Doddaballapura Bangalore (R) Taluk as % to
Taluk Dist. District
Industrial Infrastructure (Nos.)
Industrial Estates & Areas
Industrial Estates 1 7 14
Industrial Areas 2 5 40
No. of VISHWA Sheds constructed
No. of Sheds allotted 5 53 9
No. of sheds vacant - 5
58. Description Doddaballapura Bangalore (R) Taluk as % to
Taluk Dist. District
Tiny & SSI (as on March, 2006)
No. of Units 4183 19254 22
Investment (Rs. lakhs) 7385 38052 19
Employment (Nos.) 11398 80400 14
Large & Medium Industries
No. of units 23 80 29
Investment (Rs. In Lakhs) 32820 153232 21
60. Area & Sources of water
Description Doddaballapur Bangalore (R) District Taluk as % to
Taluk District
Surface Water
Tanks 2214 15198
Canals 0 6590
Others 0 900
Sub Total 2214 (23%) 22688
Underground Water
Tube Wells 5716 34188
Wells 1879 13844
Sub Total 7595 (77%) 48032
Total 9809 70720 14
Source: District at a Glance, Bangalore (R)
61. Human Resources
48596
43954 (38%)
(35%)
Agri Cultivators
Agri Labourers
Household Industry
workers
Other Workers
11339
(8%) 23954
(19%)
Source: Dept. of Employment Exchange, Bangalore.
62. Human Resources (Persons registered in
Employment Exchange.)
Details As on 31.3.2005 % to total
I. Below Matriculation
Male 1871
Female 428
Sub-total (I) 2299 12
II SSLC, PUC, BA, B.Sc, B.Com. Degree 15090 78
holders, , Nursery trained, etc.
III ITI, Dip. Holders, Drivers etc.,
Male 1834
Female 105
Sub-total (III) 1939 10
Total ( I+II+III) 19328 100
Source: Dept. of Employment Exchange, Bangalore.
63. Educational Facilities
Details No. of Institutions Intake of Students
Degree College 2 1261
Engineering College 1 176
ITIs 1 16
Source: District at a Glance, Bangalore (R)
65. EXISTENCE OF AIRPORT/CARGO
CONTAINER DEPOT/INFRASTRUCTURE
• Silicon valley of India have all the facilities of
handling passengers and presence of cargo container
department further facilitated the growth of the
cluster.
• 40 km from Bangalore towards North on Bangalore-
Hindupur state highway (SH-9)
• Proximity of Chennai Port & international airport.
66. ROAD LENGTH-COMPARISON-
TALUK/DISTRICT
Description Doddaballapura Bangalore (R)
Taluk District
National Highway 31 276
State Highway 69 374
District Major Roads 148 1202
Other District Roads 13.4 47.6
Village Roads 5017 6964.4
T.D.B Roads 0 550
Municipality Roads 47.25 627.25
Total Roads 5325.65 10812.25*
Road Length -Taluk as % to Dist : 49
Road length/100 Sq.km. area 682 KM 184 KM
Source: District at a Glance, Bangalore (R)
67. VEHICLES REGISTERED-COMPARISON-
TALUK/DISTRICT
Description Doddaballapura Bangalore (R) District
Taluk
Motorcycles 7164 57310
Cars 853 10897
Auto rickshaws 131 5529
Goods Carriages 756 7171
Others 833 11849
Total Vehicles 9737 92756
Vehicles - Taluk as % to Dist: 10
No. of vehicles / 1000 persons 36 49
Source: District at a Glance, Bangalore (R)
68. Railways
• Broad gauge line (20 Kms) connecting Bangalore and Hyderabad city
passes through the district.
Seaports
• Nearest seaport - Mangalore- 340 kms
• Chennai Seaport- 380 kms.
• The existing Mangalore Port is an all weather port-providing gateway
for exports trade throughout the year.
Airport
• Nearest airport- Bangalore- 40 kms.
• provides gateway to major cities of the country and countries such as
UK, Germany, Baharin, Muscat, Sharjah, Singapore, Bangkok,
Koulalampur, Frankfurt, Paris, etc, as there are many operational
domestic and international flights.
• include both passengers and cargo flights.
69. Details of Cargo flights operating from Bangalore
Sl. Name of the flight Sl. Name of the flight
No. No.
1 Air France 17 Kuwait Airlines
2 Air India 18 Lufthansa Airlines
3 Air Italia 19 Malaysian Airlines
4 Aviators (India) Pvt. Ltd., 20 OM Freight Forwarders
5 Blue Dart 21 Oscar Freight (CCLT)
6 British Airways ( CCLT) 22 Oscar Freight (Sreeji)
7 Cargolux – Shreeji Truck 23 Polar Air Cargo
8 Das Air Cargo – Shreeji Trucking 24 Qatar Airways (CCLT)
9 EL AL Israel Airlines 25 Royal Nepal Airlines
10 Emirates Sky Cargo 26 Sahara Airlines
11 Emirates Truck (AFL) 27 Saudi Arabian – CCLT
12 Emirates Truck ( CCLT) 28 Serendib Airlines – (CCLT)
13 Gulf Air 29 Sri Lankan Airlines
14 India Airlines 30 Thai Airlines
15 Jet Airways 31 Transmile Air
16 Korean Airlines 32 United Parcel Service
70. POST AND TELECOM FACILITIES
Post offices 50
Telephone Exchanges 13
Telephones connected 6011
Telegraph Offices 14
Other private operators are also offering courier and telecommunication
services, STD / ISD & Internet facility
71. INDUSTRIAL AREA & TEXTILE PARKS
Sl.No Location Extent of land No. of Prevailing Remarks
. developed plots land price
(acres) (Rs. lakhs)
1. Industrial area, 330.62 98 12.00 Implemented
Doddaballapura
2. Apparel Park, 187 28 14.50 Implemented
Doddaballapura
3. Integrated Textile 732 103 Not yet fixed Under
Park Implementation
72. FINANCIAL INSTITUTIONS
Banks Nos.
Commercial Banks 11
Rural Banks 3
Primary Land Development Banks 1
Total 15
73. FINANCIAL DISBURSEMENTS BY KSFC
2004-05 2005-06
Sl. No. Taluk No. of Amount No. of Amount
Units (Rs. lakhs) Units (Rs. lakhs)
1 Devanahalli 5 30.20 1 3.96
2 Hosakote 14 179.10 13 223.84
3 DoddaBallapu 9 81.66 8 69.50
r
4 Kanakapura 2 18.50 3 72.26
5 Channapatna 5 74.00 7 71.86
6 Nelamangala 5 52.50 3 100.00
7 Channapatna 1 8.00 3 29.44
8 Magadi 2 12.48 2 11.70
Total 43 456.44 40 582.56
74. STATE / CENTRAL LEVEL SECTORAL
DEVELOPMENT CORPORATIONS
• Karnataka State Powerloom Development Corporation Ltd.
(KSPDC)
• Karnataka State Khadi & Village Industries Board (KSK &
VIB)
• Karnataka Leather Industries Development Corporation Ltd.,
(LIDKAR)
75. DODDABALLAPUR INTEGRATED TEXTILE
PARK (DITPL)
• Rs 250-crore- expected to become one of the
country's important power-loom clusters.
• Inaugurated in July 2010 by the Union textile
minister Dayanidhi Maran.
• Will provide employment to 8,000 people.
• Spread across 48 acres
– will ensure processing and pre-weaving facilities.
76. DODDABALLAPUR INTEGRATED TEXTILE
PARK (DITPL)
• 75 weaving units
• 600 looms
• Eight apparel factories
• 500 sewing machines owned and operated by members
of the units
• 41 units are expected to be operational by this year-
end.
77. APPAREL PARK PHASE II AND III
• Development of Apparel Park Phase II (265.30 acres)
and III (750 acres) at Doddaballapur by KIADB.
78. POWER SUPPLY
• Power supply by BESCOM, HESCOM, MESCOM &
CESCOM.
• Water, Power, Common effluent treatment plants,
Telecommunication etc. by KIADB
79. POWER GRID FACILITY
Location Voltage Capacity Peak load in Loading
Class Transformers (in MW for the factor
MVA.) year 2005-06
Doddaballapura 220/11 100 57 0.67
220/11 50 51 1.20
'D' Cross 66/11 20 17.4 1.02
(Doddaballapura)
66/11 12.5 8.2 0.77
66/11 8 7 1.03
Doddabelavangala 66/11 8 5.88 0.86
66/11 8 6.75 0.99
KIADB 220/110 50 9 0.21
(D B Pura)
66/11 20 8.66 0.51
66/11 20 9.15 0.54
Total 296.5
80. DODDABALLAPUR - POWER CONSUMPTION
DETAILS
136.28
(14.50%)
186.76
Domestic
21%) Industrial
Commercial
548.19 IP sets
(61%)
Street Light &others
23.68
(3%)
0.23
(0.50%)
82. DEVELOPMENT AND ECONOMY
• One of the largest silk producers in India.
• A very big industrial area (Bashettihalli- 6 km from
Doddaballapur.)
• The government of Karnataka recently started a 100
crore silk city in
Doddaballapur, Muddenahalli, and Kanivenarayanapur
a.
• The site of the upcoming $22 billion, 12,000-acre
(49 km2) BIAL IT Investment Region,
• the largest IT region in India and one the largest
infrastructure projects in Karnataka's history.
83. GOVERNMENTS INITIATIVES FOR
DEVELOPMENT OF THE SECTOR
• Credit linked Capital Subsidy
• Entry Tax Reimbursement
• Stamp Duty reimbursement
• Land Acquisition / Allotment through KIADB/KSSIDC
• Common infrastructure for Greenfield Textile Parks
• Power subsidy
• Common Effluent Treatment Plant and Hazardous
waste disposal facility
• Capacity building support
85. GROWTH OF TINY & SSI UNITS
Particulars As on Percentage
31.3.2001 31.3.2006 Increase
No. of Units 3597 4183 16%
Investment (Rs. Lakhs) 4911 7385 50%
Employment (Nos.) 8466 11398 35%
Average investment /unit 1.37 1.77
(Rs. lakhs)
Average Employment / 2.35 2.73
unit (Nos.)
Average Employment / 1.72 1.54
investment (Rs.lakh)
86. GROWTH OF TINY & SSI UNITS
12,000 11,398
31.03.2001
10,000
31.3.2006
8,466
8,000 7,385
6,000
4,911
4,183
4,000 3,597
2,000
1
0
No. of Units Investment (Rs. Lakhs) Employment (Nos.)
87. YEAR WISE REGISTRATION OF TINY &
SSI UNITS
Year No. of units Investment (Rs. Employment
lakhs) (Nos.)
2001-02
176 590 737
2002-03
110 236 498
2003-04
127 292 401
2004-05
74 209 161
2005-06
99 1147 135
88. No. of units registered during the year
200
176
180
160
140 127
120 110
99
100
80 74
60
40
20
0
2001-02 2002-03 2003-04 2004-05 2005-06
89. Investment made during the year- (Rs. Lakhs) (Tiny / SSI)
1400
1200 1147
1000
800
590
600
400
292
236 209
200
0
2001-02 2002-03 2003-04 2004-05 2005-06
90. Employment generated during the year (Tiny / SSI) -
Nos.
1200 1135
1000
800 737
600
498
401
400
200 161
0
2001-02 2002-03 2003-04 2004-05 2005-06
91. SECTOR WISE BREAK-UP OF TINY & SSI
UNITS
Category of Units No. of Units Employment (Nos.)
Textiles. 26 78
Job Work & 59 93
Services
Misc. products 14 58
Total 99 229
92. DODDABALLAPURA -EXISTING LARGE &
MEDIUM INDUSTRIES
Sl. Name & Address of the Year of Investment Products Employm
No. Unit Establi- (Rs. in ent. (nos.)
shment Crores.)
1 M/s. Suprajit Engineering 1997 5.79 Speedometer 50
Limited, Tachometers
2 M/s. Tractors & Farm 1997 37.28 Tractors 126
Equipment Limited
3 M/s. Otto Biz India 1995 10.5 Tapping chucks 142
Private Limited & adopter
4 M/s. Rittal Bir Private 1997 30 Pressed/Punche 152
Limited. d Sheet metal
5 M/s. Tulsiyan NEC 1987 22 HDPE/PP 455
Limited Wooven Sacks
6 M/s. Aditya Horological 1987 2.5 Watch crystals 89
Limited. & Key buttons
93. DODDABALLAPURA -EXISTING LARGE &
MEDIUM INDUSTRIES
Sl. Name & Address of the Year of Investment Products Employm
No. Unit Establi- (Rs. in ent. (nos.)
shment Crores.)
7 M/s. Doddaballapura 1964 7 Cotton Yarn 160
Spinning Mills.
8 M/s. Gogo Exports 1995 7.00 Processed 210
Private Limited. fabrics
9 M/s. .Himoap Foods 2001 2.5 Fruit pulp 18
Private Limited.
10 M/s. Grover Wine Yard 1988 7 Wine 30
Limited.
11 M/s. Indane India Private 1999 Herbal 30
Limited. Extractions
12 M/s. Karnataka State 1987 1.07 Energy foods 50
Agro Com Products
Limited.
94. DODDABALLAPURA -EXISTING LARGE &
MEDIUM INDUSTRIES
Sl. Name & Address of the Year of Investment Products Employm
No. Unit Establi- (Rs. in ent. (nos.)
shment Crores.)
13 M/s. Himatsinga Seide 1987 15.04 Natural Silk 612
Limited. fabrics
14 M/s. BPL Limited. 1989 10 Printed Circuit 106
Board
15 M/s. BPL Sanyo 1990 70.85 VCD 108
Technologies Limited.
16 M/s. Aditya Auto 1998 5.17 Window glass 73
Engineering Products regularols
India Private Limited.
17 M/s. Hindustan Gas and - 2.18 Argan Gas 18
Industrial Limited.
18 M/s. Srishma Fine - 44.32 Aspirin powder, 228
Chemicals and acetic acid
Pharmaceuticals Ltd.
95. Doddaballapura -Existing Large & Medium
Industries
Sl. Name & Address of the Year of Investment Products Employm
No. Unit Establi- (Rs. in ent. (nos.)
shment Crores.)
19 M/s. Buildmet Fibre 1985 3 HDP Woven 98
Limited. Sacks
20 M/s. Indian Opthalmic 1998 33 Lenses 106
Lenses Private Limited.
21 M/s. Danim Works, 2002 Readymade 405
Garments
22 M/s.Birla Super Bulk 1989 25 Cement 36
Terminal. Packing
23 M/s. Fusion Apparels. 1997 9.5 Readymade 154
Garments
19 M/s. Buildmet Fibre 1985 3 HDP Woven 98
Limited. Sacks
96. SECTOR WISE CLASSIFICATION OF SWA
CLEARED PROJECTS FROM APRIL 2001 TO JULY
2006
No. of Units Investment Employment
Category of
% to Rs. % to % to
Industries No. No.
total lakhs total total
Textiles 29 72.5 33565 92.00 26252 63.00
Construction materials
1 2.5 29 0.01 200 0.50
Infrastructure /
5 12.5 2127 6.00 11,795 28.00
Tourism
Printing and Stationery
2 5 142 0.50 1300 3.00
Chemical /
1 2.5 150 0.50 450 1.00
Pharmaceutical
Electrical &
2 5 358 0.99 2000 4.50
Electronics
Total 40 100 36,371 100 41,997 100
99. • The reputation of Bangalore as a preferred global destination,
particularly for hi-tech, knowledge industries and land-intensive
industrial projects.
• Houses a substantial percentage of Fortune 500 Companies and
other MNCs in diverse sectors such as aerospace, apparel,
automobile, food processing, IT enabled services, etc..
• The flow of investment into Bangalore (Urban) will be
constrained due to non-availability / expensive land.
• Presently ranked fourth in terms of industrial investment among
the 27 districts of Karnataka.
100. • The State Cabinet has approved the Mega Plan envisaged by
Bangalore Metropolitan Regional Development Authority
(BMRDA) for infrastructure development of Bangalore Urban
& Rural Districts. Some industries are expected to be re-
located from Bangalore (Urban) to Bangalore (Rural).
• The Mega Plan also proposes a network of 8-lane / 6-lane 734 km. roads comprising
284 km. Satellite Towns Ring Road (STRR), 188 km. Intermediate Ring Road (IRR)
and 262 km. Radial Roads], to improve connectivity to all the taluks of Bangalore
Rural District.
• Broad-gauge rail connectivity through Bangalore.
• Creation of logistic for Information Technology / Floriculture
/Textiles.
101. • Exclusive apparel and integrated textile parks facilitate for
establishment of more Tiny and SSI units in Textile/Garment
sector.
• The Taluk is hub of powerloom industry (presence of 10,000 weavers, 25,000
powerlooms) supported by a Powerloom service center.
• Presence of many medium and large-scale textile / garment
manufacturing units. In addition to this, about 55 medium and
large-scale industries (cleared by State Single Window Agency)
are being established at Doddaballapura.
• The emerging investment destination for industrial segments
such as pharmaceuticals, biotechnology, automobiles & auto
components, aerospace, apparel, machine tools, precision
components, tooling, food processing, floriculture, etc., because
of the proximity to Bangalore and due to the constraint on the
availability of land in Bangalore Urban District.
• Has developed industrial base (presence of small, medium and large scale industrial
units).
103. • Inadequate power infrastructure.
• Lack of local entrepreneurship.
• Absence of perennial source of water & depleted groundwater
sources.
• Mediocre socio-economic infrastructure.
• Poor maintenance of interior roads.
• Obsolete and conventional technology adopted in powerloom
industry.