SlideShare a Scribd company logo
1 of 8
Download to read offline
(Tension) 
(Compression) 
 
How strain gages work. 
Strain, Stress, and Poisson's Ratio 
When a material receives a tensile forceP, it has a stress σ that 
corresponds to the applied force. In proportion to the stress, 
the cross-section contracts and the length elongates by ΔL 
from the length L the material had before receiving the tensile 
force (see upper illustration in Fig. 1). 
Fig. 1 
The ratio of the elongation to the original length is called a 
tensile strain and is expressed as follows: 
ε = ΔL 
L ε: Strain 
L: Original length 
ΔL: Elongation 
See the lower illustration in Fig. 1. If the material receives a 
compressive force, it bears a compressive strain expressed as 
follows: 
ε = –ΔL 
L 
For example, if a tensile force makes a 100mm long material 
elongate by 0.01mm, the strain initiated in the material is as 
follow: 
ε = ΔL = 0.01 = 0.0001 = 100 x10–6 
L 100 
Thus, strain is an absolute number and is expressed with a 
numeric value plus x10–6 strain, με or μm/m. 
The relation between stress and the strain initiated in a 
material by an applied force is expressed as follows based on 
Hooke's law: 
σ = Eε σ: Stress 
E: Elastic modulus 
ε: Strain 
Stress is thus obtained by multiplying strain by the elastic 
modulus. When a material receives a tensile force, it elongates 
in the axial direction while contracting in the transverse 
direction. Elongation in the axial direction is called longitudinal 
strain and contraction in the transverse direction, transverse 
strain. The absolute value of the ratio between the longitudinal 
strain and transverse strain is called Poisson's ratio, which is 
expressed as follows: 
ν = ε2 
ε1 ν: Poisson's ratio 
ε1: Longitudinal strain ΔL or – ΔL (Fig. 1) 
L L 
ε2: Transverse strain – ΔD or ΔD (Fig. 1) 
D D 
Poisson's ratio differs depending on the material. For refer-ence, 
major industrial materials have the following mechanical 
properties including Poisson's ratio. 
Mechanical Properties of Industrial Materials 
Shearing 
Modulus 
G (GPa) 
Tensile 
Strength 
(MPa) 
Poisson's 
Ratio 
ν 
Material 
Carbon steel (C0.1 - 0.25%) 
Carbon steel (C  0.25%) 
Spring steel (quenched) 
Nickel steel 
Cast iron 
Brass (casting) 
Phosphor bronze 
Aluminum 
Concrete 
363 - 441 
417 - 569 
588 - 1667 
549 - 657 
118 - 235 
147 
431 
186 - 500 
— 
0.28 - 0.3 
0.28 - 0.3 
0.28 - 0.3 
0.28 - 0.3 
0.2 - 0.29 
0.34 
0.38 
0.34 
0.1 
78 
79 
79 - 81 
78 
40 
29 
43 
27 
9 -13 
Young's 
Modulus 
E (GPa) 
205 
206 
206 - 211 
205 
98 
78 
118 
73 
20 - 29 
Principle of Strain Gages 
Each metal has its specific resistance. An external tensile force 
(compressive force) increases (decreases) the resistance by 
elongating (contracting) it. Suppose the original resistance is R 
and a strain-initiated change in resistance is ΔR. Then, the 
following relation is concluded: 
ΔR = Ks ΔL = Ks.ε 
R L 
where, Ks is a gage factor, the coefficient expressing strain 
gage sensitivity. General-purpose strain gages use copper-nickel 
or nickel-chrome alloy for the resistive element, and the 
gage factor provided by these alloys is approximately 2. 
Types of Strain Gages 
Types of strain gages include foil strain gage, wire strain gage 
and semiconductor strain gage. 
Structure of Foil Strain Gage 
The foil strain gage has metal foil photo-etched in a grid 
pattern on the electric insulator of the thin resin and gage 
leads attached, as shown in Fig. 2 below. 
Fig. 2 Base length 
Example of KFG gage 
Laminate 
Metal foil Laminate film 
Base 
Bonded surface 
Center mark 
Base 
Grid width 
Base width 
Grid length (strain sensing part) 
(Gage length) 
Gage lead (silver-clad copper wire, 
0.12 to 0.16mmφ and 25mm long) 
1
The strain gage is bonded to the measuring object with a 
dedicated adhesive. Strain occurring on the measuring site is 
transferred to the strain sensing element via the gage base. 
For accurate measurement, the strain gage and adhesive 
should match the measuring material and operating conditions 
including temperature. For the method of bonding the strain 
gage to metal, refer to Page 8. 
Principle of Strain Measurement 
Strain-initiated resistance change is extremely small. Thus, for 
strain measurement a Wheatstone bridge is formed to convert 
the resistance change to a voltage change. Suppose in Fig. 3 
resistances (Ω) are R1, R2, R3 and R4 and the bridge voltage (V) 
is E. Then, the output voltage eo (V) is obtained with the 
following equation: 
Suppose the resistance R1 is a strain gage and it changes by 
ΔR due to strain. Then, the output voltage is, 
R4 R3 
Strain gage 
R1 R2 
Bridge voltage E 
Strain gage 
Rg 
Strain gage 
Rg 
Active gage 
Active gage 
Active gage 
Dummy gage 
R R 
R 
R 
R 
R 
R R 
R 
R 
Rg2 
Rg1 
E 
E 
E 
eo 
eo 
eo 
eo 
Output voltage eo 
eo = R1R3 – R2R4 . E 
(R1 + R2) (R3 + R4) 
eo = (R1 + ΔR)R3 – R2R4 . E 
(R1 + ΔR + R2) (R3 + R4) 
If R1 = R2 = R3 = R4 = R, 
eo = R2 + R ΔR – R2 . E 
(2R + ΔR) 2R 
Since R may be regarded extremely larger than ΔR, 
eo ≒ 1 . ΔR . E = 1 . Ks . ε . E 
4 R 4 
Thus obtained is an output voltage that is proportional to a 
change in resistance, i.e. a change in strain. This microscopic 
output voltage is amplified for analog recording or digitial 
indication of the strain. 
Fig. 3 
Strain-gage Wiring Systems 
A strain-gage Wheatstone bridge is configured with 1, 2 or 4 
gages according to the measuring purpose. The typical wiring 
systems are shown in Figs. 4, 5 and 6. For varied strain-gage 
bridge formation systems, refer to Bridge.pdf. 
1-gage system 
With the 1-gage system, a strain gage is connected to a side 
of the bridge and a fixed resistor is inserted into each of the 
other 3 sides. This system can easily be configured, and thus it 
is widely used for general stress/strain measurement. The 1- 
gage 2-wire system shown in Fig. 4-1 receives much influence 
of leads. Therefore, if large temperature changes are antici-pated 
or if the leadwire length is long, the 1-gage 3-wire 
system shown in Fig. 4-2 must be used. For the 1-gage 3-wire 
system, refer to Method of Compensating Temperature Effect 
of Leadwire (Page 5). 
Fig. 4-1 Fig. 4-2 
2-gage system 
With the 2-gage system, 2 strain gages are connected to the 
bridge, one each to the 2 sides or both to 1 side; a fixed resis-tor 
is inserted into each of the other 2 or 3 sides. See Figs. 5-1 
and 5-2 below. There exist the active-dummy method, where 
one strain gage serves as a dummy gage for temperature 
compensation, and the active-active method, where both ga-ges 
serve as active gages. The 2-gage system is used to elim-inate 
strain components other than the target strain; according 
to the measuring purpose, 2 gages are connected to the 
bridge in different ways. For details, refer to How to Form 
Strain-gage Bridges (Bridge.pdf). 
Fig. 5-1 
Fig. 5-2 
4-gage system 
See Fig. 6. The 4-gage system has 4 strain gages connected 
one each to all 4 sides of the bridge. This circuit ensures large 
output of strain-gage transducers and improves temperature 
compensation as well as eliminates strain components other 
than the target strain. For details, refer to How to Form Strain-gage 
Bridges (Bridge.pdf). 
2
Shape of Beam Bending Moment M 
1 
M = WL 
0 ≤ L ≤ 2 M = W – L 
L = 0L = 
2 
2 4 
M = ± W 
8 
2 ≤ L ≤ M = W L – 3 
2 4 
0 ≤ L ≤ 2 M = WL 
L = 
2 
M = – WL 
4 
2 ≤ L ≤ 
2 
M = W( – L) 
2 
0 ≤ L ≤ 1 
1 ≤ L ≤ ( 1 + 2) 
M = WL 
M = W 1 
1 bh2 
6 
1 . b (h2 
3 – h1 
3) 
6 h2 
π d3 
32 
π . d2 
4 – d1 
4 
32 d2 
Fig. 6 
Rg4 Rg3 
E 
h 
L 
(2) 2-gage System 
Strain gages bonded symmetrically on the front and rear 
surfaces of the cantilever as illustrated below output plus and 
minus signals, respectively, with an equal absolute value. If 
these 2 gages are connected to adjacent sides of the bridge, 
the output of the bridge corresponding to the bending strain is 
doubled and the surface stress σ at the strain-gage bonding 
site is obtained through the following equation: 
The 2-gage system discards strain-gage output corresponding 
to the force applied in the axial direction of the cantilever. 
L 
b 
W 
W 
Strain gage 
Strain gage 
Strain gage 
eo 
Rg1 Rg2 
Typical Measurements with Strain Gages 
Bending Stress Measurement 
(1) 1-gage System 
As illustrated below, bond a strain gage on the top surface of a 
cantilever with a rectangular section. If load W is applied to the 
unfixed end of the cantilever, the strain-gage bonding site has 
the following surface stress σ: 
σ = ε0 . E 
Strain ε0 is obtained through the following equation: 
ε0 = 6WL 
Ebh2 
where, b: Width of cantilver 
h: Thickness of cantilever 
L: Distance from the load point to the center of strain gage 
Bending Stress Measurement with 1-gage System 
σ = ε0 . E 
2 
Bending Stress Measurement with 2-gage System 
Equation to Obtain Strain on Beams 
Strain ε0 on beams is obtained through the following equation: 
ε0 = M 
ZE 
where, M: Bending moment (refer to Table 1) 
Z: Section modulus (refer to Table 2) 
E: Young's modulus (refer to Mechanical Properties of 
Industrial Materials, page 6) 
Typical shapes of beams and their bending moments M and 
section moduli Z are shown in Tables 1 and 2. 
Table 1. Typical Equations to Obtain Bending Moment 
Table 2. Typical Equations to Obtain Section Modulus 
Cross Section Section Modulus Z 
3
Cross Section Polar Modulus of Section Zp 
Torsional and Shearing Stress Measurement of Axis 
When twisted, an axis has shearing stress τ, and in the 2 
directions inclined by 45° from the axial line it has tensile and 
compres-sive stress in an equal magnitude to the shearing 
stress. 
In measuring strain on a twisted axis under simple shearing 
stress status, the strain gage does not directly measure the 
shearing strain but detects tensile or compressive strain 
initiated by tensile or compressive stress that is simultaneously 
generated with the shearing stress. Stress conditions on a 
microscopic part of the surface of the axis may be as 
illustrated below. 
Tensile strain Compressive strain 
Shearing stress τ 
Tensile stress σ 
Compressive stress σ 
τ 
τ 
τ 
Shearing stress γ is defined as illustrated below, and the 
magnitude is calculated through the following equation: 
γ = τ 
G 
where, G: Shearing modulus (refer to Mechanical Properties 
of Industrial Materials, page 1) 
τ: Shearing stress 
When the axis is twisted, point A moves to point B, thereby 
initiating torsional angle θ . 
= γ = 2 γ 
θ 
d2 
d 
(1) Stress Measurement with 1-gage System 
Bond the strain gage on the twisted axis in the direction 
inclined by 45° from the axial line. The relation between strain 
ε0 and stress σ is expressed with the following equation to 
obtain tensile or compressive stress σ: 
σ = ε0 . E 
1 + ν 
where, ε0: Indicated strain 
E: Young's modulus (refer to Mechanical Properties of 
Industrial Materials, page 1) 
ν: Poisson's ratio 
Stress σ and shearing stress τ are equal in magnitude, and 
thus, 
τ = σ 
(2) Stress Measurement with 2 or 4-gage System 
2 or 4 strain gages forming the strain-gage bridge are strained 
in an equal magnitude to enable 2 or 4 times larger output. 
Accordingly, the stress is calculated by dividing the indicated 
strain by 2 or 4. 
For axial strain measurement, the 2 or 4-gage system is used 
to eliminate strain caused by bending moment. Also, for meas-urement 
of tensile strain and compressive strain, strain gages 
are symmetrically positioned from the center of the axis as 
shown below. 
(3) Application to Torque Measurement 
Strain on the surface of the axis is proportional to the torque 
applied to the axis. Thus, the torque is obtained by detecting 
the strain on the surface. 
Shearing stress distributed on the lateral section is balanced 
with the applied torque T, establishing the following equation: 
T = τ . Zp 
where, Zp: Polar modulus of section 
This equation may be rewritten as follows by substituting the 
shearing stress with the relational expression of tensile strain 
and stress: 
T = ε0 . E . Zp 
1+ ν 
The polar modulus of the section is specific to each shape of 
the cross-section as follows: 
A strain-gage torque transducer can be designed using the 
aforementioned relational expression of ε0 and T. 
Obtain ε0 from the allowable stress for the material, and 
determine the width d of the axis which is matched with the 
magnitude of the applied torque. Then, amplify the strain out-put 
with a strain amplifier and read the output voltage with a 
measuring instrument. 
πd3 
16 
π d2 
4 – d1 
4 
16 d2 
4
L-5 
L-9 
L-6 
*120Ω gage 
0.5 
0.11 
0.08 
0.7 
3.2 
4.4 
11.3 
50.6 
69.0 
Principle of Self-temperature-compensation Gages 
(SELCOM® Gages) 
Suppose the measuring object and the resistive element of the 
strain gage have linear expansion coefficients βs and βg, 
respectively. Then, the strain gage bonded on the surface of 
the object provides a thermally-induced apparent strain εT per 
1°C that is expressed with the following equation: 
Resistive element (βg) 
Resistive element (βs) 
Temperature (°C) 
1 r 
2 
R3 R2 R3 R2 
Rg Rg 
R1 
R1 
Rg 
εT = α + (βs – βg) 
Typical Temperature Characteristics of 
Self-temperature-compensation Foil Gage 
40 
20 
0 
–20 
–40 
–60 
–80 
Thermally-induced apparent strain output (με/°C) 
–1.8με/°C 
–1.8με/°C 
Ks 
where, 
α: Resistive temperature coefficient 
of resistive element 
Ks: Gage factor of strain gage 
The self-temperature-compensation gage is designed so that 
εT in the above equation is approximated to zero by controlling 
the resistive temperature coefficient of the gage's resistive 
element according to the linear expansion coefficient of the 
measuring object. 
When bonded to a suitable material, KYOWA's self-tempera-ture- 
compensation gage (SELCOM® gage) minimizes apparent 
strain in the compensated temperature range to ±1.8με/°C 
(graph below shows apparent strain output of 3-wire strain 
gage). 
Linear Expansion Coefficients of Materials 
Material 
Material 
Quartz glass 
Amber 
Brick 
Tungsten 
Lumber (grain dir.) 
Molybdenum 
Zirconium 
Cobar 
Concrete 
Titanium alloy 
Platinum 
Soda-lime glass 
SUS 631 
SUS 630 
Cast iron 
NiCrMo steel 
Beryllium 
Common steel 
Inconel X 
Nickel 
Gold 
SUS 304 
Beryllium copper 
Copper 
Brass 
2024-T4 aluminum 
2014-T4 aluminum 
Magnesium alloy 
Lead 
Acrylic resin 
Polycarbonate 
Rubber 
Linear Exp. Coef. 
11.5 
11.7 
12.1 
13.3 
14.0 
16.2 
16.7 
16.7 
21.0 
23.2 
23.4 
27.0 
29.0 
Approx. 65 to 100 
66.6 
Approx. 77 
Linear Exp. Coef. 
0.4 
1.1 
3.0 to 5.0 
4.5 
5.0 
5.2 
5.4 
5.9 
6.8 to 12.7 
8.5 
8.9 
9.2 
10.3 
10.6 
10.8 
11.3 
(x10–6/°C) 
Temperature Effect of Leadwire with 2-wire System 
Leadwire 
Cross-Sectional 
Model 
Area of Conductor 
(mm2) 
Reciprocating Resistance 
of 10m long Leadwire 
approx. (Ω) 
Apparent Strain* 
with 10m Extension 
approx. (με/°C) 
Thermally-induced apparent strain εr (με/°C) is obtained 
through the following equation. 
εr = r . α 
Rg + r Ks 
where, Rg: Resistance of strain gage (Ω) 
r : Resistance of leadwire (Ω) 
Ks: Preset gage factor of strain amplifier, usually 2.00 
α: Resistive temperature coefficient of copper wire 
(ΔR/R/°C), 3.9 x10⁻³ 
1 r 
2 
Method of Compensating Temperature Effect of 
Leadwire (3-wire System) 
For effective self-temperature-compensation, SELCOM® gages 
adopt the 1-gage system. However, if the leadwire cable is a 
2-wire system, strain output from the bridge is affected by 
temperature effect of the leadwire. To avoid such adverse 
effect, the 3-wire system is adopted. 
If 3 leads are connected to the strain gage as shown below, 
one half the leadwire resistance is applied to the adjacent side 
of the bridge to compensate the resistive components of the 2 
leads affected by a similar temperature change, and thus the 
bridge output is free from any temperature effect of the 
leadwire. The temperature effect of a third lead connected 
directly to the amplifier can be ignored since the amplifier 
provides a high input impedance. 
As precautions in using the 3-wire system, the 3 leads should 
be the same in type, length and cross-section to receive the 
same temperature effect. If they are exposed to direct sunlight, 
the coating color too should be identical. 
1 
2 r 
1 
2 r 
1 
2 r 
1 
2 r 
1 
2 r 
1 
2 r 
5
Resistive element 
Gage base 
Misalignment Effect 
The strain ε0 measured by a strain gage that is misaligned by 
an angle from the direction of the principal strain is expressed 
with the following equation: 
Strain direction 
ε2 
ε0 
ε1 
t 
r 
Influence of Insulation Resistance 
The insulation resistance of a strain gage including leads does 
not affect the measured value if it is higher than 100MΩ. But if 
the insulation resistance changes drastically during measure-ment, 
it causes the measured value to include an error. 
R 
Output 
R 
Strain gage 
Rg 
r1 r2 
Insulation resistance 
Input 
Bridge Circuit Designed with Insulation Resistance 
Taken into Consideration 
If the insulation resistance descends from r1 to r2 in the figure 
above, error strain ε is: 
ε Rg(r1 – r2) 
Ksr1r2 
Suppose, 
Rg = 120Ω (resistance of strain gage) 
Ks = 2.00 (gage factor of strain gage) 
r1 = 1000MΩ (original insulation resistance) 
r2 = 10MΩ (changed insulation resistance) 
Then, the error strain is approximately 6με. 
In general strain measurement, such an error causes virtually 
no problem. In practice, however, the lowered insulation resist-ance, 
r2, is not kept constant but sharply changes due to 
temperature, humidity and other conditions. Thus, it is not 
possible to specify to which part of the circuit the insulation 
resistance r is applied. Accordingly, precautions should be 
taken. 
Resistance Change of Strain Gage Bonded to 
Curved Surface 
The strain εc occurring on the resistive element of a strain gage 
bonded to a curved surface may be expressed with the 
following equation: 
εc = t 
2r + t 
where, t: Thickness of gage base plus adhesive layer 
r: Radius of gage bonding surface 
For example, if a uniaxial KFG gage of which the gage base 
including the adhesive layer is 0.015mm thick, is bonded to a 
curved surface of 1.5r, the strain gage receives strain of 
approximately 5000με under the mere bonding condition. 
If the gage factor Ks is 2.00, 
ΔR/R 10000με 
since ΔR/R = ε 
. Ks. 
If the gage resistance is 120Ω, it increases by approximately 
1.2Ω. If the gage is bonded inside the curve, the resistance 
decreases. 
t 
2 
Strain Gage Bonded on Curved Surface 
Method of Compensating Gage Factors 
If the gage factor of the strain gage is different from that (2.00) 
of the strain amplifier, the real strain ε can be obtained through 
the following equation: 
ε = 2.00 x εi Ks 
where, εi: Measured strain 
Ks: Gage factor of strain gage 
θ 
ε0 = 1 {(ε1 + ε2) + (ε1 – ε2) cos 2 } 
2 θ 
If ε2 = –νε1 (ν: Poisson's ratio) under the uniaxial stress condi-tion, 
ε0 = 1 ε1{(1 – ν) + (1 + ν) cos 2θ } 
2 
Method of Compensating Leadwire Extension Effect 
If the leadwire or cable is extended with the 1-gage or 2-gage 
system, additional resistance is initiated in series to the strain 
gage, thereby decreasing the apparent gage factor. For 
example, if a 10m long leadwire with 0.3mm2 conductors is 
used, the gage factor decreases by 1%. In the case of the 4- 
gage system (transducer), the extension decreases the bridge 
voltage too. In these cases, the real strain ε can be obtained 
through the following equation (Supposing the gage factor Ks 
is 2.00): 
ε = (1 + r  ) x εi Rg 
where, εi: Measured strain 
Rg: Resistance of strain gage 
r : Total resistance of leadwire (For reciprocating 
resistance, see the table on the next page.) 
One-way resistance in the case of 3-wire system 
6
Reciprocating Resistance of Leadwire 
Number/Diameter 
of Strands 
Cross-Section 
(mm2) 
Reciprocating 
Resistance per 10m 
(Ω) 
Method of Compensating Nonlinearity of 1-gage System 
Nonlinearity beyond the specification in large strain measure-ment 
with the 1-gage system can be compensated through 
the following equation to obtain the real strain ε: 
Remarks 
0.08 
0.11 
0.3 
0.5 
4.4 
3.2 
1.17 
0.7 
L-6, 7 
L-9, 10 
L-2 
L-5 
7/0.12 
10/0.12 
12/0.18 
20/0.18 
ε = ε0 (x10–6) 
1 – ε0 
where, ε0: Measured strain 
Method of Obtaining Magnitude and Direction of 
Principal Stress (Rosette Analysis) 
Usually, if the direction of the principal stress is unknown in 
stress measurement of structures, a triaxial rosette gage is 
used and multiple physical quantities are obtained by putting 
measured strain values in the following equations. (These 
equations apply to right-angled triaxial rosette gages.)  
Precautions in Analysis 
(1) Regard εa εb εc as the forward direction. 
(2) Angle is: 
Angle of the maximum strain to the εa axis when εa  εc; 
Angle of the minimum strain to the εa axis when εa  εc. 
Comparison between εa and εc in magnitude includes plus 
and minus signs. 
Max. principal strain 
Min. principal strain 
Direction of principal 
strain (from εa axis) 
Max. shearing strain 
Max. principal stress 
Min. principal stress 
Max. shearing stress 
εmax. = 1 [εa + εc + 2 { (εa – εb)2+ (εb – εc)2} ] 2 
εmin. = 1 [εa + εc – 2{(εa – εb)2+ (εb – εc)2} ] 2 
θ = 1 tan–1 [ 2εb – εa – εc ] 2 εa – εc 
γmax. = 2 { (εa – εb)2+ (εb – εc)2} 
σmax. = E [(1 + ν) (εa + εc) + (1 – ν) 
Generating Calibration Value based on Tip Parallel 
Resistance Method 
When extending the leadwire by several hundred meters or to 
obtain an accurate calibration value, use the tip parallel resist-ance 
method. The parallel resistance r can be obtained 
through the following equation: 
r = Rg 
Ks . ε 
where, Rg: Resistance of strain gage 
Ks: Gage factor of strain gage 
ε: Calibration strain value 
Examples of Calibration Strain Value and Resistance 
(Rg = 120Ω, Ks = 2.00) 
Calibration Strain Value Resistance, r (approx.) 
100 με 
200 με 
500 με 
1000 με 
2000 με 
600 kΩ 
300 kΩ 
120 kΩ 
60 kΩ 
30 kΩ 
2 (1 – ν2) 
x 2 { (εa – εb)2+ (εb – εc)2} ] 
σmin. = E [(1 + ν) (εa + εc) – (1 – ν) 
2 (1 – ν2) 
x 2 { (εa – εb)2+ (εb – εc)2} ] 
τmax. = E x 2 { (εa – εb)2+ (εb – εc)2} 
2 (1 – ν) 
ν: Poisson's ratio 
E: Young's modulus 
(Refer to Mechanical Properties of Industrial Materials (page 6). 
7
Typical Strain Gage Bonding Method and Dampproofing Treatment 
The strain gage bonding method differs depending on the type of adhesive applied. The description below applies to a case 
where the leadwire-equipped KFG gage is bonded to a mild steel test piece with a representative cyanoacrylate adhesive, 
CC-33A. The dampproofing treatment is in the case of using an butyl rubber coating agent, AK-22. 
Like drawing a circle with 
sandpaper (#300 or so), 
polish the strain gage 
bonding site in a 
considerably wider area 
than the strain gage size. 
(If the measuring object is a 
practical structure, wipe off 
paint, rust and plating with 
a grinder or sand blast. 
Then, polish with 
sandpaper.) 
Make sure of the front 
(metal foil part) and the 
back of the strain gage. 
Apply a drop of adhesive to 
the back and immediately 
put the strain gage on the 
bonding site. 
(Do not spread the adhesive 
over the back. If so, curing 
is adversely accelerated.) 
When the adhesive is cured, 
remove the polyethylene 
sheet and check the 
bonding condition. Ideally, 
the adhesive is slightly 
forced out from around the 
strain gage. 
If the adhesive is widely 
forced out from around the 
gage base, remove the 
protruding adhesive with a 
cutter or sandpaper. 
Place gage leads in a slightly 
slackened condition. 
Put up the leadwire from 
before the part where the 
adhesive is applied. Place a 
block of the coating agent 
below the leadwire with 
gage leads slightly  
slackened. 
Completely cover the strain 
gage, protruding adhesive 
and part of the leadwire with 
another block of the coating 
agent. Do not tear the block 
to pieces but slightly flatten 
it with a finger to closely 
contact it with the strain 
gage and part of the 
leadwire. Completely hide 
protrusions including gage 
leads behind the coating 
agent. 
Using an absorbent cotton, 
gauze or SILBON paper 
dipped in a highly volatile 
solvent such as acetone 
which dissolves oils and 
fats, strongly wipe the 
bonding site in a single 
direction to remove oils and 
fats. Reciprocated wiping 
does not clean the surface. 
After cleaning, mark the 
strain gage bonding 
position. 
Cover the strain gage with 
the accessory polyethylene 
sheet and strongly press the 
strain gage over the sheet 
with a thumb for approxi-mately 
1 minute (do not 
detach midway). Quickly 
perform steps 3 and 4. 
Otherwise, the adhesive is 
cured. Once the strain gage 
is put on the bonding site, 
do not put it up to adjust 
the position. 
Strain Gage Bonding Manual is available from KYOWA at a price of ¥1,200 per copy. If required, contact your KYOWA sales representative. 
8

More Related Content

What's hot

Measurement of Strain and Temperature
Measurement of Strain and TemperatureMeasurement of Strain and Temperature
Measurement of Strain and TemperatureAbhishek Turamandi
 
Torsion and strain gauge .
Torsion and  strain gauge .Torsion and  strain gauge .
Torsion and strain gauge .Salman Jailani
 
All About Strain Gauge Load Cell - Tacuna Systems
All About Strain Gauge Load Cell - Tacuna SystemsAll About Strain Gauge Load Cell - Tacuna Systems
All About Strain Gauge Load Cell - Tacuna Systemstacuna systems
 
Load cell
Load cellLoad cell
Load cellmalikji
 
Load Cells 101 Presentation
Load Cells 101 PresentationLoad Cells 101 Presentation
Load Cells 101 PresentationInterface Inc.
 
Basics of torque measuring english
Basics of torque measuring englishBasics of torque measuring english
Basics of torque measuring englishCarlos Cardelo
 
Ch. no. 5 vibration and strain measurement
Ch. no. 5 vibration and strain measurementCh. no. 5 vibration and strain measurement
Ch. no. 5 vibration and strain measurementAmol Kokare
 
Strain gauge hardik
Strain gauge hardikStrain gauge hardik
Strain gauge hardikHardik Jain
 
Strain gauge loadcell ppt
Strain gauge loadcell pptStrain gauge loadcell ppt
Strain gauge loadcell pptmaneeb
 
Stress strain measurements ppt
Stress  strain measurements pptStress  strain measurements ppt
Stress strain measurements pptMBALAJI13
 
Strain Gauge Measurement using LabVIEW
Strain Gauge Measurement using LabVIEWStrain Gauge Measurement using LabVIEW
Strain Gauge Measurement using LabVIEWMithun Chowdhury
 
Monitoring of strain and seismic vibrations in structures
Monitoring of strain and seismic vibrations in structuresMonitoring of strain and seismic vibrations in structures
Monitoring of strain and seismic vibrations in structureskalyanabooshnam
 

What's hot (20)

Measurement of Strain and Temperature
Measurement of Strain and TemperatureMeasurement of Strain and Temperature
Measurement of Strain and Temperature
 
Torsion and strain gauge .
Torsion and  strain gauge .Torsion and  strain gauge .
Torsion and strain gauge .
 
Strain gauge
Strain gaugeStrain gauge
Strain gauge
 
All About Strain Gauge Load Cell - Tacuna Systems
All About Strain Gauge Load Cell - Tacuna SystemsAll About Strain Gauge Load Cell - Tacuna Systems
All About Strain Gauge Load Cell - Tacuna Systems
 
Load cell
Load cellLoad cell
Load cell
 
Load Cells 101 Presentation
Load Cells 101 PresentationLoad Cells 101 Presentation
Load Cells 101 Presentation
 
strain gauges
strain gauges strain gauges
strain gauges
 
Basics of torque measuring english
Basics of torque measuring englishBasics of torque measuring english
Basics of torque measuring english
 
Strain guage
Strain guageStrain guage
Strain guage
 
Ch. no. 5 vibration and strain measurement
Ch. no. 5 vibration and strain measurementCh. no. 5 vibration and strain measurement
Ch. no. 5 vibration and strain measurement
 
Strain gauge hardik
Strain gauge hardikStrain gauge hardik
Strain gauge hardik
 
Strain gauge
Strain gaugeStrain gauge
Strain gauge
 
Strain gauge loadcell ppt
Strain gauge loadcell pptStrain gauge loadcell ppt
Strain gauge loadcell ppt
 
Lab manual.pptx
Lab manual.pptxLab manual.pptx
Lab manual.pptx
 
Strain Gauges
Strain GaugesStrain Gauges
Strain Gauges
 
Stress strain measurements ppt
Stress  strain measurements pptStress  strain measurements ppt
Stress strain measurements ppt
 
Strain Gauge Measurement using LabVIEW
Strain Gauge Measurement using LabVIEWStrain Gauge Measurement using LabVIEW
Strain Gauge Measurement using LabVIEW
 
Monitoring of strain and seismic vibrations in structures
Monitoring of strain and seismic vibrations in structuresMonitoring of strain and seismic vibrations in structures
Monitoring of strain and seismic vibrations in structures
 
strain measurement
strain measurement strain measurement
strain measurement
 
Electronic weighbridge
Electronic weighbridge Electronic weighbridge
Electronic weighbridge
 

Viewers also liked

Load cell-transducer
Load cell-transducerLoad cell-transducer
Load cell-transducerusama umar
 
Optimizing Load Cell Performance
Optimizing Load Cell PerformanceOptimizing Load Cell Performance
Optimizing Load Cell PerformanceInterface
 
Load Cell 101 Webinar Slides
Load Cell 101 Webinar SlidesLoad Cell 101 Webinar Slides
Load Cell 101 Webinar SlidesInterface Inc.
 
Types of Load Cells and Force Sensors Commonly used as force standards
Types of Load Cells and Force Sensors Commonly used as force standards Types of Load Cells and Force Sensors Commonly used as force standards
Types of Load Cells and Force Sensors Commonly used as force standards Henry Zumbrun
 
Tft Lcd 模組構裝技術
Tft Lcd 模組構裝技術Tft Lcd 模組構裝技術
Tft Lcd 模組構裝技術5045033
 
presentation on dynamometers
presentation on dynamometerspresentation on dynamometers
presentation on dynamometersRakshit vadi
 
cảm biến đo gia tốc và rung
cảm biến đo gia tốc và rungcảm biến đo gia tốc và rung
cảm biến đo gia tốc và rungTony Tun
 
Tìm hiểu về cảm biến độ ẩm
Tìm hiểu về cảm biến độ ẩmTìm hiểu về cảm biến độ ẩm
Tìm hiểu về cảm biến độ ẩmPham Hoang
 
Tìm hiểu về cảm biến nhiệt độ
Tìm hiểu về cảm biến nhiệt độTìm hiểu về cảm biến nhiệt độ
Tìm hiểu về cảm biến nhiệt độPham Hoang
 
Electric transducer
Electric transducerElectric transducer
Electric transducerUday Korat
 
Pe 4030 ch 2 sensors and transducers part 1 final sept 20 2016
Pe 4030 ch 2 sensors and transducers  part 1 final  sept 20 2016Pe 4030 ch 2 sensors and transducers  part 1 final  sept 20 2016
Pe 4030 ch 2 sensors and transducers part 1 final sept 20 2016Charlton Inao
 
LVDT by KUL BHUSHAN
LVDT by KUL BHUSHANLVDT by KUL BHUSHAN
LVDT by KUL BHUSHANKul Bhushan
 
Strain gauge load cell (Industrial Measurement)
Strain gauge load cell (Industrial Measurement)Strain gauge load cell (Industrial Measurement)
Strain gauge load cell (Industrial Measurement)Ketan Nayak
 

Viewers also liked (20)

Load cell
Load cellLoad cell
Load cell
 
Strain gauge
Strain gaugeStrain gauge
Strain gauge
 
Load cell-transducer
Load cell-transducerLoad cell-transducer
Load cell-transducer
 
Optimizing Load Cell Performance
Optimizing Load Cell PerformanceOptimizing Load Cell Performance
Optimizing Load Cell Performance
 
Load Cell 101 Webinar Slides
Load Cell 101 Webinar SlidesLoad Cell 101 Webinar Slides
Load Cell 101 Webinar Slides
 
Strain gauge
Strain gaugeStrain gauge
Strain gauge
 
Elastic force device
Elastic force deviceElastic force device
Elastic force device
 
Types of Load Cells and Force Sensors Commonly used as force standards
Types of Load Cells and Force Sensors Commonly used as force standards Types of Load Cells and Force Sensors Commonly used as force standards
Types of Load Cells and Force Sensors Commonly used as force standards
 
Tft Lcd 模組構裝技術
Tft Lcd 模組構裝技術Tft Lcd 模組構裝技術
Tft Lcd 模組構裝技術
 
presentation on dynamometers
presentation on dynamometerspresentation on dynamometers
presentation on dynamometers
 
cảm biến đo gia tốc và rung
cảm biến đo gia tốc và rungcảm biến đo gia tốc và rung
cảm biến đo gia tốc và rung
 
Tìm hiểu về cảm biến độ ẩm
Tìm hiểu về cảm biến độ ẩmTìm hiểu về cảm biến độ ẩm
Tìm hiểu về cảm biến độ ẩm
 
Chuong 6 cam bien do luc
Chuong 6 cam bien do lucChuong 6 cam bien do luc
Chuong 6 cam bien do luc
 
Chuong 3 cam bien do nhiet do
Chuong 3 cam bien do nhiet doChuong 3 cam bien do nhiet do
Chuong 3 cam bien do nhiet do
 
Tìm hiểu về cảm biến nhiệt độ
Tìm hiểu về cảm biến nhiệt độTìm hiểu về cảm biến nhiệt độ
Tìm hiểu về cảm biến nhiệt độ
 
Dynamometers
DynamometersDynamometers
Dynamometers
 
Electric transducer
Electric transducerElectric transducer
Electric transducer
 
Pe 4030 ch 2 sensors and transducers part 1 final sept 20 2016
Pe 4030 ch 2 sensors and transducers  part 1 final  sept 20 2016Pe 4030 ch 2 sensors and transducers  part 1 final  sept 20 2016
Pe 4030 ch 2 sensors and transducers part 1 final sept 20 2016
 
LVDT by KUL BHUSHAN
LVDT by KUL BHUSHANLVDT by KUL BHUSHAN
LVDT by KUL BHUSHAN
 
Strain gauge load cell (Industrial Measurement)
Strain gauge load cell (Industrial Measurement)Strain gauge load cell (Industrial Measurement)
Strain gauge load cell (Industrial Measurement)
 

Similar to How strain gages measure stress and strain

Experimental strain analysis
Experimental strain analysisExperimental strain analysis
Experimental strain analysisKanok Phoocam
 
Applying The Wheatstone Bridge Circuit
Applying The Wheatstone Bridge CircuitApplying The Wheatstone Bridge Circuit
Applying The Wheatstone Bridge CircuitSean Flores
 
Instrumentation Lab. Experiment #6 Report: Strain Measurements 1
Instrumentation Lab. Experiment #6 Report: Strain Measurements 1Instrumentation Lab. Experiment #6 Report: Strain Measurements 1
Instrumentation Lab. Experiment #6 Report: Strain Measurements 1mohammad zeyad
 
EXPERIMENTAL STRESS ANALYSIS CHAPTER-01
EXPERIMENTAL STRESS ANALYSIS CHAPTER-01EXPERIMENTAL STRESS ANALYSIS CHAPTER-01
EXPERIMENTAL STRESS ANALYSIS CHAPTER-01MAHESH HUDALI
 
Stressanalysis linearityerror
Stressanalysis linearityerrorStressanalysis linearityerror
Stressanalysis linearityerrorNobantuNxumalo
 
Dual Diaphragm based Cantilever Operated Mechatronic Differential Pressure Se...
Dual Diaphragm based Cantilever Operated Mechatronic Differential Pressure Se...Dual Diaphragm based Cantilever Operated Mechatronic Differential Pressure Se...
Dual Diaphragm based Cantilever Operated Mechatronic Differential Pressure Se...cscpconf
 
ESA Module 1 Part-B ME832. by Dr. Mohammed Imran
ESA Module 1 Part-B ME832. by Dr. Mohammed ImranESA Module 1 Part-B ME832. by Dr. Mohammed Imran
ESA Module 1 Part-B ME832. by Dr. Mohammed ImranMohammed Imran
 
Instrumentation Lab. Experiment #7 Report: Strain Measurements 2
Instrumentation Lab. Experiment #7 Report: Strain Measurements 2Instrumentation Lab. Experiment #7 Report: Strain Measurements 2
Instrumentation Lab. Experiment #7 Report: Strain Measurements 2mohammad zeyad
 
Stress Analysis of Chain Links in Different Operating Conditions
Stress Analysis of Chain Links in Different Operating ConditionsStress Analysis of Chain Links in Different Operating Conditions
Stress Analysis of Chain Links in Different Operating Conditionsinventionjournals
 
Experimental stress analysis BE notes by mohammed imran
Experimental stress analysis BE notes by mohammed imranExperimental stress analysis BE notes by mohammed imran
Experimental stress analysis BE notes by mohammed imranMohammed Imran
 
Strength of material lab, Exp 2: Tensile test
Strength of material lab, Exp 2: Tensile test Strength of material lab, Exp 2: Tensile test
Strength of material lab, Exp 2: Tensile test Osaid Qasim
 
“Finite Element Stress Analysis and Stress Intensity Factor of TJoint Pipe In...
“Finite Element Stress Analysis and Stress Intensity Factor of TJoint Pipe In...“Finite Element Stress Analysis and Stress Intensity Factor of TJoint Pipe In...
“Finite Element Stress Analysis and Stress Intensity Factor of TJoint Pipe In...IOSR Journals
 
Resistive transducers and Strain Gauge
Resistive transducers and Strain GaugeResistive transducers and Strain Gauge
Resistive transducers and Strain Gaugekaroline Enoch
 
Av335 instrumentation lab report
Av335 instrumentation lab reportAv335 instrumentation lab report
Av335 instrumentation lab reportGaurav Vaibhav
 
Twice yield method for assessment of fatigue life assesment of pressure swing...
Twice yield method for assessment of fatigue life assesment of pressure swing...Twice yield method for assessment of fatigue life assesment of pressure swing...
Twice yield method for assessment of fatigue life assesment of pressure swing...Kingston Rivington
 

Similar to How strain gages measure stress and strain (20)

Experimental strain analysis
Experimental strain analysisExperimental strain analysis
Experimental strain analysis
 
Applying The Wheatstone Bridge Circuit
Applying The Wheatstone Bridge CircuitApplying The Wheatstone Bridge Circuit
Applying The Wheatstone Bridge Circuit
 
Instrumentation Lab. Experiment #6 Report: Strain Measurements 1
Instrumentation Lab. Experiment #6 Report: Strain Measurements 1Instrumentation Lab. Experiment #6 Report: Strain Measurements 1
Instrumentation Lab. Experiment #6 Report: Strain Measurements 1
 
EXPERIMENTAL STRESS ANALYSIS CHAPTER-01
EXPERIMENTAL STRESS ANALYSIS CHAPTER-01EXPERIMENTAL STRESS ANALYSIS CHAPTER-01
EXPERIMENTAL STRESS ANALYSIS CHAPTER-01
 
Stressanalysis linearityerror
Stressanalysis linearityerrorStressanalysis linearityerror
Stressanalysis linearityerror
 
Dual Diaphragm based Cantilever Operated Mechatronic Differential Pressure Se...
Dual Diaphragm based Cantilever Operated Mechatronic Differential Pressure Se...Dual Diaphragm based Cantilever Operated Mechatronic Differential Pressure Se...
Dual Diaphragm based Cantilever Operated Mechatronic Differential Pressure Se...
 
Chapter15yyyyyyyyyy
Chapter15yyyyyyyyyyChapter15yyyyyyyyyy
Chapter15yyyyyyyyyy
 
ESA Module 1 Part-B ME832. by Dr. Mohammed Imran
ESA Module 1 Part-B ME832. by Dr. Mohammed ImranESA Module 1 Part-B ME832. by Dr. Mohammed Imran
ESA Module 1 Part-B ME832. by Dr. Mohammed Imran
 
Instrumentation Lab. Experiment #7 Report: Strain Measurements 2
Instrumentation Lab. Experiment #7 Report: Strain Measurements 2Instrumentation Lab. Experiment #7 Report: Strain Measurements 2
Instrumentation Lab. Experiment #7 Report: Strain Measurements 2
 
Stress Analysis of Chain Links in Different Operating Conditions
Stress Analysis of Chain Links in Different Operating ConditionsStress Analysis of Chain Links in Different Operating Conditions
Stress Analysis of Chain Links in Different Operating Conditions
 
Unit ii transducers
Unit ii transducersUnit ii transducers
Unit ii transducers
 
Experimental stress analysis BE notes by mohammed imran
Experimental stress analysis BE notes by mohammed imranExperimental stress analysis BE notes by mohammed imran
Experimental stress analysis BE notes by mohammed imran
 
Transducer
TransducerTransducer
Transducer
 
Strength of material lab, Exp 2: Tensile test
Strength of material lab, Exp 2: Tensile test Strength of material lab, Exp 2: Tensile test
Strength of material lab, Exp 2: Tensile test
 
Strain_gages.pdf
Strain_gages.pdfStrain_gages.pdf
Strain_gages.pdf
 
Strain gages
Strain gagesStrain gages
Strain gages
 
“Finite Element Stress Analysis and Stress Intensity Factor of TJoint Pipe In...
“Finite Element Stress Analysis and Stress Intensity Factor of TJoint Pipe In...“Finite Element Stress Analysis and Stress Intensity Factor of TJoint Pipe In...
“Finite Element Stress Analysis and Stress Intensity Factor of TJoint Pipe In...
 
Resistive transducers and Strain Gauge
Resistive transducers and Strain GaugeResistive transducers and Strain Gauge
Resistive transducers and Strain Gauge
 
Av335 instrumentation lab report
Av335 instrumentation lab reportAv335 instrumentation lab report
Av335 instrumentation lab report
 
Twice yield method for assessment of fatigue life assesment of pressure swing...
Twice yield method for assessment of fatigue life assesment of pressure swing...Twice yield method for assessment of fatigue life assesment of pressure swing...
Twice yield method for assessment of fatigue life assesment of pressure swing...
 

Recently uploaded

Gurgaon ✡️9711147426✨Call In girls Gurgaon Sector 51 escort service
Gurgaon ✡️9711147426✨Call In girls Gurgaon Sector 51 escort serviceGurgaon ✡️9711147426✨Call In girls Gurgaon Sector 51 escort service
Gurgaon ✡️9711147426✨Call In girls Gurgaon Sector 51 escort servicejennyeacort
 
Instrumentation, measurement and control of bio process parameters ( Temperat...
Instrumentation, measurement and control of bio process parameters ( Temperat...Instrumentation, measurement and control of bio process parameters ( Temperat...
Instrumentation, measurement and control of bio process parameters ( Temperat...121011101441
 
computer application and construction management
computer application and construction managementcomputer application and construction management
computer application and construction managementMariconPadriquez1
 
Correctly Loading Incremental Data at Scale
Correctly Loading Incremental Data at ScaleCorrectly Loading Incremental Data at Scale
Correctly Loading Incremental Data at ScaleAlluxio, Inc.
 
Heart Disease Prediction using machine learning.pptx
Heart Disease Prediction using machine learning.pptxHeart Disease Prediction using machine learning.pptx
Heart Disease Prediction using machine learning.pptxPoojaBan
 
Arduino_CSE ece ppt for working and principal of arduino.ppt
Arduino_CSE ece ppt for working and principal of arduino.pptArduino_CSE ece ppt for working and principal of arduino.ppt
Arduino_CSE ece ppt for working and principal of arduino.pptSAURABHKUMAR892774
 
CCS355 Neural Network & Deep Learning Unit II Notes with Question bank .pdf
CCS355 Neural Network & Deep Learning Unit II Notes with Question bank .pdfCCS355 Neural Network & Deep Learning Unit II Notes with Question bank .pdf
CCS355 Neural Network & Deep Learning Unit II Notes with Question bank .pdfAsst.prof M.Gokilavani
 
Decoding Kotlin - Your guide to solving the mysterious in Kotlin.pptx
Decoding Kotlin - Your guide to solving the mysterious in Kotlin.pptxDecoding Kotlin - Your guide to solving the mysterious in Kotlin.pptx
Decoding Kotlin - Your guide to solving the mysterious in Kotlin.pptxJoão Esperancinha
 
Biology for Computer Engineers Course Handout.pptx
Biology for Computer Engineers Course Handout.pptxBiology for Computer Engineers Course Handout.pptx
Biology for Computer Engineers Course Handout.pptxDeepakSakkari2
 
Comparative Analysis of Text Summarization Techniques
Comparative Analysis of Text Summarization TechniquesComparative Analysis of Text Summarization Techniques
Comparative Analysis of Text Summarization Techniquesugginaramesh
 
complete construction, environmental and economics information of biomass com...
complete construction, environmental and economics information of biomass com...complete construction, environmental and economics information of biomass com...
complete construction, environmental and economics information of biomass com...asadnawaz62
 
Call Girls Delhi {Jodhpur} 9711199012 high profile service
Call Girls Delhi {Jodhpur} 9711199012 high profile serviceCall Girls Delhi {Jodhpur} 9711199012 high profile service
Call Girls Delhi {Jodhpur} 9711199012 high profile servicerehmti665
 
Study on Air-Water & Water-Water Heat Exchange in a Finned Tube Exchanger
Study on Air-Water & Water-Water Heat Exchange in a Finned Tube ExchangerStudy on Air-Water & Water-Water Heat Exchange in a Finned Tube Exchanger
Study on Air-Water & Water-Water Heat Exchange in a Finned Tube ExchangerAnamika Sarkar
 
Past, Present and Future of Generative AI
Past, Present and Future of Generative AIPast, Present and Future of Generative AI
Past, Present and Future of Generative AIabhishek36461
 
Artificial-Intelligence-in-Electronics (K).pptx
Artificial-Intelligence-in-Electronics (K).pptxArtificial-Intelligence-in-Electronics (K).pptx
Artificial-Intelligence-in-Electronics (K).pptxbritheesh05
 
What are the advantages and disadvantages of membrane structures.pptx
What are the advantages and disadvantages of membrane structures.pptxWhat are the advantages and disadvantages of membrane structures.pptx
What are the advantages and disadvantages of membrane structures.pptxwendy cai
 

Recently uploaded (20)

Gurgaon ✡️9711147426✨Call In girls Gurgaon Sector 51 escort service
Gurgaon ✡️9711147426✨Call In girls Gurgaon Sector 51 escort serviceGurgaon ✡️9711147426✨Call In girls Gurgaon Sector 51 escort service
Gurgaon ✡️9711147426✨Call In girls Gurgaon Sector 51 escort service
 
Call Us -/9953056974- Call Girls In Vikaspuri-/- Delhi NCR
Call Us -/9953056974- Call Girls In Vikaspuri-/- Delhi NCRCall Us -/9953056974- Call Girls In Vikaspuri-/- Delhi NCR
Call Us -/9953056974- Call Girls In Vikaspuri-/- Delhi NCR
 
Instrumentation, measurement and control of bio process parameters ( Temperat...
Instrumentation, measurement and control of bio process parameters ( Temperat...Instrumentation, measurement and control of bio process parameters ( Temperat...
Instrumentation, measurement and control of bio process parameters ( Temperat...
 
computer application and construction management
computer application and construction managementcomputer application and construction management
computer application and construction management
 
Correctly Loading Incremental Data at Scale
Correctly Loading Incremental Data at ScaleCorrectly Loading Incremental Data at Scale
Correctly Loading Incremental Data at Scale
 
Heart Disease Prediction using machine learning.pptx
Heart Disease Prediction using machine learning.pptxHeart Disease Prediction using machine learning.pptx
Heart Disease Prediction using machine learning.pptx
 
Arduino_CSE ece ppt for working and principal of arduino.ppt
Arduino_CSE ece ppt for working and principal of arduino.pptArduino_CSE ece ppt for working and principal of arduino.ppt
Arduino_CSE ece ppt for working and principal of arduino.ppt
 
CCS355 Neural Network & Deep Learning Unit II Notes with Question bank .pdf
CCS355 Neural Network & Deep Learning Unit II Notes with Question bank .pdfCCS355 Neural Network & Deep Learning Unit II Notes with Question bank .pdf
CCS355 Neural Network & Deep Learning Unit II Notes with Question bank .pdf
 
Decoding Kotlin - Your guide to solving the mysterious in Kotlin.pptx
Decoding Kotlin - Your guide to solving the mysterious in Kotlin.pptxDecoding Kotlin - Your guide to solving the mysterious in Kotlin.pptx
Decoding Kotlin - Your guide to solving the mysterious in Kotlin.pptx
 
POWER SYSTEMS-1 Complete notes examples
POWER SYSTEMS-1 Complete notes  examplesPOWER SYSTEMS-1 Complete notes  examples
POWER SYSTEMS-1 Complete notes examples
 
Biology for Computer Engineers Course Handout.pptx
Biology for Computer Engineers Course Handout.pptxBiology for Computer Engineers Course Handout.pptx
Biology for Computer Engineers Course Handout.pptx
 
Comparative Analysis of Text Summarization Techniques
Comparative Analysis of Text Summarization TechniquesComparative Analysis of Text Summarization Techniques
Comparative Analysis of Text Summarization Techniques
 
Design and analysis of solar grass cutter.pdf
Design and analysis of solar grass cutter.pdfDesign and analysis of solar grass cutter.pdf
Design and analysis of solar grass cutter.pdf
 
complete construction, environmental and economics information of biomass com...
complete construction, environmental and economics information of biomass com...complete construction, environmental and economics information of biomass com...
complete construction, environmental and economics information of biomass com...
 
Call Girls Delhi {Jodhpur} 9711199012 high profile service
Call Girls Delhi {Jodhpur} 9711199012 high profile serviceCall Girls Delhi {Jodhpur} 9711199012 high profile service
Call Girls Delhi {Jodhpur} 9711199012 high profile service
 
Study on Air-Water & Water-Water Heat Exchange in a Finned Tube Exchanger
Study on Air-Water & Water-Water Heat Exchange in a Finned Tube ExchangerStudy on Air-Water & Water-Water Heat Exchange in a Finned Tube Exchanger
Study on Air-Water & Water-Water Heat Exchange in a Finned Tube Exchanger
 
Past, Present and Future of Generative AI
Past, Present and Future of Generative AIPast, Present and Future of Generative AI
Past, Present and Future of Generative AI
 
Artificial-Intelligence-in-Electronics (K).pptx
Artificial-Intelligence-in-Electronics (K).pptxArtificial-Intelligence-in-Electronics (K).pptx
Artificial-Intelligence-in-Electronics (K).pptx
 
What are the advantages and disadvantages of membrane structures.pptx
What are the advantages and disadvantages of membrane structures.pptxWhat are the advantages and disadvantages of membrane structures.pptx
What are the advantages and disadvantages of membrane structures.pptx
 
young call girls in Rajiv Chowk🔝 9953056974 🔝 Delhi escort Service
young call girls in Rajiv Chowk🔝 9953056974 🔝 Delhi escort Serviceyoung call girls in Rajiv Chowk🔝 9953056974 🔝 Delhi escort Service
young call girls in Rajiv Chowk🔝 9953056974 🔝 Delhi escort Service
 

How strain gages measure stress and strain

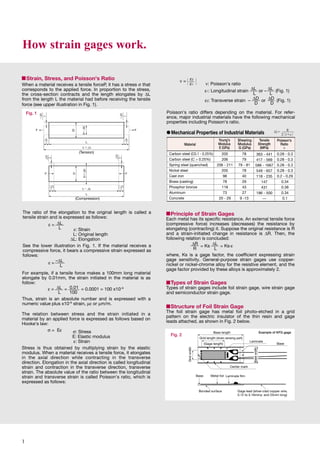
  • 1. (Tension) (Compression) How strain gages work. Strain, Stress, and Poisson's Ratio When a material receives a tensile forceP, it has a stress σ that corresponds to the applied force. In proportion to the stress, the cross-section contracts and the length elongates by ΔL from the length L the material had before receiving the tensile force (see upper illustration in Fig. 1). Fig. 1 The ratio of the elongation to the original length is called a tensile strain and is expressed as follows: ε = ΔL L ε: Strain L: Original length ΔL: Elongation See the lower illustration in Fig. 1. If the material receives a compressive force, it bears a compressive strain expressed as follows: ε = –ΔL L For example, if a tensile force makes a 100mm long material elongate by 0.01mm, the strain initiated in the material is as follow: ε = ΔL = 0.01 = 0.0001 = 100 x10–6 L 100 Thus, strain is an absolute number and is expressed with a numeric value plus x10–6 strain, με or μm/m. The relation between stress and the strain initiated in a material by an applied force is expressed as follows based on Hooke's law: σ = Eε σ: Stress E: Elastic modulus ε: Strain Stress is thus obtained by multiplying strain by the elastic modulus. When a material receives a tensile force, it elongates in the axial direction while contracting in the transverse direction. Elongation in the axial direction is called longitudinal strain and contraction in the transverse direction, transverse strain. The absolute value of the ratio between the longitudinal strain and transverse strain is called Poisson's ratio, which is expressed as follows: ν = ε2 ε1 ν: Poisson's ratio ε1: Longitudinal strain ΔL or – ΔL (Fig. 1) L L ε2: Transverse strain – ΔD or ΔD (Fig. 1) D D Poisson's ratio differs depending on the material. For refer-ence, major industrial materials have the following mechanical properties including Poisson's ratio. Mechanical Properties of Industrial Materials Shearing Modulus G (GPa) Tensile Strength (MPa) Poisson's Ratio ν Material Carbon steel (C0.1 - 0.25%) Carbon steel (C 0.25%) Spring steel (quenched) Nickel steel Cast iron Brass (casting) Phosphor bronze Aluminum Concrete 363 - 441 417 - 569 588 - 1667 549 - 657 118 - 235 147 431 186 - 500 — 0.28 - 0.3 0.28 - 0.3 0.28 - 0.3 0.28 - 0.3 0.2 - 0.29 0.34 0.38 0.34 0.1 78 79 79 - 81 78 40 29 43 27 9 -13 Young's Modulus E (GPa) 205 206 206 - 211 205 98 78 118 73 20 - 29 Principle of Strain Gages Each metal has its specific resistance. An external tensile force (compressive force) increases (decreases) the resistance by elongating (contracting) it. Suppose the original resistance is R and a strain-initiated change in resistance is ΔR. Then, the following relation is concluded: ΔR = Ks ΔL = Ks.ε R L where, Ks is a gage factor, the coefficient expressing strain gage sensitivity. General-purpose strain gages use copper-nickel or nickel-chrome alloy for the resistive element, and the gage factor provided by these alloys is approximately 2. Types of Strain Gages Types of strain gages include foil strain gage, wire strain gage and semiconductor strain gage. Structure of Foil Strain Gage The foil strain gage has metal foil photo-etched in a grid pattern on the electric insulator of the thin resin and gage leads attached, as shown in Fig. 2 below. Fig. 2 Base length Example of KFG gage Laminate Metal foil Laminate film Base Bonded surface Center mark Base Grid width Base width Grid length (strain sensing part) (Gage length) Gage lead (silver-clad copper wire, 0.12 to 0.16mmφ and 25mm long) 1
  • 2. The strain gage is bonded to the measuring object with a dedicated adhesive. Strain occurring on the measuring site is transferred to the strain sensing element via the gage base. For accurate measurement, the strain gage and adhesive should match the measuring material and operating conditions including temperature. For the method of bonding the strain gage to metal, refer to Page 8. Principle of Strain Measurement Strain-initiated resistance change is extremely small. Thus, for strain measurement a Wheatstone bridge is formed to convert the resistance change to a voltage change. Suppose in Fig. 3 resistances (Ω) are R1, R2, R3 and R4 and the bridge voltage (V) is E. Then, the output voltage eo (V) is obtained with the following equation: Suppose the resistance R1 is a strain gage and it changes by ΔR due to strain. Then, the output voltage is, R4 R3 Strain gage R1 R2 Bridge voltage E Strain gage Rg Strain gage Rg Active gage Active gage Active gage Dummy gage R R R R R R R R R R Rg2 Rg1 E E E eo eo eo eo Output voltage eo eo = R1R3 – R2R4 . E (R1 + R2) (R3 + R4) eo = (R1 + ΔR)R3 – R2R4 . E (R1 + ΔR + R2) (R3 + R4) If R1 = R2 = R3 = R4 = R, eo = R2 + R ΔR – R2 . E (2R + ΔR) 2R Since R may be regarded extremely larger than ΔR, eo ≒ 1 . ΔR . E = 1 . Ks . ε . E 4 R 4 Thus obtained is an output voltage that is proportional to a change in resistance, i.e. a change in strain. This microscopic output voltage is amplified for analog recording or digitial indication of the strain. Fig. 3 Strain-gage Wiring Systems A strain-gage Wheatstone bridge is configured with 1, 2 or 4 gages according to the measuring purpose. The typical wiring systems are shown in Figs. 4, 5 and 6. For varied strain-gage bridge formation systems, refer to Bridge.pdf. 1-gage system With the 1-gage system, a strain gage is connected to a side of the bridge and a fixed resistor is inserted into each of the other 3 sides. This system can easily be configured, and thus it is widely used for general stress/strain measurement. The 1- gage 2-wire system shown in Fig. 4-1 receives much influence of leads. Therefore, if large temperature changes are antici-pated or if the leadwire length is long, the 1-gage 3-wire system shown in Fig. 4-2 must be used. For the 1-gage 3-wire system, refer to Method of Compensating Temperature Effect of Leadwire (Page 5). Fig. 4-1 Fig. 4-2 2-gage system With the 2-gage system, 2 strain gages are connected to the bridge, one each to the 2 sides or both to 1 side; a fixed resis-tor is inserted into each of the other 2 or 3 sides. See Figs. 5-1 and 5-2 below. There exist the active-dummy method, where one strain gage serves as a dummy gage for temperature compensation, and the active-active method, where both ga-ges serve as active gages. The 2-gage system is used to elim-inate strain components other than the target strain; according to the measuring purpose, 2 gages are connected to the bridge in different ways. For details, refer to How to Form Strain-gage Bridges (Bridge.pdf). Fig. 5-1 Fig. 5-2 4-gage system See Fig. 6. The 4-gage system has 4 strain gages connected one each to all 4 sides of the bridge. This circuit ensures large output of strain-gage transducers and improves temperature compensation as well as eliminates strain components other than the target strain. For details, refer to How to Form Strain-gage Bridges (Bridge.pdf). 2
  • 3. Shape of Beam Bending Moment M 1 M = WL 0 ≤ L ≤ 2 M = W – L L = 0L = 2 2 4 M = ± W 8 2 ≤ L ≤ M = W L – 3 2 4 0 ≤ L ≤ 2 M = WL L = 2 M = – WL 4 2 ≤ L ≤ 2 M = W( – L) 2 0 ≤ L ≤ 1 1 ≤ L ≤ ( 1 + 2) M = WL M = W 1 1 bh2 6 1 . b (h2 3 – h1 3) 6 h2 π d3 32 π . d2 4 – d1 4 32 d2 Fig. 6 Rg4 Rg3 E h L (2) 2-gage System Strain gages bonded symmetrically on the front and rear surfaces of the cantilever as illustrated below output plus and minus signals, respectively, with an equal absolute value. If these 2 gages are connected to adjacent sides of the bridge, the output of the bridge corresponding to the bending strain is doubled and the surface stress σ at the strain-gage bonding site is obtained through the following equation: The 2-gage system discards strain-gage output corresponding to the force applied in the axial direction of the cantilever. L b W W Strain gage Strain gage Strain gage eo Rg1 Rg2 Typical Measurements with Strain Gages Bending Stress Measurement (1) 1-gage System As illustrated below, bond a strain gage on the top surface of a cantilever with a rectangular section. If load W is applied to the unfixed end of the cantilever, the strain-gage bonding site has the following surface stress σ: σ = ε0 . E Strain ε0 is obtained through the following equation: ε0 = 6WL Ebh2 where, b: Width of cantilver h: Thickness of cantilever L: Distance from the load point to the center of strain gage Bending Stress Measurement with 1-gage System σ = ε0 . E 2 Bending Stress Measurement with 2-gage System Equation to Obtain Strain on Beams Strain ε0 on beams is obtained through the following equation: ε0 = M ZE where, M: Bending moment (refer to Table 1) Z: Section modulus (refer to Table 2) E: Young's modulus (refer to Mechanical Properties of Industrial Materials, page 6) Typical shapes of beams and their bending moments M and section moduli Z are shown in Tables 1 and 2. Table 1. Typical Equations to Obtain Bending Moment Table 2. Typical Equations to Obtain Section Modulus Cross Section Section Modulus Z 3
  • 4. Cross Section Polar Modulus of Section Zp Torsional and Shearing Stress Measurement of Axis When twisted, an axis has shearing stress τ, and in the 2 directions inclined by 45° from the axial line it has tensile and compres-sive stress in an equal magnitude to the shearing stress. In measuring strain on a twisted axis under simple shearing stress status, the strain gage does not directly measure the shearing strain but detects tensile or compressive strain initiated by tensile or compressive stress that is simultaneously generated with the shearing stress. Stress conditions on a microscopic part of the surface of the axis may be as illustrated below. Tensile strain Compressive strain Shearing stress τ Tensile stress σ Compressive stress σ τ τ τ Shearing stress γ is defined as illustrated below, and the magnitude is calculated through the following equation: γ = τ G where, G: Shearing modulus (refer to Mechanical Properties of Industrial Materials, page 1) τ: Shearing stress When the axis is twisted, point A moves to point B, thereby initiating torsional angle θ . = γ = 2 γ θ d2 d (1) Stress Measurement with 1-gage System Bond the strain gage on the twisted axis in the direction inclined by 45° from the axial line. The relation between strain ε0 and stress σ is expressed with the following equation to obtain tensile or compressive stress σ: σ = ε0 . E 1 + ν where, ε0: Indicated strain E: Young's modulus (refer to Mechanical Properties of Industrial Materials, page 1) ν: Poisson's ratio Stress σ and shearing stress τ are equal in magnitude, and thus, τ = σ (2) Stress Measurement with 2 or 4-gage System 2 or 4 strain gages forming the strain-gage bridge are strained in an equal magnitude to enable 2 or 4 times larger output. Accordingly, the stress is calculated by dividing the indicated strain by 2 or 4. For axial strain measurement, the 2 or 4-gage system is used to eliminate strain caused by bending moment. Also, for meas-urement of tensile strain and compressive strain, strain gages are symmetrically positioned from the center of the axis as shown below. (3) Application to Torque Measurement Strain on the surface of the axis is proportional to the torque applied to the axis. Thus, the torque is obtained by detecting the strain on the surface. Shearing stress distributed on the lateral section is balanced with the applied torque T, establishing the following equation: T = τ . Zp where, Zp: Polar modulus of section This equation may be rewritten as follows by substituting the shearing stress with the relational expression of tensile strain and stress: T = ε0 . E . Zp 1+ ν The polar modulus of the section is specific to each shape of the cross-section as follows: A strain-gage torque transducer can be designed using the aforementioned relational expression of ε0 and T. Obtain ε0 from the allowable stress for the material, and determine the width d of the axis which is matched with the magnitude of the applied torque. Then, amplify the strain out-put with a strain amplifier and read the output voltage with a measuring instrument. πd3 16 π d2 4 – d1 4 16 d2 4
  • 5. L-5 L-9 L-6 *120Ω gage 0.5 0.11 0.08 0.7 3.2 4.4 11.3 50.6 69.0 Principle of Self-temperature-compensation Gages (SELCOM® Gages) Suppose the measuring object and the resistive element of the strain gage have linear expansion coefficients βs and βg, respectively. Then, the strain gage bonded on the surface of the object provides a thermally-induced apparent strain εT per 1°C that is expressed with the following equation: Resistive element (βg) Resistive element (βs) Temperature (°C) 1 r 2 R3 R2 R3 R2 Rg Rg R1 R1 Rg εT = α + (βs – βg) Typical Temperature Characteristics of Self-temperature-compensation Foil Gage 40 20 0 –20 –40 –60 –80 Thermally-induced apparent strain output (με/°C) –1.8με/°C –1.8με/°C Ks where, α: Resistive temperature coefficient of resistive element Ks: Gage factor of strain gage The self-temperature-compensation gage is designed so that εT in the above equation is approximated to zero by controlling the resistive temperature coefficient of the gage's resistive element according to the linear expansion coefficient of the measuring object. When bonded to a suitable material, KYOWA's self-tempera-ture- compensation gage (SELCOM® gage) minimizes apparent strain in the compensated temperature range to ±1.8με/°C (graph below shows apparent strain output of 3-wire strain gage). Linear Expansion Coefficients of Materials Material Material Quartz glass Amber Brick Tungsten Lumber (grain dir.) Molybdenum Zirconium Cobar Concrete Titanium alloy Platinum Soda-lime glass SUS 631 SUS 630 Cast iron NiCrMo steel Beryllium Common steel Inconel X Nickel Gold SUS 304 Beryllium copper Copper Brass 2024-T4 aluminum 2014-T4 aluminum Magnesium alloy Lead Acrylic resin Polycarbonate Rubber Linear Exp. Coef. 11.5 11.7 12.1 13.3 14.0 16.2 16.7 16.7 21.0 23.2 23.4 27.0 29.0 Approx. 65 to 100 66.6 Approx. 77 Linear Exp. Coef. 0.4 1.1 3.0 to 5.0 4.5 5.0 5.2 5.4 5.9 6.8 to 12.7 8.5 8.9 9.2 10.3 10.6 10.8 11.3 (x10–6/°C) Temperature Effect of Leadwire with 2-wire System Leadwire Cross-Sectional Model Area of Conductor (mm2) Reciprocating Resistance of 10m long Leadwire approx. (Ω) Apparent Strain* with 10m Extension approx. (με/°C) Thermally-induced apparent strain εr (με/°C) is obtained through the following equation. εr = r . α Rg + r Ks where, Rg: Resistance of strain gage (Ω) r : Resistance of leadwire (Ω) Ks: Preset gage factor of strain amplifier, usually 2.00 α: Resistive temperature coefficient of copper wire (ΔR/R/°C), 3.9 x10⁻³ 1 r 2 Method of Compensating Temperature Effect of Leadwire (3-wire System) For effective self-temperature-compensation, SELCOM® gages adopt the 1-gage system. However, if the leadwire cable is a 2-wire system, strain output from the bridge is affected by temperature effect of the leadwire. To avoid such adverse effect, the 3-wire system is adopted. If 3 leads are connected to the strain gage as shown below, one half the leadwire resistance is applied to the adjacent side of the bridge to compensate the resistive components of the 2 leads affected by a similar temperature change, and thus the bridge output is free from any temperature effect of the leadwire. The temperature effect of a third lead connected directly to the amplifier can be ignored since the amplifier provides a high input impedance. As precautions in using the 3-wire system, the 3 leads should be the same in type, length and cross-section to receive the same temperature effect. If they are exposed to direct sunlight, the coating color too should be identical. 1 2 r 1 2 r 1 2 r 1 2 r 1 2 r 1 2 r 5
  • 6. Resistive element Gage base Misalignment Effect The strain ε0 measured by a strain gage that is misaligned by an angle from the direction of the principal strain is expressed with the following equation: Strain direction ε2 ε0 ε1 t r Influence of Insulation Resistance The insulation resistance of a strain gage including leads does not affect the measured value if it is higher than 100MΩ. But if the insulation resistance changes drastically during measure-ment, it causes the measured value to include an error. R Output R Strain gage Rg r1 r2 Insulation resistance Input Bridge Circuit Designed with Insulation Resistance Taken into Consideration If the insulation resistance descends from r1 to r2 in the figure above, error strain ε is: ε Rg(r1 – r2) Ksr1r2 Suppose, Rg = 120Ω (resistance of strain gage) Ks = 2.00 (gage factor of strain gage) r1 = 1000MΩ (original insulation resistance) r2 = 10MΩ (changed insulation resistance) Then, the error strain is approximately 6με. In general strain measurement, such an error causes virtually no problem. In practice, however, the lowered insulation resist-ance, r2, is not kept constant but sharply changes due to temperature, humidity and other conditions. Thus, it is not possible to specify to which part of the circuit the insulation resistance r is applied. Accordingly, precautions should be taken. Resistance Change of Strain Gage Bonded to Curved Surface The strain εc occurring on the resistive element of a strain gage bonded to a curved surface may be expressed with the following equation: εc = t 2r + t where, t: Thickness of gage base plus adhesive layer r: Radius of gage bonding surface For example, if a uniaxial KFG gage of which the gage base including the adhesive layer is 0.015mm thick, is bonded to a curved surface of 1.5r, the strain gage receives strain of approximately 5000με under the mere bonding condition. If the gage factor Ks is 2.00, ΔR/R 10000με since ΔR/R = ε . Ks. If the gage resistance is 120Ω, it increases by approximately 1.2Ω. If the gage is bonded inside the curve, the resistance decreases. t 2 Strain Gage Bonded on Curved Surface Method of Compensating Gage Factors If the gage factor of the strain gage is different from that (2.00) of the strain amplifier, the real strain ε can be obtained through the following equation: ε = 2.00 x εi Ks where, εi: Measured strain Ks: Gage factor of strain gage θ ε0 = 1 {(ε1 + ε2) + (ε1 – ε2) cos 2 } 2 θ If ε2 = –νε1 (ν: Poisson's ratio) under the uniaxial stress condi-tion, ε0 = 1 ε1{(1 – ν) + (1 + ν) cos 2θ } 2 Method of Compensating Leadwire Extension Effect If the leadwire or cable is extended with the 1-gage or 2-gage system, additional resistance is initiated in series to the strain gage, thereby decreasing the apparent gage factor. For example, if a 10m long leadwire with 0.3mm2 conductors is used, the gage factor decreases by 1%. In the case of the 4- gage system (transducer), the extension decreases the bridge voltage too. In these cases, the real strain ε can be obtained through the following equation (Supposing the gage factor Ks is 2.00): ε = (1 + r  ) x εi Rg where, εi: Measured strain Rg: Resistance of strain gage r : Total resistance of leadwire (For reciprocating resistance, see the table on the next page.) One-way resistance in the case of 3-wire system 6
  • 7. Reciprocating Resistance of Leadwire Number/Diameter of Strands Cross-Section (mm2) Reciprocating Resistance per 10m (Ω) Method of Compensating Nonlinearity of 1-gage System Nonlinearity beyond the specification in large strain measure-ment with the 1-gage system can be compensated through the following equation to obtain the real strain ε: Remarks 0.08 0.11 0.3 0.5 4.4 3.2 1.17 0.7 L-6, 7 L-9, 10 L-2 L-5 7/0.12 10/0.12 12/0.18 20/0.18 ε = ε0 (x10–6) 1 – ε0 where, ε0: Measured strain Method of Obtaining Magnitude and Direction of Principal Stress (Rosette Analysis) Usually, if the direction of the principal stress is unknown in stress measurement of structures, a triaxial rosette gage is used and multiple physical quantities are obtained by putting measured strain values in the following equations. (These equations apply to right-angled triaxial rosette gages.)  Precautions in Analysis (1) Regard εa εb εc as the forward direction. (2) Angle is: Angle of the maximum strain to the εa axis when εa εc; Angle of the minimum strain to the εa axis when εa εc. Comparison between εa and εc in magnitude includes plus and minus signs. Max. principal strain Min. principal strain Direction of principal strain (from εa axis) Max. shearing strain Max. principal stress Min. principal stress Max. shearing stress εmax. = 1 [εa + εc + 2 { (εa – εb)2+ (εb – εc)2} ] 2 εmin. = 1 [εa + εc – 2{(εa – εb)2+ (εb – εc)2} ] 2 θ = 1 tan–1 [ 2εb – εa – εc ] 2 εa – εc γmax. = 2 { (εa – εb)2+ (εb – εc)2} σmax. = E [(1 + ν) (εa + εc) + (1 – ν) Generating Calibration Value based on Tip Parallel Resistance Method When extending the leadwire by several hundred meters or to obtain an accurate calibration value, use the tip parallel resist-ance method. The parallel resistance r can be obtained through the following equation: r = Rg Ks . ε where, Rg: Resistance of strain gage Ks: Gage factor of strain gage ε: Calibration strain value Examples of Calibration Strain Value and Resistance (Rg = 120Ω, Ks = 2.00) Calibration Strain Value Resistance, r (approx.) 100 με 200 με 500 με 1000 με 2000 με 600 kΩ 300 kΩ 120 kΩ 60 kΩ 30 kΩ 2 (1 – ν2) x 2 { (εa – εb)2+ (εb – εc)2} ] σmin. = E [(1 + ν) (εa + εc) – (1 – ν) 2 (1 – ν2) x 2 { (εa – εb)2+ (εb – εc)2} ] τmax. = E x 2 { (εa – εb)2+ (εb – εc)2} 2 (1 – ν) ν: Poisson's ratio E: Young's modulus (Refer to Mechanical Properties of Industrial Materials (page 6). 7
  • 8. Typical Strain Gage Bonding Method and Dampproofing Treatment The strain gage bonding method differs depending on the type of adhesive applied. The description below applies to a case where the leadwire-equipped KFG gage is bonded to a mild steel test piece with a representative cyanoacrylate adhesive, CC-33A. The dampproofing treatment is in the case of using an butyl rubber coating agent, AK-22. Like drawing a circle with sandpaper (#300 or so), polish the strain gage bonding site in a considerably wider area than the strain gage size. (If the measuring object is a practical structure, wipe off paint, rust and plating with a grinder or sand blast. Then, polish with sandpaper.) Make sure of the front (metal foil part) and the back of the strain gage. Apply a drop of adhesive to the back and immediately put the strain gage on the bonding site. (Do not spread the adhesive over the back. If so, curing is adversely accelerated.) When the adhesive is cured, remove the polyethylene sheet and check the bonding condition. Ideally, the adhesive is slightly forced out from around the strain gage. If the adhesive is widely forced out from around the gage base, remove the protruding adhesive with a cutter or sandpaper. Place gage leads in a slightly slackened condition. Put up the leadwire from before the part where the adhesive is applied. Place a block of the coating agent below the leadwire with gage leads slightly  slackened. Completely cover the strain gage, protruding adhesive and part of the leadwire with another block of the coating agent. Do not tear the block to pieces but slightly flatten it with a finger to closely contact it with the strain gage and part of the leadwire. Completely hide protrusions including gage leads behind the coating agent. Using an absorbent cotton, gauze or SILBON paper dipped in a highly volatile solvent such as acetone which dissolves oils and fats, strongly wipe the bonding site in a single direction to remove oils and fats. Reciprocated wiping does not clean the surface. After cleaning, mark the strain gage bonding position. Cover the strain gage with the accessory polyethylene sheet and strongly press the strain gage over the sheet with a thumb for approxi-mately 1 minute (do not detach midway). Quickly perform steps 3 and 4. Otherwise, the adhesive is cured. Once the strain gage is put on the bonding site, do not put it up to adjust the position. Strain Gage Bonding Manual is available from KYOWA at a price of ¥1,200 per copy. If required, contact your KYOWA sales representative. 8