UNDERSTANDING WHAT GREEN WASHING IS!.pdfJulietMogola
Many companies today use green washing to lure the public into thinking they are conserving the environment but in real sense they are doing more harm. There have been such several cases from very big companies here in Kenya and also globally. This ranges from various sectors from manufacturing and goes to consumer products. Educating people on greenwashing will enable people to make better choices based on their analysis and not on what they see on marketing sites.
Willie Nelson Net Worth: A Journey Through Music, Movies, and Business Venturesgreendigital
Willie Nelson is a name that resonates within the world of music and entertainment. Known for his unique voice, and masterful guitar skills. and an extraordinary career spanning several decades. Nelson has become a legend in the country music scene. But, his influence extends far beyond the realm of music. with ventures in acting, writing, activism, and business. This comprehensive article delves into Willie Nelson net worth. exploring the various facets of his career that have contributed to his large fortune.
Follow us on: Pinterest
Introduction
Willie Nelson net worth is a testament to his enduring influence and success in many fields. Born on April 29, 1933, in Abbott, Texas. Nelson's journey from a humble beginning to becoming one of the most iconic figures in American music is nothing short of inspirational. His net worth, which estimated to be around $25 million as of 2024. reflects a career that is as diverse as it is prolific.
Early Life and Musical Beginnings
Humble Origins
Willie Hugh Nelson was born during the Great Depression. a time of significant economic hardship in the United States. Raised by his grandparents. Nelson found solace and inspiration in music from an early age. His grandmother taught him to play the guitar. setting the stage for what would become an illustrious career.
First Steps in Music
Nelson's initial foray into the music industry was fraught with challenges. He moved to Nashville, Tennessee, to pursue his dreams, but success did not come . Working as a songwriter, Nelson penned hits for other artists. which helped him gain a foothold in the competitive music scene. His songwriting skills contributed to his early earnings. laying the foundation for his net worth.
Rise to Stardom
Breakthrough Albums
The 1970s marked a turning point in Willie Nelson's career. His albums "Shotgun Willie" (1973), "Red Headed Stranger" (1975). and "Stardust" (1978) received critical acclaim and commercial success. These albums not only solidified his position in the country music genre. but also introduced his music to a broader audience. The success of these albums played a crucial role in boosting Willie Nelson net worth.
Iconic Songs
Willie Nelson net worth is also attributed to his extensive catalog of hit songs. Tracks like "Blue Eyes Crying in the Rain," "On the Road Again," and "Always on My Mind" have become timeless classics. These songs have not only earned Nelson large royalties but have also ensured his continued relevance in the music industry.
Acting and Film Career
Hollywood Ventures
In addition to his music career, Willie Nelson has also made a mark in Hollywood. His distinctive personality and on-screen presence have landed him roles in several films and television shows. Notable appearances include roles in "The Electric Horseman" (1979), "Honeysuckle Rose" (1980), and "Barbarosa" (1982). These acting gigs have added a significant amount to Willie Nelson net worth.
Television Appearances
Nelson's char
Artificial Reefs by Kuddle Life Foundation - May 2024punit537210
Situated in Pondicherry, India, Kuddle Life Foundation is a charitable, non-profit and non-governmental organization (NGO) dedicated to improving the living standards of coastal communities and simultaneously placing a strong emphasis on the protection of marine ecosystems.
One of the key areas we work in is Artificial Reefs. This presentation captures our journey so far and our learnings. We hope you get as excited about marine conservation and artificial reefs as we are.
Please visit our website: https://kuddlelife.org
Our Instagram channel:
@kuddlelifefoundation
Our Linkedin Page:
https://www.linkedin.com/company/kuddlelifefoundation/
and write to us if you have any questions:
info@kuddlelife.org
WRI’s brand new “Food Service Playbook for Promoting Sustainable Food Choices” gives food service operators the very latest strategies for creating dining environments that empower consumers to choose sustainable, plant-rich dishes. This research builds off our first guide for food service, now with industry experience and insights from nearly 350 academic trials.
Characterization and the Kinetics of drying at the drying oven and with micro...Open Access Research Paper
The objective of this work is to contribute to valorization de Nephelium lappaceum by the characterization of kinetics of drying of seeds of Nephelium lappaceum. The seeds were dehydrated until a constant mass respectively in a drying oven and a microwawe oven. The temperatures and the powers of drying are respectively: 50, 60 and 70°C and 140, 280 and 420 W. The results show that the curves of drying of seeds of Nephelium lappaceum do not present a phase of constant kinetics. The coefficients of diffusion vary between 2.09.10-8 to 2.98. 10-8m-2/s in the interval of 50°C at 70°C and between 4.83×10-07 at 9.04×10-07 m-8/s for the powers going of 140 W with 420 W the relation between Arrhenius and a value of energy of activation of 16.49 kJ. mol-1 expressed the effect of the temperature on effective diffusivity.
Natural farming @ Dr. Siddhartha S. Jena.pptxsidjena70
A brief about organic farming/ Natural farming/ Zero budget natural farming/ Subash Palekar Natural farming which keeps us and environment safe and healthy. Next gen Agricultural practices of chemical free farming.
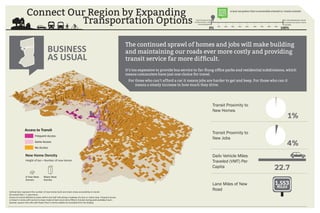
1. Connect Our Region by Expanding
Transportation Options
0% 100%
10% 20% 30% 40% 50% 60% 70% 80% 90%
Transit should not be
considered when citing
new development
ALL new development should
be located near where transit
is feasible
Access to Transit
Frequent Access
Some Access
No Access
New Home Density
A Few New
Homes
Many New
Homes
Height of bar = Number of new homes
Vertical bars represent the number of new homes built and colors show accessibility to transit.
50 vertical feet = 1 new home.
Access to transit defined as areas within one-half mile along a roadway of a bus or metro stop. Frequent access
is shown in areas with access to stops made at least once every fifteen minutes during peak weekday hours.
Quarter square mile cells with fewer than 5 homes added are excluded from the display.
BUSINESS
AS USUAL
The continued sprawl of homes and jobs will make building
and maintaining our roads ever more costly and providing
transit service far more difficult.
It’s too expensive to provide bus service to far-flung office parks and residential subdivisions, which
means commuters have just one choice for travel.
For those who can’t afford a car it means jobs are harder to get and keep. For those who can it
means a steady increase in how much they drive.
Transit Proximity to
New Homes
1%
Transit Proximity to
New Jobs
4%
Dailv Vehicle Miles
Traveled (VMT) Per
Capita 22.7
Lane Miles of New
Road
1,553
MILES
A land use pattern that is automobile oriented vs. transit oriented
WHERE
DO OUR
SCENARIOS
FALL?
2. Connect Our Region by Expanding
Transportation Options
0% 100%
10% 20% 30% 40% 50% 60% 70% 80% 90%
Transit should not be
considered when citing
new development
ALL new development should
be located near where transit
is feasible
Access to Transit
Frequent Access
Some Access
No Access
New Home Density
A Few New
Homes
Many New
Homes
Height of bar = Number of new homes
Vertical bars represent the number of new homes built and colors show accessibility to transit.
50 vertical feet = 1 new home.
Access to transit defined as areas within one-half mile along a roadway of a bus or metro stop. Frequent access
is shown in areas with access to stops made at least once every fifteen minutes during peak weekday hours.
Quarter square mile cells with fewer than 5 homes added are excluded from the display.
A land use pattern that is automobile oriented vs. transit oriented
WHERE
DO OUR
SCENARIOS
FALL?
A REGION
OF VILLAGES
Dense urban cores and outlying village centers would allow
for a more efficient “hub and spoke” transit system.
“A Region of Villages” imagines a development pattern where high frequency transit would be more
feasible in connecting the central cities and outlying areas.
This more transit friendly approach to land use would mean less dependence on the automobile to get
around.
Transit Proximity to
New Homes
45%
Transit Proximity to
New Jobs
63%
Dailv Vehicle Miles
Traveled (VMT) Per
Capita 17.7
Lane Miles of New Road
496
MILES
3. Connect Our Region by Expanding
Transportation Options
0% 100%
10% 20% 30% 40% 50% 60% 70% 80% 90%
Transit should not be
considered when citing
new development
ALL new development should
be located near where transit
is feasible
SPRAWLING
SMARTER
“Smart growth” in the suburbs would reduce new
infrastructure costs some but better jobs-housing
connections would still come from redevelopment in areas
best-served by transit.
New suburban development would be more walkable and more cost-effective, but access to jobs would
mostly be by private automobile.
Access to Transit
Frequent Access
Some Access
No Access
New Home Density
A Few New
Homes
Many New
Homes
Height of bar = Number of new homes
Vertical bars represent the number of new homes built and colors show accessibility to transit.
50 vertical feet = 1 new home.
Access to transit defined as areas within one-half mile along a roadway of a bus or metro stop. Frequent access
is shown in areas with access to stops made at least once every fifteen minutes during peak weekday hours.
Quarter square mile cells with fewer than 5 homes added are excluded from the display.
Transit Proximity to
New Homes
20%
Transit Proximity to
New Jobs
39%
Dailv Vehicle Miles
Traveled (VMT) Per
Capita 18.1
Lane Miles of New Road
729
MILES
A land use pattern that is automobile oriented vs. transit oriented
WHERE
DO OUR
SCENARIOS
FALL?
4. Connect Our Region by Expanding
Transportation Options
0% 100%
10% 20% 30% 40% 50% 60% 70% 80% 90%
Transit should not be
considered when citing
new development
ALL new development should
be located near where transit
is feasible
Access to Transit
Frequent Access
Some Access
No Access
New Home Density
A Few New
Homes
Many New
Homes
Height of bar = Number of new homes
Vertical bars represent the number of new homes built and colors show accessibility to transit.
50 vertical feet = 1 new home.
Access to transit defined as areas within one-half mile along a roadway of a bus or metro stop. Frequent access
is shown in areas with access to stops made at least once every fifteen minutes during peak weekday hours.
Quarter square mile cells with fewer than 5 homes added are excluded from the display.
A land use pattern that is automobile oriented vs. transit oriented
WHERE
DO OUR
SCENARIOS
FALL?
BACK TO
THE CITY
Concentrating new jobs and housing in center cities and
older suburbs would focus development in areas best served
by transit.
When jobs and homes are both in the matrix of high-frequency bus and rail service, people have more
choices for how to get to work or school.
Having jobs and homes closer together also makes it easier for people to walk or bike to
work or school.
Transit Proximity to
New Homes
50%
Transit Proximity to
New Jobs
72%
Dailv Vehicle Miles
Traveled (VMT) Per
Capita 16.8
Lane Miles of New Road
261
MILES