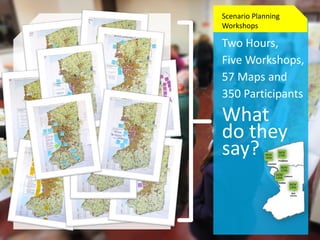
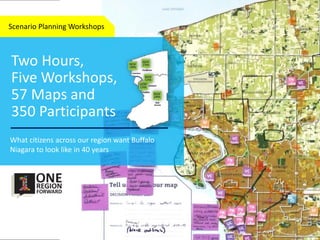
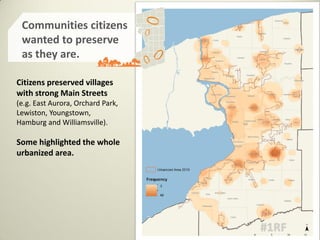
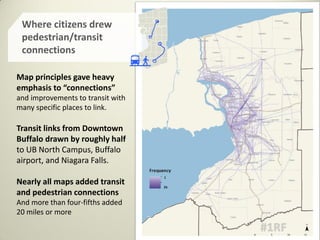
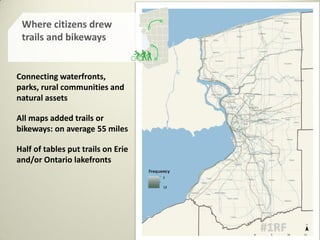
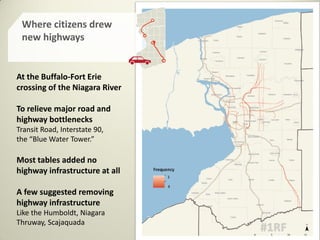
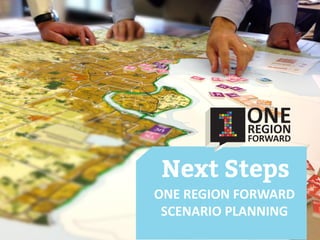
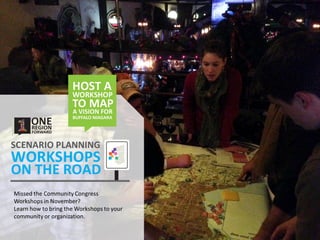
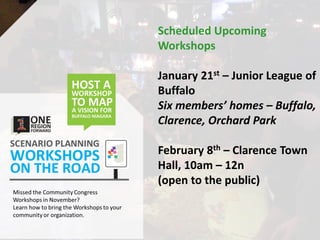
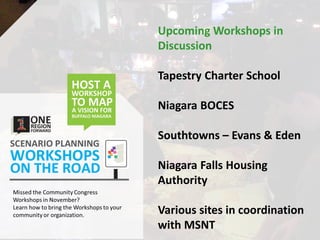
Scenario Planning Workshops
Mapping a Future
Buffalo Niagara
Update on Findings
January 17, 2014
Two Hours,
Five Workshops,
57 Maps and
350 Participants
What
do they
say?
Scenario Planning
Workshops
Two Hours,
Five Workshops,
57 Maps and
350 Participants
Scenario Planning Workshops
What citizens across our region want Buffalo
Niagara to look like in 40 years
Citizens preserved villages
with strong Main Streets
(e.g. East Aurora, Orchard Park,
Lewiston, Youngstown,
Hamburg and Williamsville).
Some highlighted the whole
urbanized area.
Communities citizens
wanted to preserve
as they are.
Farmland protection and
open space conservation
were strong themes in principles
and in practice (mapping).
35 percent of maps
protected everything outside
the urbanized area…
the functional equivalent of an
urban growth boundary.
Controlling sprawl was a
prominent principle
for almost half the tables
Natural Areas citizens
wanted to preserve
from development
Where citizens placed
Urban Center chips
Downtowns in Buffalo and
Niagara Falls were prioritized
More than 90 percent of maps
focused revitalization there.
That translates to 64 percent of
new jobs and 11 percent of new
housing in downtown areas.
Lockport, Amherst, and the
Tonawandas were seen by some as
potential centers of urban growth.
To strengthen existing village
centers around the region.
Revitalizing neighborhoods in
urban areas like the East Side.
Emphasizing “mixed use,”
“density,” and “walkability.”
One quarter of new homes
and 14 percent of new jobs.
The most popular place type.
Why citizens placed
Village Center chips
Older urban neighborhoods
Where vacant land and distressed
housing may prevail.
Inner ring suburbs, villages
Experiencing the first signs of
decline and disinvestment.
Three fifths of new housing
and 5 percent of new jobs
in traditional neighborhoods
Revitalization of existing areas
emphasized in principles
Where citizens placed
Traditional Neighborhoods
The edge of the urbanized area
Filling in between existing
suburban developments.
Revitalizing urban areas
Such as Niagara Falls and
neighborhoods on the Buffalo
Cheektowaga border.
Citizens used SF chips sparingly
Trading in 45 percent for denser
forms of development – accounting
for only 7 percent of new housing.
Where citizens placed
Single Family chips
Across the rural towns of the
Buffalo Niagara region
Or the edge of the urbanized area.
Only 2 percent of new homes
at one per acre or more.
The least popular place type
With 85 percent of chips traded
away for more dense development
and many maps with none.
Where citizens placed
Exurban Residential chips
Almost exclusively within the
urbanized area
Often near highways and clusters
of existing strip retail.
Only six percent of new jobs
in “suburban strip” developments
Participants preferred urban
forms of retail development
Trading in nearly three-fifths of SS
chips for other place types
Where citizens placed
Suburban Strip chips
Existing industrial areas or
“brownfields” especially…
South Buffalo, Lackawanna,
Tonawanda and Niagara Falls
Many suburban areas
suggesting office development
near highway infrastructure.
Job creation was a priority
with fewer of these chips traded
away even if participants weren’t
fond of the place type.
Where citizens placed
Office Industrial chips
Map principles gave heavy
emphasis to “connections”
and improvements to transit with
many specific places to link.
Transit links from Downtown
Buffalo drawn by roughly half
to UB North Campus, Buffalo
airport, and Niagara Falls.
Nearly all maps added transit
and pedestrian connections
And more than four-fifths added
20 miles or more
Where citizens drew
pedestrian/transit
connections
Connecting waterfronts,
parks, rural communities and
natural assets
All maps added trails or
bikeways: on average 55 miles
Half of tables put trails on Erie
and/or Ontario lakefronts
Where citizens drew
trails and bikeways
At the Buffalo-Fort Erie
crossing of the Niagara River
To relieve major road and
highway bottlenecks
Transit Road, Interstate 90,
the “Blue Water Tower.”
Most tables added no
highway infrastructure at all
A few suggested removing
highway infrastructure
Like the Humboldt, Niagara
Thruway, Scajaquada
Where citizens drew
new highways
ONE REGION FORWARD
SCENARIO PLANNING
Scheduled Upcoming
Workshops
January 21st – Junior League of
Buffalo
Six members’ homes – Buffalo,
Clarence, Orchard Park
February 8th – Clarence Town
Hall, 10am – 12n
(open to the public)
Upcoming Workshops in
Discussion
Tapestry Charter School
Niagara BOCES
Southtowns – Evans & Eden
Niagara Falls Housing
Authority
Various sites in coordination
with MSNT
ONE REGION FORWARD
SCENARIO PLANNING

1rf cc report

  • 1.
    Scenario Planning Workshops Mappinga Future Buffalo Niagara Update on Findings January 17, 2014
  • 2.
    Two Hours, Five Workshops, 57Maps and 350 Participants What do they say? Scenario Planning Workshops
  • 3.
    Two Hours, Five Workshops, 57Maps and 350 Participants Scenario Planning Workshops What citizens across our region want Buffalo Niagara to look like in 40 years
  • 4.
    Citizens preserved villages withstrong Main Streets (e.g. East Aurora, Orchard Park, Lewiston, Youngstown, Hamburg and Williamsville). Some highlighted the whole urbanized area. Communities citizens wanted to preserve as they are.
  • 5.
    Farmland protection and openspace conservation were strong themes in principles and in practice (mapping). 35 percent of maps protected everything outside the urbanized area… the functional equivalent of an urban growth boundary. Controlling sprawl was a prominent principle for almost half the tables Natural Areas citizens wanted to preserve from development
  • 6.
    Where citizens placed UrbanCenter chips Downtowns in Buffalo and Niagara Falls were prioritized More than 90 percent of maps focused revitalization there. That translates to 64 percent of new jobs and 11 percent of new housing in downtown areas. Lockport, Amherst, and the Tonawandas were seen by some as potential centers of urban growth.
  • 7.
    To strengthen existingvillage centers around the region. Revitalizing neighborhoods in urban areas like the East Side. Emphasizing “mixed use,” “density,” and “walkability.” One quarter of new homes and 14 percent of new jobs. The most popular place type. Why citizens placed Village Center chips
  • 8.
    Older urban neighborhoods Wherevacant land and distressed housing may prevail. Inner ring suburbs, villages Experiencing the first signs of decline and disinvestment. Three fifths of new housing and 5 percent of new jobs in traditional neighborhoods Revitalization of existing areas emphasized in principles Where citizens placed Traditional Neighborhoods
  • 9.
    The edge ofthe urbanized area Filling in between existing suburban developments. Revitalizing urban areas Such as Niagara Falls and neighborhoods on the Buffalo Cheektowaga border. Citizens used SF chips sparingly Trading in 45 percent for denser forms of development – accounting for only 7 percent of new housing. Where citizens placed Single Family chips
  • 10.
    Across the ruraltowns of the Buffalo Niagara region Or the edge of the urbanized area. Only 2 percent of new homes at one per acre or more. The least popular place type With 85 percent of chips traded away for more dense development and many maps with none. Where citizens placed Exurban Residential chips
  • 11.
    Almost exclusively withinthe urbanized area Often near highways and clusters of existing strip retail. Only six percent of new jobs in “suburban strip” developments Participants preferred urban forms of retail development Trading in nearly three-fifths of SS chips for other place types Where citizens placed Suburban Strip chips
  • 12.
    Existing industrial areasor “brownfields” especially… South Buffalo, Lackawanna, Tonawanda and Niagara Falls Many suburban areas suggesting office development near highway infrastructure. Job creation was a priority with fewer of these chips traded away even if participants weren’t fond of the place type. Where citizens placed Office Industrial chips
  • 13.
    Map principles gaveheavy emphasis to “connections” and improvements to transit with many specific places to link. Transit links from Downtown Buffalo drawn by roughly half to UB North Campus, Buffalo airport, and Niagara Falls. Nearly all maps added transit and pedestrian connections And more than four-fifths added 20 miles or more Where citizens drew pedestrian/transit connections
  • 14.
    Connecting waterfronts, parks, ruralcommunities and natural assets All maps added trails or bikeways: on average 55 miles Half of tables put trails on Erie and/or Ontario lakefronts Where citizens drew trails and bikeways
  • 15.
    At the Buffalo-FortErie crossing of the Niagara River To relieve major road and highway bottlenecks Transit Road, Interstate 90, the “Blue Water Tower.” Most tables added no highway infrastructure at all A few suggested removing highway infrastructure Like the Humboldt, Niagara Thruway, Scajaquada Where citizens drew new highways
  • 16.
  • 18.
    Scheduled Upcoming Workshops January 21st– Junior League of Buffalo Six members’ homes – Buffalo, Clarence, Orchard Park February 8th – Clarence Town Hall, 10am – 12n (open to the public)
  • 19.
    Upcoming Workshops in Discussion TapestryCharter School Niagara BOCES Southtowns – Evans & Eden Niagara Falls Housing Authority Various sites in coordination with MSNT
  • 20.