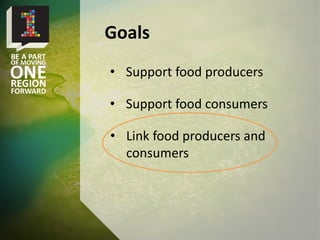
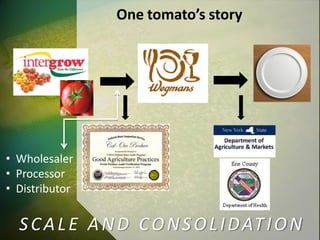
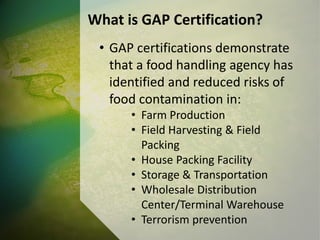
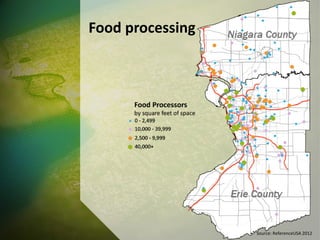
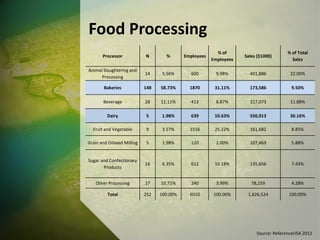
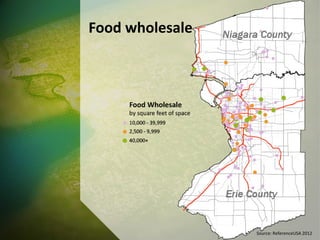
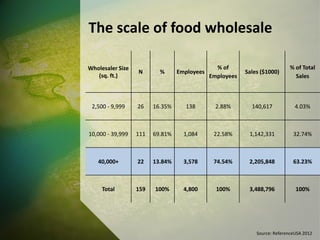
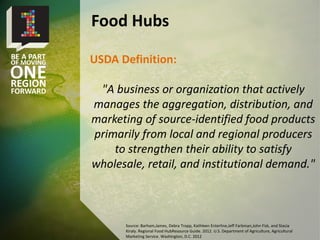
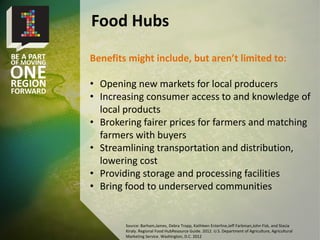
Planning for food in a
sustainable Erie-Niagara
region
Growing Together
• Support food producers
• Support food consumers
• Link food producers and
consumers
Goals
One tomato’s story
• Wholesaler
• Processor
• Distributor
SCALE AND CONSOLIDATION
What is GAP Certification?
• GAP certifications demonstrate
that a food handling agency has
identified and reduced risks of
food contamination in:
• Farm Production
• Field Harvesting & Field
Packing
• House Packing Facility
• Storage & Transportation
• Wholesale Distribution
Center/Terminal Warehouse
• Terrorism prevention
Why is GAP Certification important?
• Reduces the possibility of food
contamination
• Consumer demand
• 1 in 6 Americans suffered from a food-
borne illness in 2011.
• Private sector demand
• Increasingly requiring GAP certification
• Food Safety Modernization Act of
2011
• Establishes mandatory minimum
standards, based on known safety risks,
for produce growers to implement and
document.
GAP Certification Process
• Develop a Food Safety Program
• Risk assessment
• Water, soil amendments,
animals/livestock/wildlife, land use
history.
• Manual of Standard Operating Procedures
(SOP’s)
• Audit
• By USDA, NYS Department or Third Party
• Follow-Up Audit
• If initial audit found violations
• Unannounced Verification Audit
• Compliance audit conducted during the
growing season
Challenges and Opportunities?
• “Onerous government mandated
regulations that don’t seem to apply
to small diversified operations”
• Downsides
• Time and effort to become
certified
• Cost to implement and to
maintain certification
• Detailed record keeping is time
consuming and costs more money
One Farmer’s Experience With
GAP Certification
• Certified one crop on a farm that
grows over 40 crops and has
produce sales over 1 million
dollars.
• Total First Year Cost - $5,162
• Capital Costs - $2,560
• Annual Costs - $2,602
Food processing
Source: ReferenceUSA 2012
The scale of food processing
Processor Size
(sq. ft.)
N % Employees
% of
Employees
Sales ($1000)
% of Total
Sales
0 - 2,499 129 51.19% 457 7.60% 45,944 2.52%
2,500 - 9,999 46 18.25% 562 9.35% 90,603 4.96%
10,000 - 39,999 54 21.43% 622 10.35% 338,355 18.52%
40,000+ 23 9.13% 4369 72.70% 1,351,622 74.00%
Total 252 100.00% 6010 100.00% 1,826,524 100.00%
Source: ReferenceUSA 2012
Food Processing
Processor N % Employees
% of
Employees
Sales ($1000)
% of Total
Sales
Animal Slaughtering and
Processing
14 5.56% 600 9.98% 401,886 22.00%
Bakeries 148 58.73% 1870 31.11% 173,586 9.50%
Beverage 28 11.11% 413 6.87% 217,073 11.88%
Dairy 5 1.98% 639 10.63% 550,913 30.16%
Fruit and Vegetable 9 3.57% 1516 25.22% 161,682 8.85%
Grain and Oilseed Milling 5 1.98% 120 2.00% 107,469 5.88%
Sugar and Confectionary
Products
16 6.35% 612 10.18% 135,656 7.43%
Other Processing 27 10.71% 240 3.99% 78,259 4.28%
Total 252 100.00% 6010 100.00% 1,826,524 100.00%
Source: ReferenceUSA 2012
Food wholesale
Source: ReferenceUSA 2012
The scale of food wholesale
Wholesaler Size
(sq. ft.)
N % Employees
% of
Employees
Sales ($1000)
% of Total
Sales
2,500 - 9,999 26 16.35% 138 2.88% 140,617 4.03%
10,000 - 39,999 111 69.81% 1,084 22.58% 1,142,331 32.74%
40,000+ 22 13.84% 3,578 74.54% 2,205,848 63.23%
Total 159 100% 4,800 100% 3,488,796 100%
Source: ReferenceUSA 2012
Wholesaler N % Employees
% of
Employees
Sales ($1000) % of Total Sales
Confectionery
15
9.43%
153
3.19% 181,624 5.21%
Dairy Products
10
6.29%
468
9.75% 391,680 11.23%
Fish & Seafood
11
6.92%
116
2.42% 93,612 2.68%
Fresh Fruits &
Vegetables 15
9.43%
141
2.94% 95,038 2.72%
General Line Grocery
18
11.32%
783
16.31% 890,271 25.52%
Meat & Meat
Products 10
6.29%
271
5.65% 243,673 6.98%
Other Grocery &
Related Products 49
30.82%
433
9.02% 365,452 10.48%
Packaged Frozen
Food 19
11.95%
1,079
22.48% 970,374 27.81%
Total
159
100.00%
4,800
100.00% 3,488,796 100.00%
Source: ReferenceUSA 2012
Wholesale
Corner
Stores
Source: ReferenceUSA, 2012
Corner stores
• No laws prevent corner stores from
selling fresh and nutritious foods.
• Face same regulations as any store
type with same food services.
Corner stores
Challenges to store owners:
• Procurement
• What to purchase, and where?
• Shelf life
• Highly perishable products
• Marketing
• Little experience marketing
specialized products.
• Nutrition education
• Consumers need education
about healthy food and
preparation.
Farmers markets
• 25 in the region
• Some accept EBT (Senior
Farmers Market Nutrition
Program, SNAP) and WIC
• Sell a range of products, from
eggs to veggies to baked goods
and cheese
Direct Marketing
Source: USDA National Farmers Market Directory,
maintained by Agricultural Marketing Services. Accessed
from http://search.ams.usda.gov/farmersmarkets on
4/9/2013
Farmers markets
• Provide direct connection between farmers and consumers on a
periodic basis at a temporary location, such as in a public park or
municipal parking lot.
Opportunities
• Cuts out the middleman, allows farmer initiative
• Farmer-consumer contact increases public awareness
• Can be tied with public food assistance to increase affordability
and access to healthy food
Challenges
• Transport and other marketing costs high for farmer
• No guarantee of sales
• Infrequent – not a stable source of food for most
Direct Marketing
CSAs
• Farmers sell shares, or memberships, at the beginning of a
growing season. In return, shareholders receive weekly supplies of
fresh food throughout the year or the growing season.
• Drop-offs at designated places – farm stands, grocery stores,
community centers, etc.
Opportunities
• Farmers can tailor growing to shares, demonstrated demand.
• Strong connection between farmer and consumer.
• Shares can be distributed creatively, as part of food assistance or
to institutions.
Direct Marketing
Source: USDA Office of Community Development, ‘Technote 20: Community Supported
Agriculture,’ 2001. http://www.rurdev.usda.gov/rbs/CDP-TN20.PDF, LocalHarvest.org
Institutional purchasing
• 200,000 students in school and college eat
at educational institutions each year.
• At UB, Campus Dining and Shops spends
$5.8 million on food (of $6.3 million on
total food services, 2011-2012).
• 28%, or $1.6 million, went to local food
sources (49% of this to Desiderio’s).
• Most non-local spending through Sysco
and US Foods.
• Meat demand cannot be met locally - $1
million.
University at Buffalo Food Purchasing:
Campus Dining and Shops
Does a State
preferred
source carry
the food at
less than 15%
more than
market price?
Does a CCC offer
the food at the
lowest price?
Did the CCC
match the
lowest quoted
price?
Yes?
Purchase.
No? Check
State’s
Centralized
Commodity
Contracts (CCC).
Yes?
Purchase.
No? Get
another quote
and give CCC
two days to
match it.
Yes? Purchase from CCC.
No? Solicit bids
or RFPs for
purchases over
threshold
amount.
Source: Barham,James, Debra Tropp, Kathleen Enterline,Jeff Farbman,John Fisk, and Stacia
Kiraly. Regional Food HubResource Guide. 2012. U.S. Department of Agriculture, Agricultural
Marketing Service. Washington, D.C. 2012
USDA Definition:
"A business or organization that actively
manages the aggregation, distribution, and
marketing of source-identified food products
primarily from local and regional producers
to strengthen their ability to satisfy
wholesale, retail, and institutional demand."
Food Hubs
Source: Barham,James, Debra Tropp, Kathleen Enterline,Jeff Farbman,John Fisk, and Stacia
Kiraly. Regional Food HubResource Guide. 2012. U.S. Department of Agriculture, Agricultural
Marketing Service. Washington, D.C. 2012
Benefits might include, but aren’t limited to:
• Opening new markets for local producers
• Increasing consumer access to and knowledge of
local products
• Brokering fairer prices for farmers and matching
farmers with buyers
• Streamlining transportation and distribution,
lowering cost
• Providing storage and processing facilities
• Bring food to underserved communities
Food Hubs
Source: Barham,James, Debra Tropp, Kathleen Enterline,Jeff Farbman,John Fisk, and Stacia
Kiraly. Regional Food HubResource Guide. 2012. U.S. Department of Agriculture, Agricultural
Marketing Service. Washington, D.C. 2012
Food hubs can:
• Be both virtual (online) and physical
• Broker sales to restaurants, institutions, and
consumers
• Operate as nonprofits, farmer-owned
cooperatives, or private companies
• Specialize or carry a wide range of goods
Food hubs meet the needs of the local food
economy by giving farmers the benefits of scale
without sacrificing the local connection.
Food Hubs
Questions?
Thank you, Working Group!

Linking food producers and consumers

  • 1.
    Planning for foodin a sustainable Erie-Niagara region Growing Together
  • 2.
    • Support foodproducers • Support food consumers • Link food producers and consumers Goals
  • 3.
    One tomato’s story •Wholesaler • Processor • Distributor SCALE AND CONSOLIDATION
  • 4.
    What is GAPCertification? • GAP certifications demonstrate that a food handling agency has identified and reduced risks of food contamination in: • Farm Production • Field Harvesting & Field Packing • House Packing Facility • Storage & Transportation • Wholesale Distribution Center/Terminal Warehouse • Terrorism prevention
  • 5.
    Why is GAPCertification important? • Reduces the possibility of food contamination • Consumer demand • 1 in 6 Americans suffered from a food- borne illness in 2011. • Private sector demand • Increasingly requiring GAP certification • Food Safety Modernization Act of 2011 • Establishes mandatory minimum standards, based on known safety risks, for produce growers to implement and document.
  • 6.
    GAP Certification Process •Develop a Food Safety Program • Risk assessment • Water, soil amendments, animals/livestock/wildlife, land use history. • Manual of Standard Operating Procedures (SOP’s) • Audit • By USDA, NYS Department or Third Party • Follow-Up Audit • If initial audit found violations • Unannounced Verification Audit • Compliance audit conducted during the growing season
  • 7.
    Challenges and Opportunities? •“Onerous government mandated regulations that don’t seem to apply to small diversified operations” • Downsides • Time and effort to become certified • Cost to implement and to maintain certification • Detailed record keeping is time consuming and costs more money
  • 8.
    One Farmer’s ExperienceWith GAP Certification • Certified one crop on a farm that grows over 40 crops and has produce sales over 1 million dollars. • Total First Year Cost - $5,162 • Capital Costs - $2,560 • Annual Costs - $2,602
  • 9.
  • 10.
    The scale offood processing Processor Size (sq. ft.) N % Employees % of Employees Sales ($1000) % of Total Sales 0 - 2,499 129 51.19% 457 7.60% 45,944 2.52% 2,500 - 9,999 46 18.25% 562 9.35% 90,603 4.96% 10,000 - 39,999 54 21.43% 622 10.35% 338,355 18.52% 40,000+ 23 9.13% 4369 72.70% 1,351,622 74.00% Total 252 100.00% 6010 100.00% 1,826,524 100.00% Source: ReferenceUSA 2012
  • 11.
    Food Processing Processor N% Employees % of Employees Sales ($1000) % of Total Sales Animal Slaughtering and Processing 14 5.56% 600 9.98% 401,886 22.00% Bakeries 148 58.73% 1870 31.11% 173,586 9.50% Beverage 28 11.11% 413 6.87% 217,073 11.88% Dairy 5 1.98% 639 10.63% 550,913 30.16% Fruit and Vegetable 9 3.57% 1516 25.22% 161,682 8.85% Grain and Oilseed Milling 5 1.98% 120 2.00% 107,469 5.88% Sugar and Confectionary Products 16 6.35% 612 10.18% 135,656 7.43% Other Processing 27 10.71% 240 3.99% 78,259 4.28% Total 252 100.00% 6010 100.00% 1,826,524 100.00% Source: ReferenceUSA 2012
  • 12.
  • 13.
    The scale offood wholesale Wholesaler Size (sq. ft.) N % Employees % of Employees Sales ($1000) % of Total Sales 2,500 - 9,999 26 16.35% 138 2.88% 140,617 4.03% 10,000 - 39,999 111 69.81% 1,084 22.58% 1,142,331 32.74% 40,000+ 22 13.84% 3,578 74.54% 2,205,848 63.23% Total 159 100% 4,800 100% 3,488,796 100% Source: ReferenceUSA 2012
  • 14.
    Wholesaler N %Employees % of Employees Sales ($1000) % of Total Sales Confectionery 15 9.43% 153 3.19% 181,624 5.21% Dairy Products 10 6.29% 468 9.75% 391,680 11.23% Fish & Seafood 11 6.92% 116 2.42% 93,612 2.68% Fresh Fruits & Vegetables 15 9.43% 141 2.94% 95,038 2.72% General Line Grocery 18 11.32% 783 16.31% 890,271 25.52% Meat & Meat Products 10 6.29% 271 5.65% 243,673 6.98% Other Grocery & Related Products 49 30.82% 433 9.02% 365,452 10.48% Packaged Frozen Food 19 11.95% 1,079 22.48% 970,374 27.81% Total 159 100.00% 4,800 100.00% 3,488,796 100.00% Source: ReferenceUSA 2012 Wholesale
  • 15.
  • 16.
    Corner stores • Nolaws prevent corner stores from selling fresh and nutritious foods. • Face same regulations as any store type with same food services.
  • 17.
    Corner stores Challenges tostore owners: • Procurement • What to purchase, and where? • Shelf life • Highly perishable products • Marketing • Little experience marketing specialized products. • Nutrition education • Consumers need education about healthy food and preparation.
  • 18.
    Farmers markets • 25in the region • Some accept EBT (Senior Farmers Market Nutrition Program, SNAP) and WIC • Sell a range of products, from eggs to veggies to baked goods and cheese Direct Marketing Source: USDA National Farmers Market Directory, maintained by Agricultural Marketing Services. Accessed from http://search.ams.usda.gov/farmersmarkets on 4/9/2013
  • 19.
    Farmers markets • Providedirect connection between farmers and consumers on a periodic basis at a temporary location, such as in a public park or municipal parking lot. Opportunities • Cuts out the middleman, allows farmer initiative • Farmer-consumer contact increases public awareness • Can be tied with public food assistance to increase affordability and access to healthy food Challenges • Transport and other marketing costs high for farmer • No guarantee of sales • Infrequent – not a stable source of food for most Direct Marketing
  • 20.
    CSAs • Farmers sellshares, or memberships, at the beginning of a growing season. In return, shareholders receive weekly supplies of fresh food throughout the year or the growing season. • Drop-offs at designated places – farm stands, grocery stores, community centers, etc. Opportunities • Farmers can tailor growing to shares, demonstrated demand. • Strong connection between farmer and consumer. • Shares can be distributed creatively, as part of food assistance or to institutions. Direct Marketing Source: USDA Office of Community Development, ‘Technote 20: Community Supported Agriculture,’ 2001. http://www.rurdev.usda.gov/rbs/CDP-TN20.PDF, LocalHarvest.org
  • 21.
    Institutional purchasing • 200,000students in school and college eat at educational institutions each year. • At UB, Campus Dining and Shops spends $5.8 million on food (of $6.3 million on total food services, 2011-2012). • 28%, or $1.6 million, went to local food sources (49% of this to Desiderio’s). • Most non-local spending through Sysco and US Foods. • Meat demand cannot be met locally - $1 million.
  • 22.
    University at BuffaloFood Purchasing: Campus Dining and Shops Does a State preferred source carry the food at less than 15% more than market price? Does a CCC offer the food at the lowest price? Did the CCC match the lowest quoted price? Yes? Purchase. No? Check State’s Centralized Commodity Contracts (CCC). Yes? Purchase. No? Get another quote and give CCC two days to match it. Yes? Purchase from CCC. No? Solicit bids or RFPs for purchases over threshold amount.
  • 23.
    Source: Barham,James, DebraTropp, Kathleen Enterline,Jeff Farbman,John Fisk, and Stacia Kiraly. Regional Food HubResource Guide. 2012. U.S. Department of Agriculture, Agricultural Marketing Service. Washington, D.C. 2012 USDA Definition: "A business or organization that actively manages the aggregation, distribution, and marketing of source-identified food products primarily from local and regional producers to strengthen their ability to satisfy wholesale, retail, and institutional demand." Food Hubs
  • 24.
    Source: Barham,James, DebraTropp, Kathleen Enterline,Jeff Farbman,John Fisk, and Stacia Kiraly. Regional Food HubResource Guide. 2012. U.S. Department of Agriculture, Agricultural Marketing Service. Washington, D.C. 2012 Benefits might include, but aren’t limited to: • Opening new markets for local producers • Increasing consumer access to and knowledge of local products • Brokering fairer prices for farmers and matching farmers with buyers • Streamlining transportation and distribution, lowering cost • Providing storage and processing facilities • Bring food to underserved communities Food Hubs
  • 25.
    Source: Barham,James, DebraTropp, Kathleen Enterline,Jeff Farbman,John Fisk, and Stacia Kiraly. Regional Food HubResource Guide. 2012. U.S. Department of Agriculture, Agricultural Marketing Service. Washington, D.C. 2012 Food hubs can: • Be both virtual (online) and physical • Broker sales to restaurants, institutions, and consumers • Operate as nonprofits, farmer-owned cooperatives, or private companies • Specialize or carry a wide range of goods Food hubs meet the needs of the local food economy by giving farmers the benefits of scale without sacrificing the local connection. Food Hubs
  • 26.