4
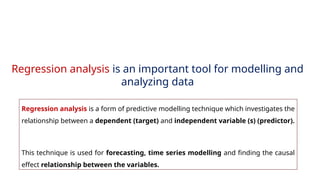
Regression analysis isan important tool for modelling and
analyzing data
Regression analysis is a form of predictive modelling technique which investigates the
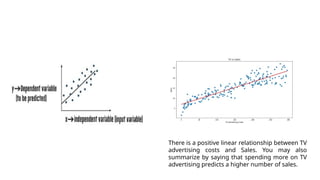
relationship between a dependent (target) and independent variable (s) (predictor).
This technique is used for forecasting, time series modelling and finding the causal
effect relationship between the variables.
6
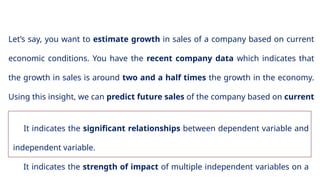
Let’s say, youwant to estimate growth in sales of a company based on current
economic conditions. You have the recent company data which indicates that
the growth in sales is around two and a half times the growth in the economy.
Using this insight, we can predict future sales of the company based on current
& past information.
It indicates the significant relationships between dependent variable and
independent variable.
It indicates the strength of impact of multiple independent variables on a
7.
7
Let’s say, youwant to estimate growth in sales of a company based on current
economic conditions. You have the recent company data which indicates that
the growth in sales is around two and a half times the growth in the economy.
Using this insight, we can predict future sales of the company based on current
& past information.
It indicates the significant relationships between dependent variable and
independent variable.
It indicates the strength of impact of multiple independent variables on a
9
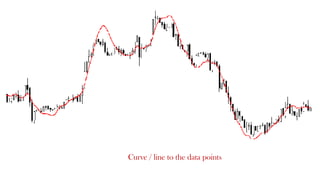
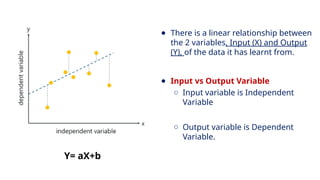
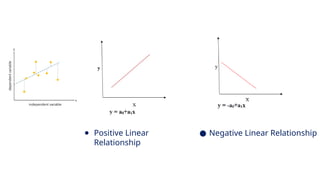
● There isa linear relationship between
the 2 variables, Input (X) and Output
(Y), of the data it has learnt from.
● Input vs Output Variable
○ Input variable is Independent
Variable
○ Output variable is Dependent
Variable.
Y= aX+b
10.
10
There is apositive linear relationship between TV
advertising costs and Sales. You may also
summarize by saying that spending more on TV
advertising predicts a higher number of sales.
12
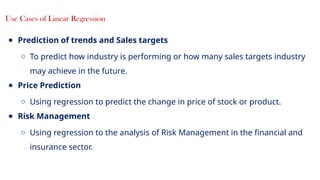
Use Cases ofLinear Regression
● Prediction of trends and Sales targets
○ To predict how industry is performing or how many sales targets industry
may achieve in the future.
● Price Prediction
○ Using regression to predict the change in price of stock or product.
● Risk Management
○ Using regression to the analysis of Risk Management in the financial and
insurance sector.
14
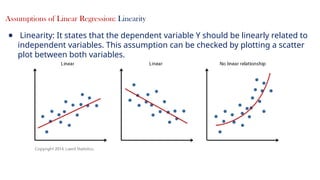
Assumptions of LinearRegression: Linearity
● Linearity: It states that the dependent variable Y should be linearly related to
independent variables. This assumption can be checked by plotting a scatter
plot between both variables.
15.
15
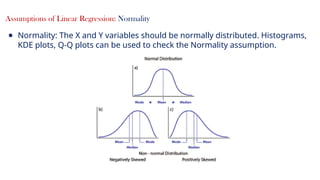
Assumptions of LinearRegression: Normality
● Normality: The X and Y variables should be normally distributed. Histograms,
KDE plots, Q-Q plots can be used to check the Normality assumption.
16.
16
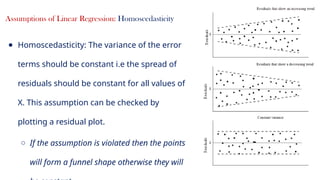
Assumptions of LinearRegression: Homoscedasticity
● Homoscedasticity: The variance of the error
terms should be constant i.e the spread of
residuals should be constant for all values of
X. This assumption can be checked by
plotting a residual plot.
○ If the assumption is violated then the points
will form a funnel shape otherwise they will
17.
17
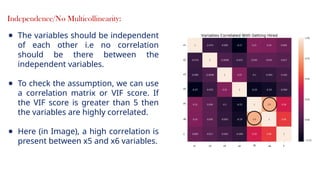
Independence/No Multicollinearity:
● Thevariables should be independent
of each other i.e no correlation
should be there between the
independent variables.
● To check the assumption, we can use
a correlation matrix or VIF score. If
the VIF score is greater than 5 then
the variables are highly correlated.
● Here (in Image), a high correlation is
present between x5 and x6 variables.
18.
18
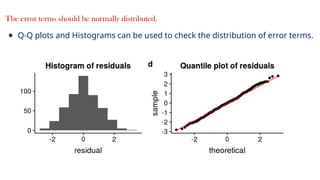
The error termsshould be normally distributed.
● Q-Q plots and Histograms can be used to check the distribution of error terms.
19.
19
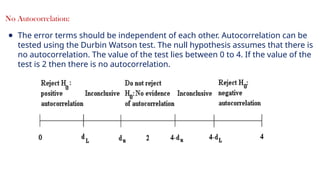
No Autocorrelation:
● Theerror terms should be independent of each other. Autocorrelation can be
tested using the Durbin Watson test. The null hypothesis assumes that there is
no autocorrelation. The value of the test lies between 0 to 4. If the value of the
test is 2 then there is no autocorrelation.
20.
20
Performance Evaluation ofRegression
The performance of the regression model can be evaluated by using
various metrics like MAE, MAPE, RMSE, R-squared etc.
21.
21
Performance Evaluation ofRegression
● Mean Absolute Error (MAE)
● Mean Absolute Percentage Error (MAPE)
● Root Mean Square Error (RMSE)
● R-squared values
● Adjusted R-squared values
22.
22
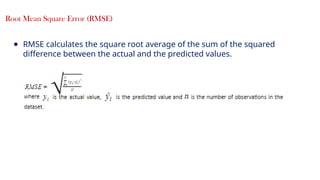
Root Mean SquareError (RMSE)
● RMSE calculates the square root average of the sum of the squared
difference between the actual and the predicted values.