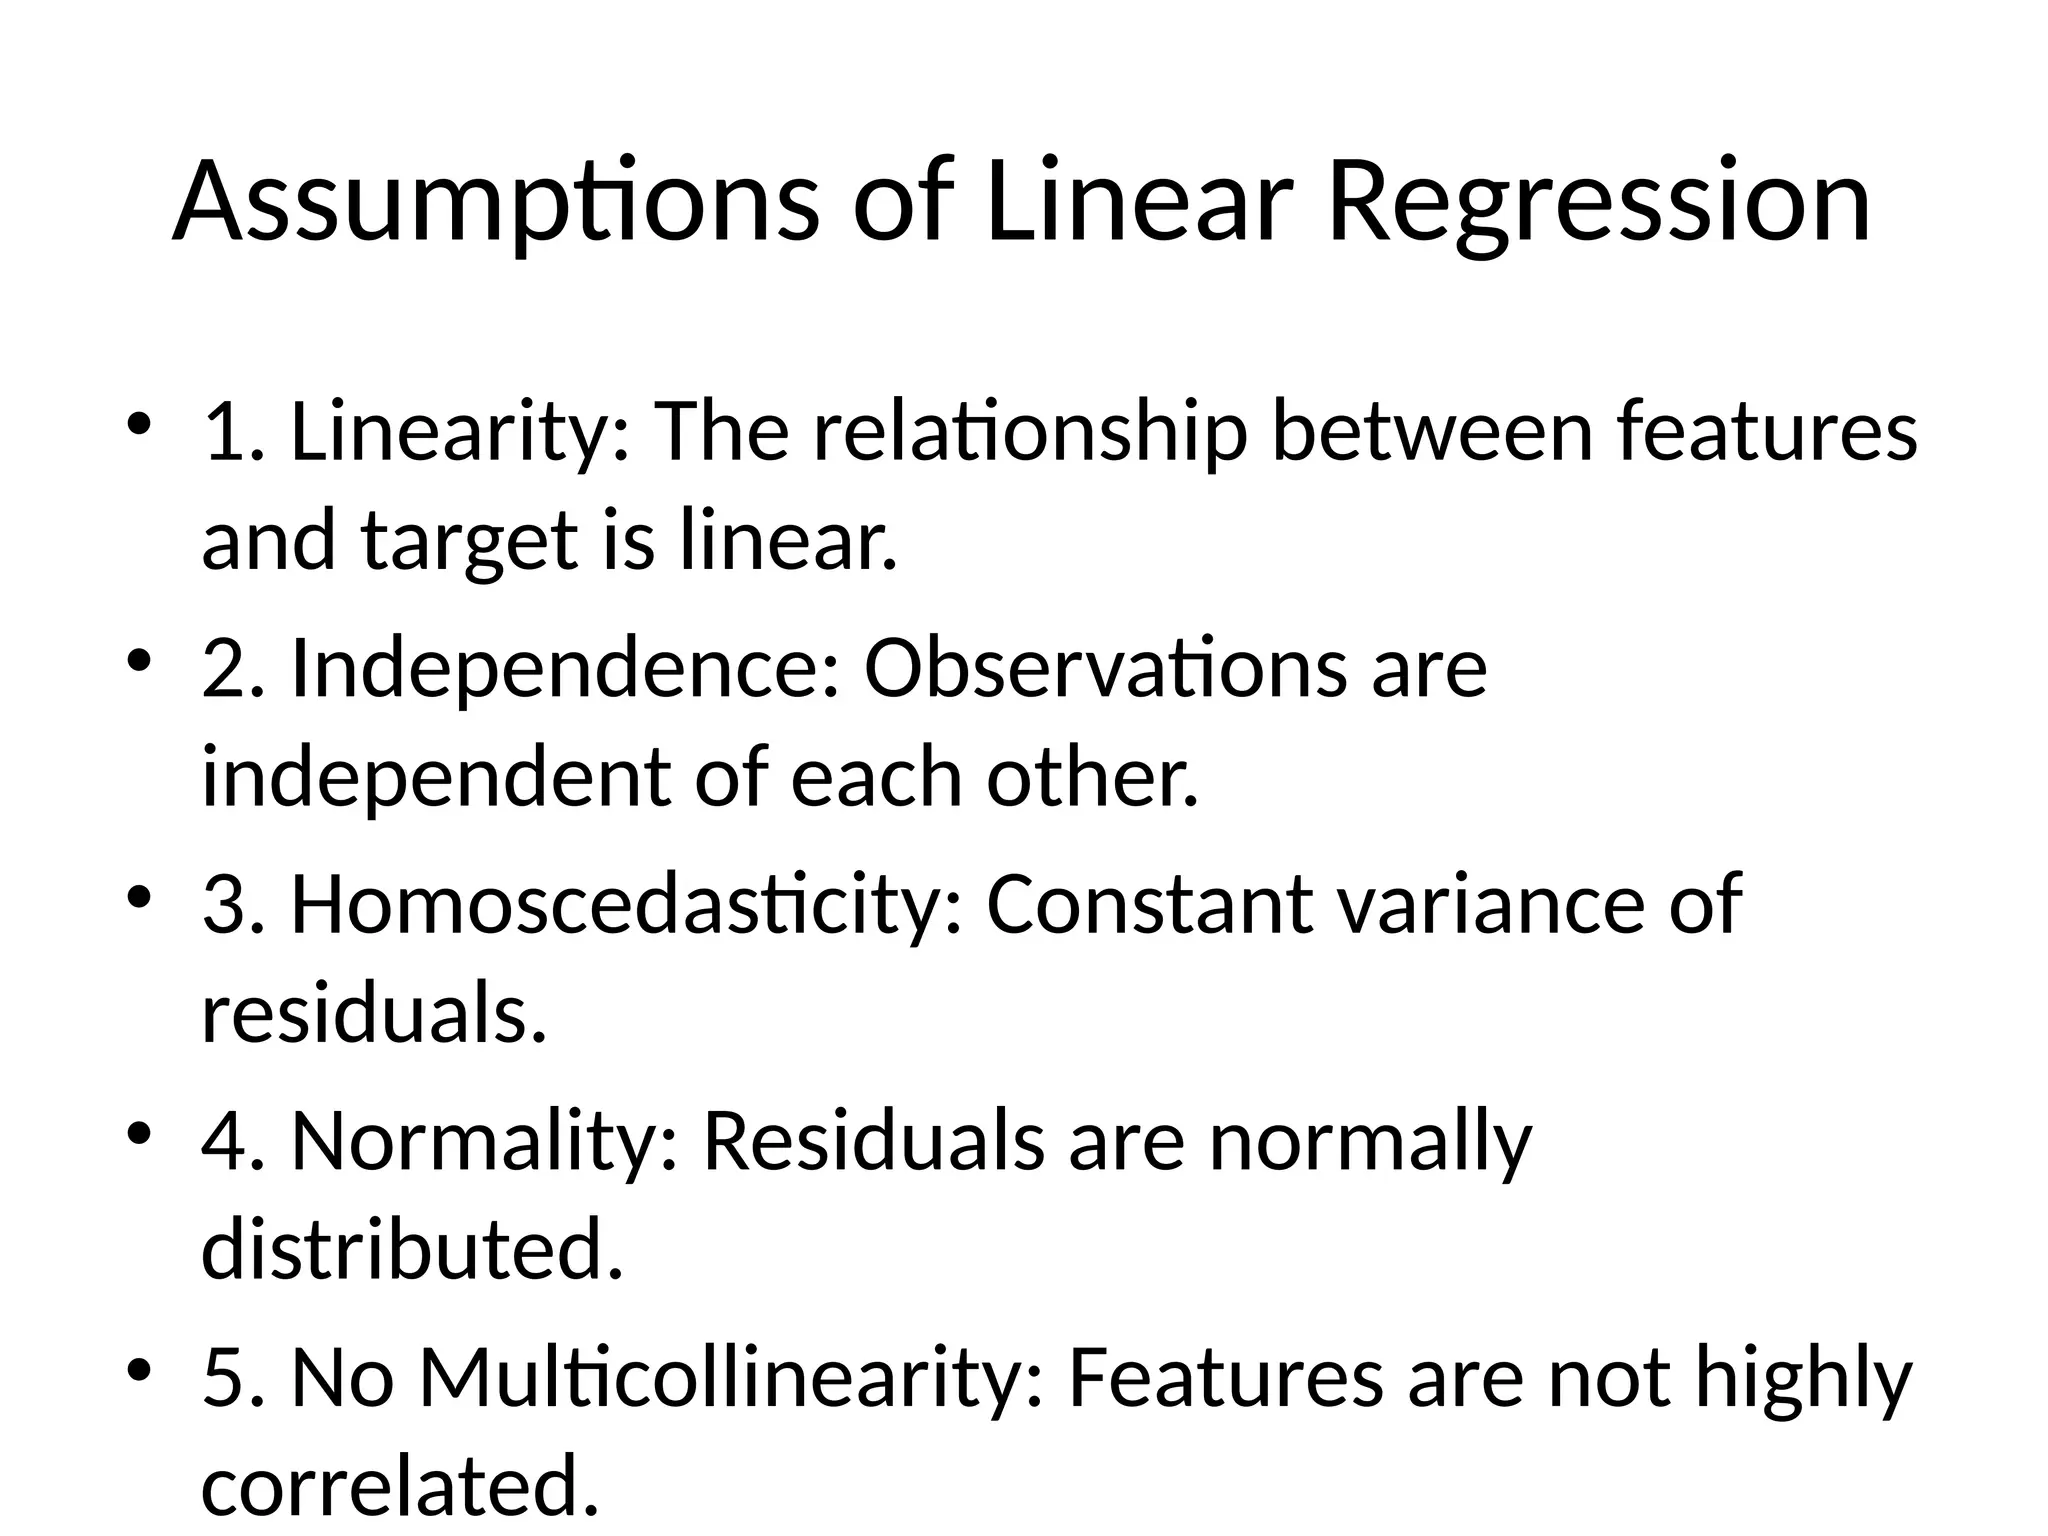
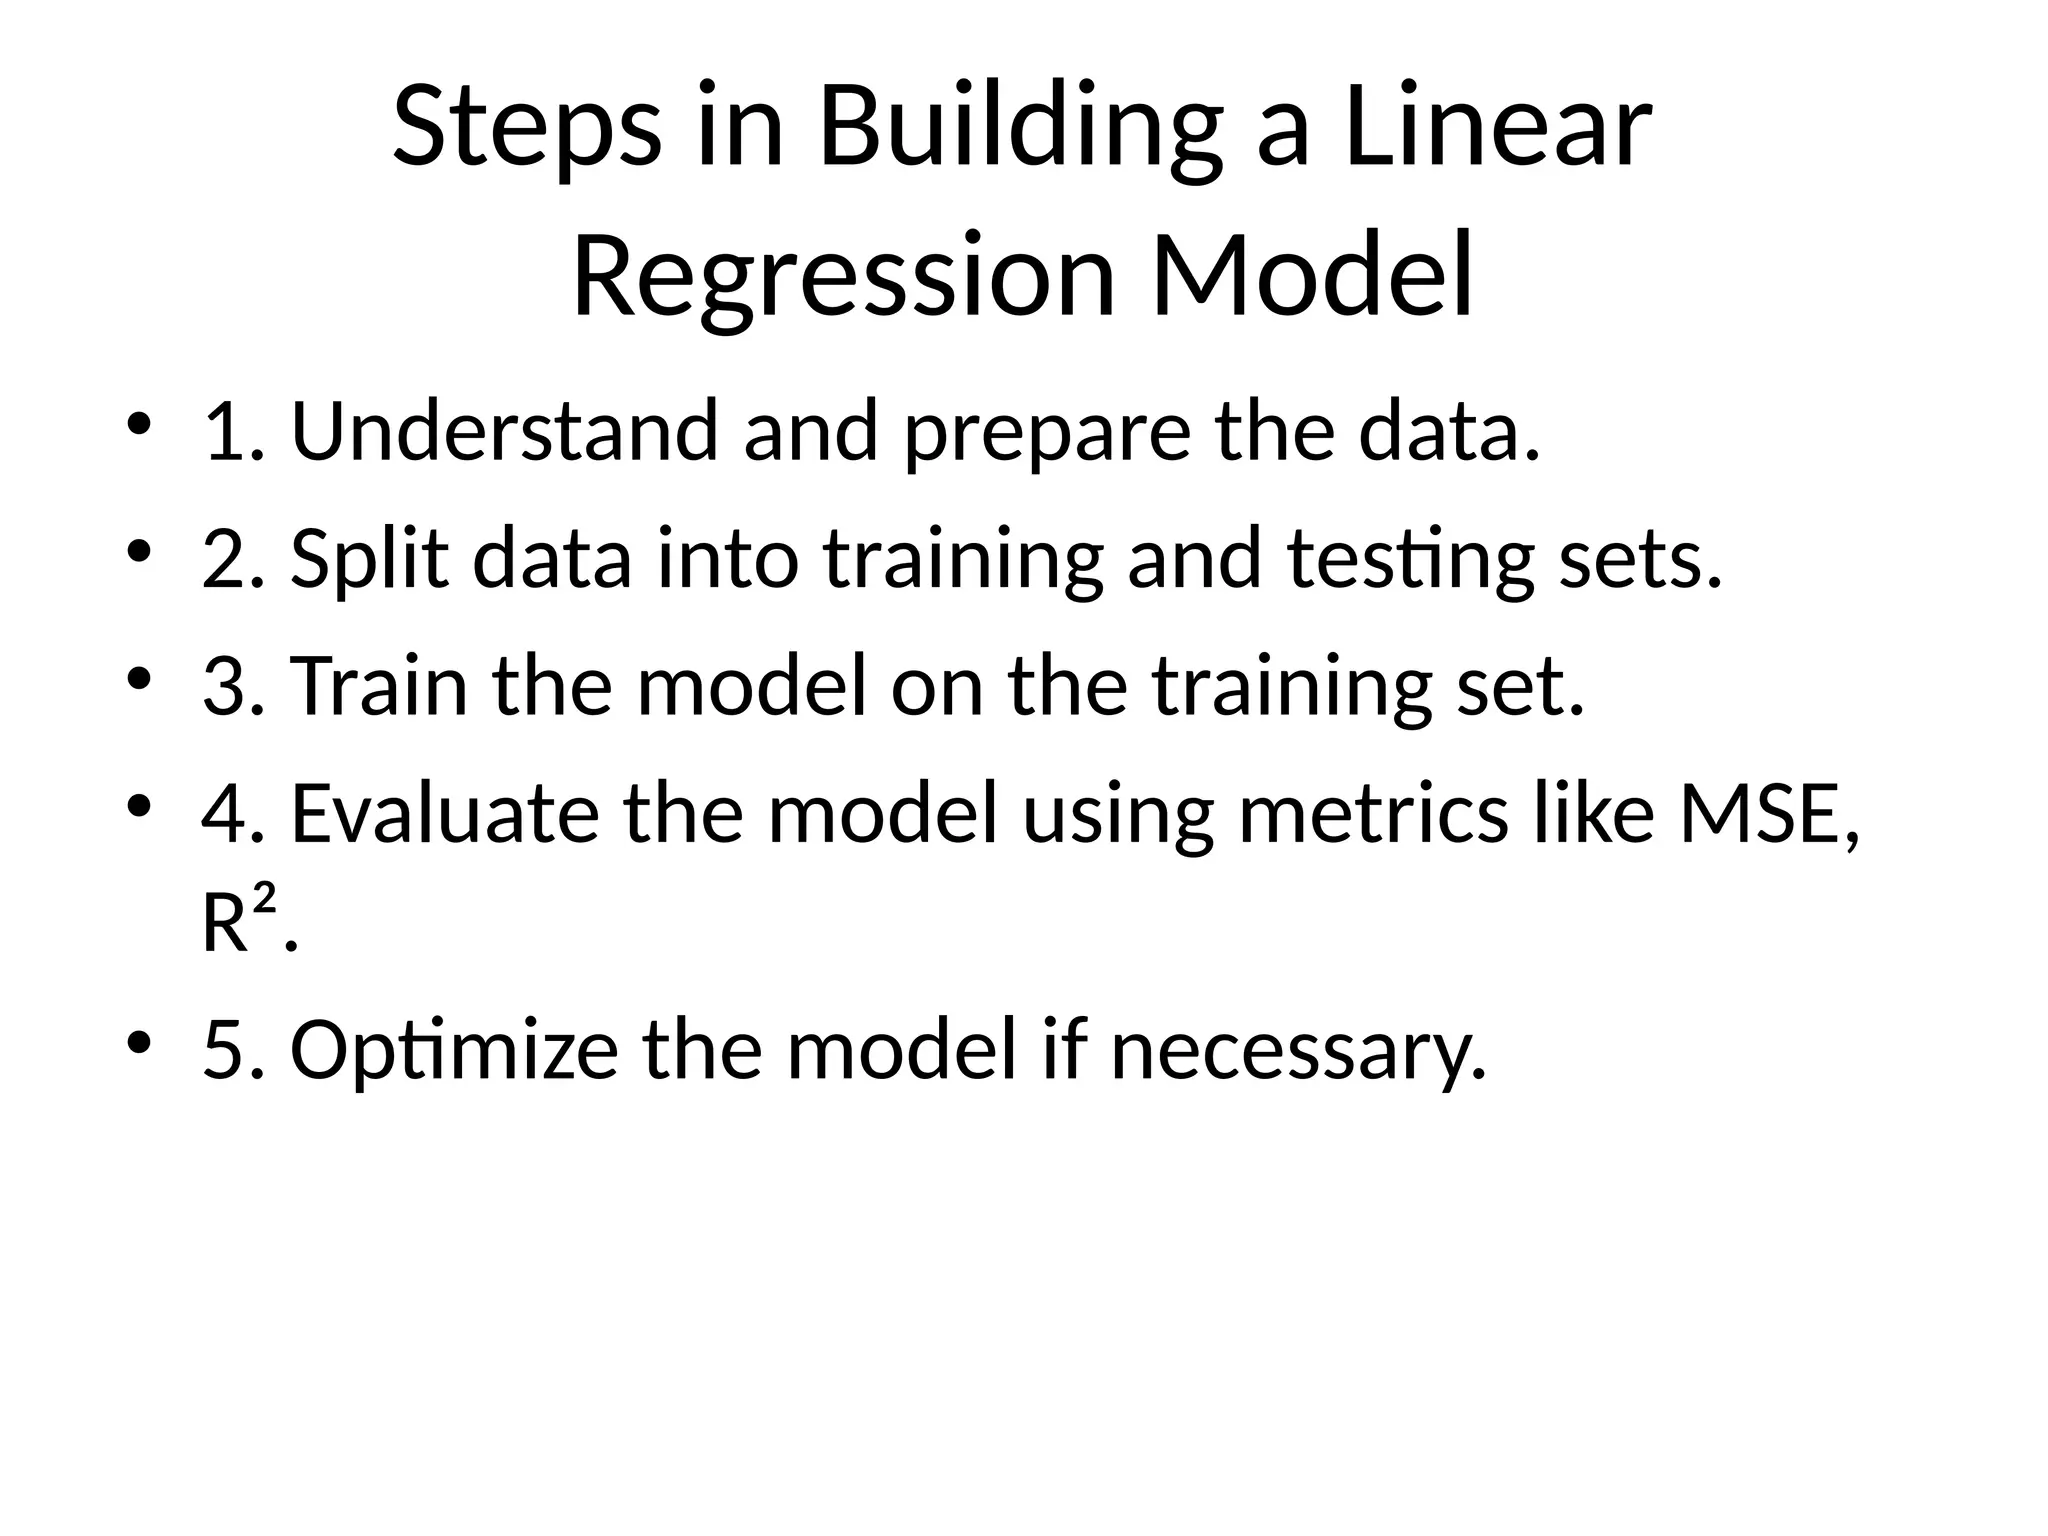
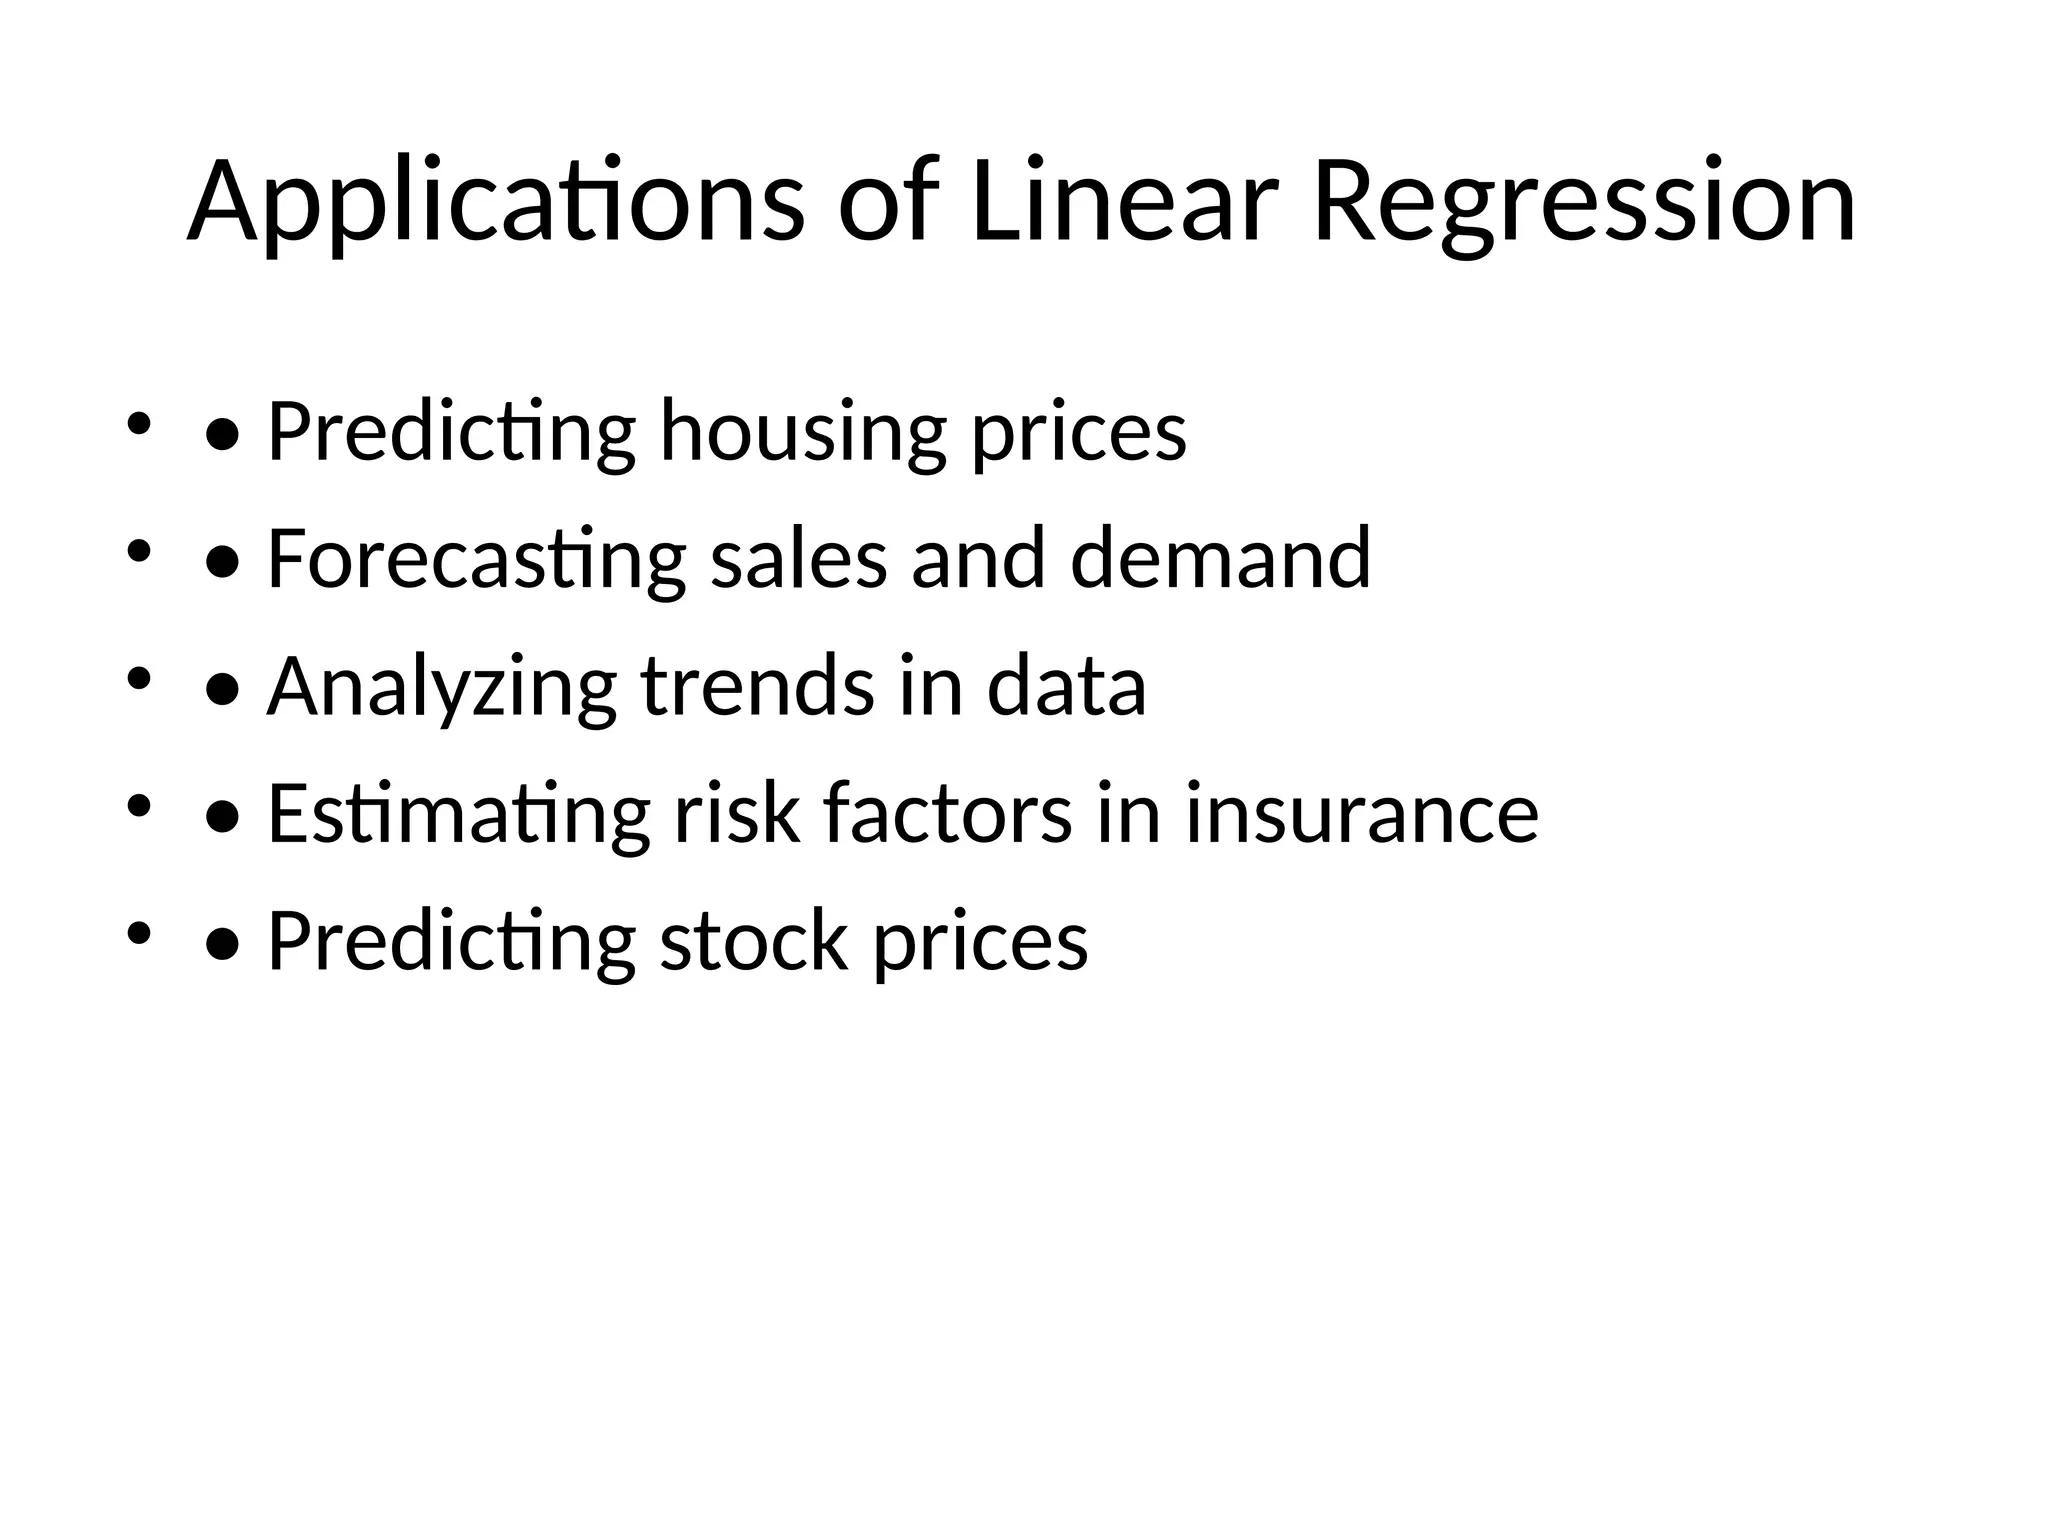
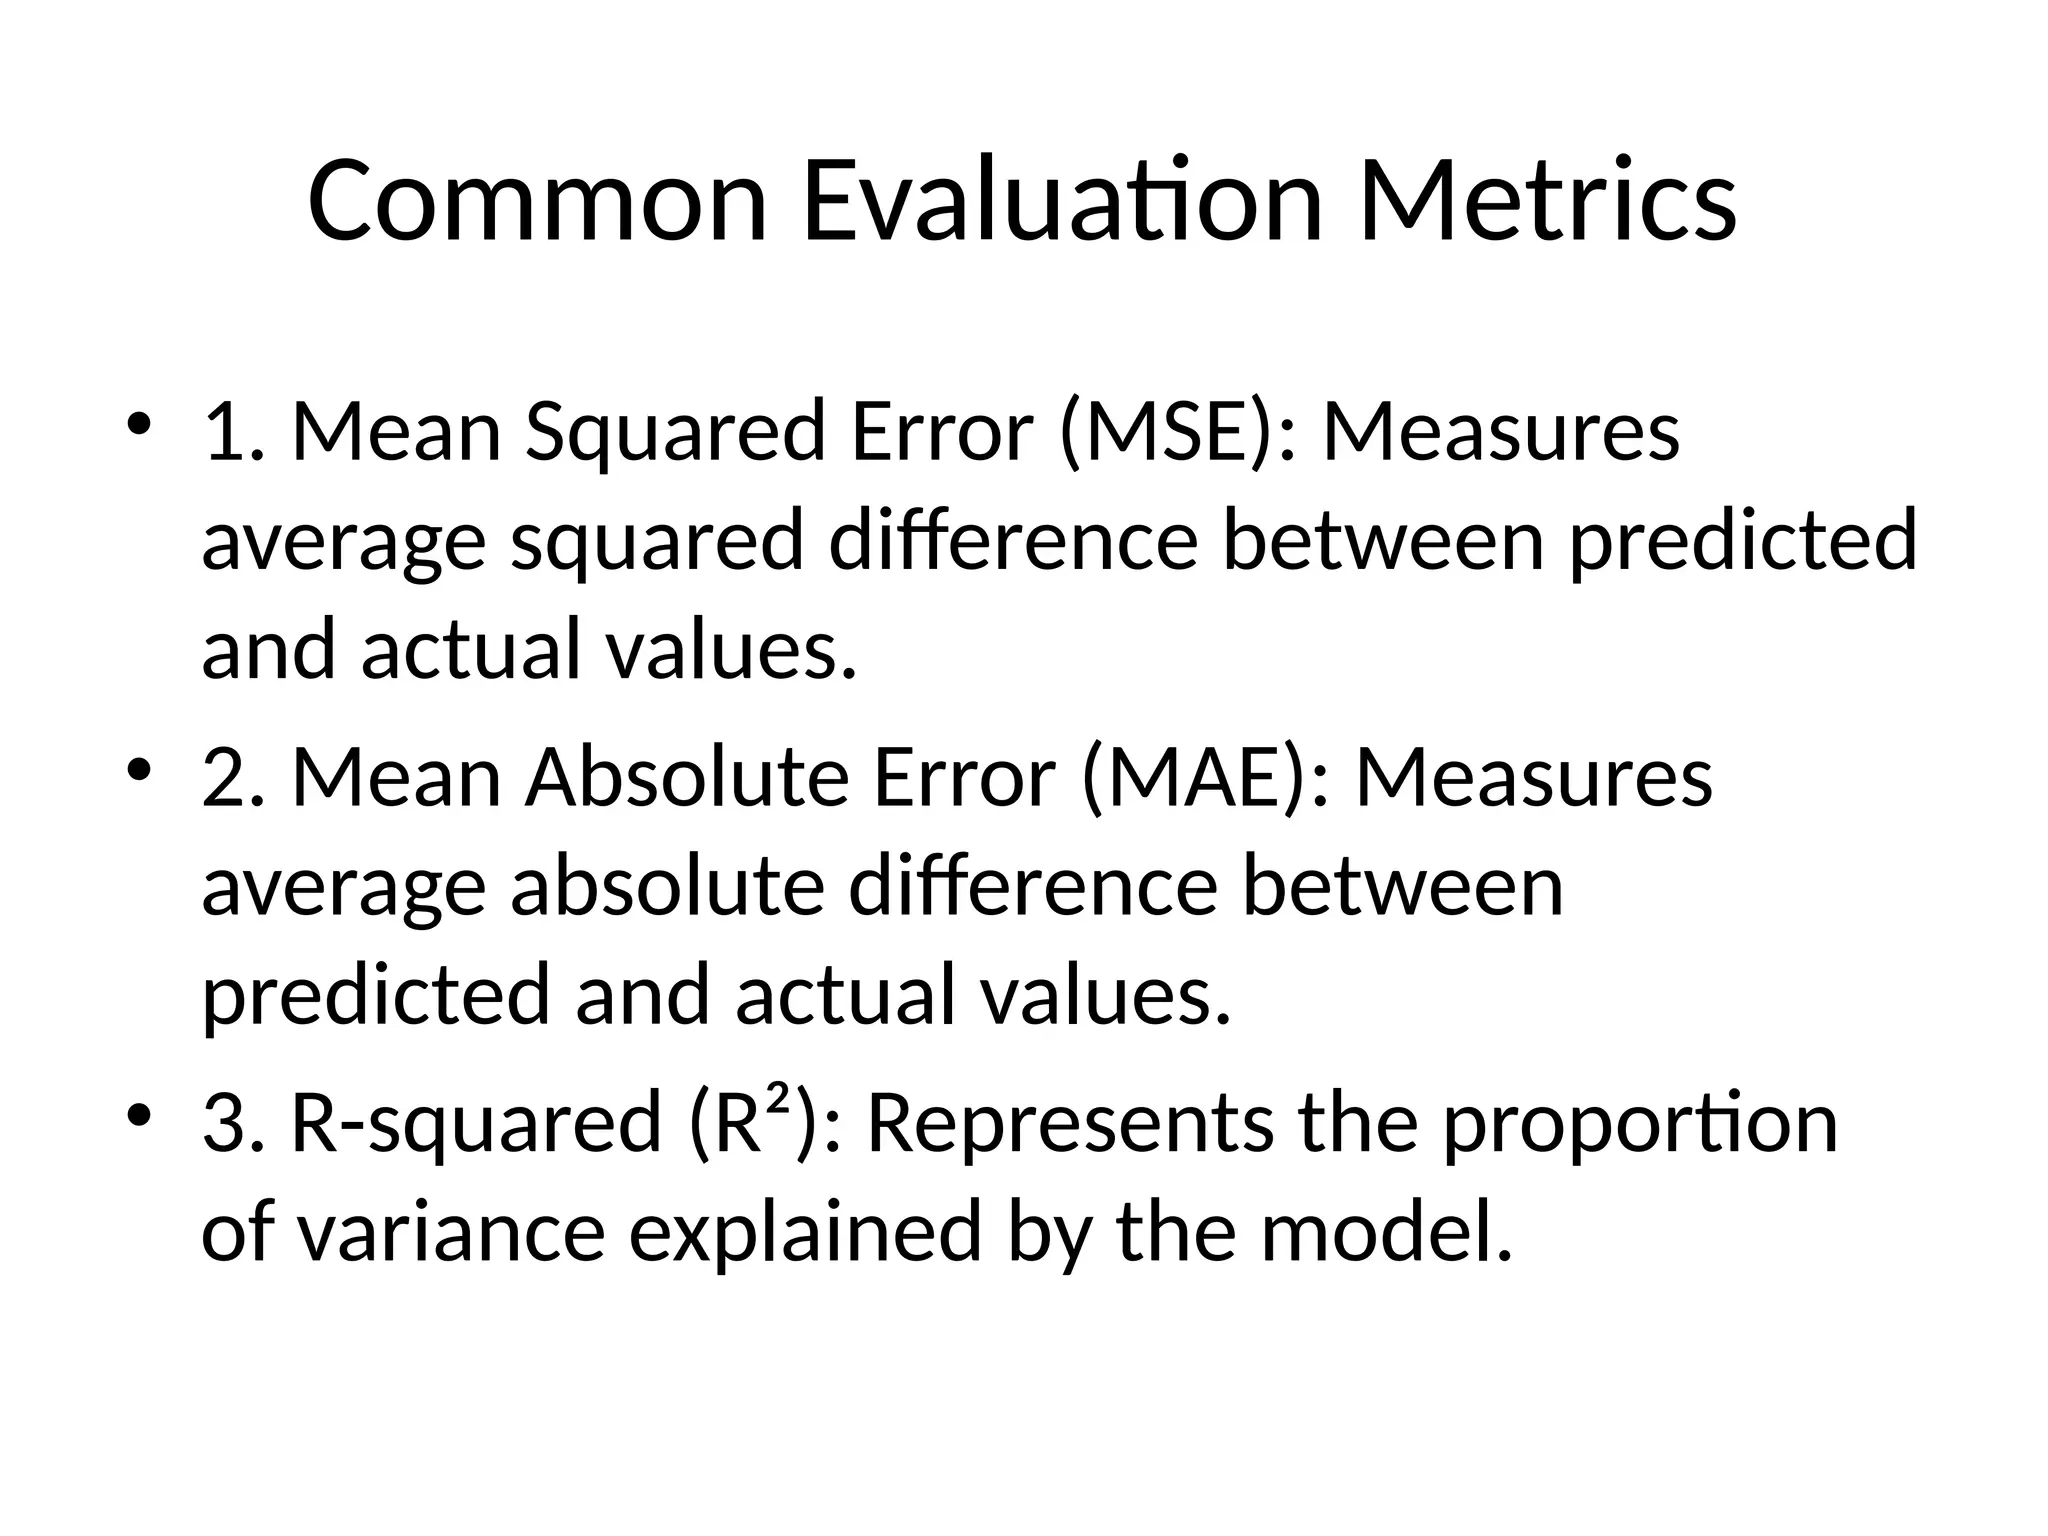
Linear regression is a statistical method for predicting a dependent variable based on independent variables by fitting a straight line to the data. It can be simple (one independent variable) or multiple (multiple independent variables) and is guided by assumptions such as linearity and independence. Common applications include price prediction, sales forecasting, and trend analysis, with evaluation metrics like mean squared error and R-squared to assess model performance.