Linear Regression
What is Regression?
Regression is a supervised learning
technique which helps in finding the
correlation between variables and
enables us to predict the continuous
output variable based on the one or more
predictor variables.
It is mainly used for prediction,
forecasting, time series modeling, and
Types of Regression
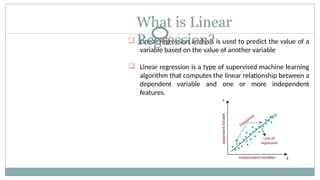
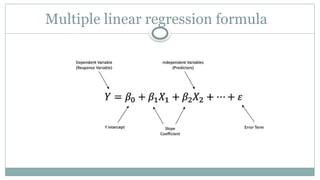
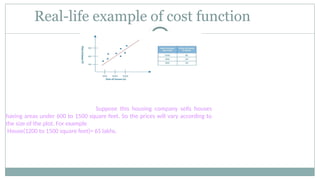
❏ Linear regression analysis is used to predict the value of a
variable based on the value of another variable
❏ Linear regression is a type of supervised machine learning
algorithm that computes the linear relationship between a
dependent variable and one or more independent
features.
What is Linear
Regression?
Types of linear regression
❏ Simple linear regression : The goal of a simple linear regression is to
predict the value of a dependent variable based on an independent
variable. Simple linear regression is used to model the relationship
between two continuous variables. Often, the objective is to predict
the value of an output variable (or response) based on the value of
an input (or predictor) variable.
❏ Multiple linear regression: Multiple linear regression is used to
estimate the relationship between two or more independent
variables and one dependent variable.
Types of linear regression
Y= mX+b
 Y represents the dependent variable
 X represents the independent variable
 m is the slope of the line( how much Y changes
for a unit change in X)
 b is the intercept ( the value of Y when X is 0)
Equation of Simple linear regression
Example : Predicting Pizza Prices
Diameter (X) in
Inches
Price(Y) in
Dollars
8 10
10 13
12 16
What will be the 20-inch pizza price?
Example : Predicting Pizza Prices
m= sum of product of deviations / sum of square of deviation for x
= 12/8
= 1.5
b= Mean of Y - (m* Mean of X)
= 13 - (1.5*10)
= -2
Y= mX+b
= 1.5X- 2
= 1.5*20-2
= 28 Dollar
Multiple linear regression formula
Example of Multiple Linear Regression
Here, the Matrices for Y and X are
given as follows
Example of Multiple Linear Regression
The Coefficient of the Multiple Regression Equation is given as
Example of Multiple Linear Regression
Cost Function in Linear Regression
For the Linear regression model, the cost function will be the minimum
of the Root Mean Squared Error of the model, obtained by subtracting
the predicted values from actual values. It is a numeric value that
indicates the success or failure of a particular model without needing to
understand the inner workings of a model.
Why is the cost function needed?
Basically, our machine learning model predicts the new value. We aim to have
the predicted value as close as possible to the predicted value. If the model
predicts the value close to the actual value, then we will say it’s a good model.
So here is where cost function plays an important role. This cost function is
needed to calculate the difference between actual and predicted values. So
here it is nothing, just the difference between the actual values-predicted
values.
Types of Cost Function in Linear
Regression
Mean error: These errors can be negative or positive. Therefore, they can cancel each
other out during the summation, and the average error of the model will be zero.
Mean Squared Error : MSE represents the average squared difference between the
predictions and expected results.
I = index of sample
Ŷ = predicted value
Y = expected value
M = number of samples in the data
set
Types of Cost Function in Linear
Regression
Mean Absolute Error: MSE is a variation of MAE that squares the
difference instead of taking the absolute value of the difference.
There is no possibility of negative errors.
I = index of sample
Ŷ = predicted value
Y = expected value
M = number of
samples in the data
set
Types of Cost Function in Linear Regression
Root mean squared error (RMSE): The Root Mean Squared Error (RMSE) is
one of the two main performance indicators for a regression model. It
measures the average difference between values predicted by a model
and the actual values.
Exploring the Cost Function
We have a training set with three points (1, 1), (2, 2), and (3, 3). We plot the function
f(x) = w * x for different values of w and calculate the corresponding cost function
J(w). When w = 1: f(x) = x, the line passes through the origin, perfectly fitting the
data. The cost function J(w) is 0 since f(x) equals y for all training examples. Setting w
= 0.5: f(x) = 0.5 * x, the line has a smaller slope. The cost function J(w) now measures
the squared errors between f(x) and y for each example. It provides a measure of
how well the line fits the data.
Function f(x) vs. Cost Function J(w)
Real-life example of cost function
Here, y denotes the target variable(Price of House), X denotes the size of the
House and a0 is the intercept. The linear regression model will fit a straight line to
our data, as shown in fig, and it will tell us what is the price of the House when
we know the size of the House. Suppose this housing company sells houses
having areas under 600 to 1500 square feet. So the prices will vary according to
the size of the plot. For example
House(1200 to 1500 square feet)= 65 lakhs.
Now suddenly, there’s a rise in demand of Houses which means the price of this
House will increase now. Suppose the price has now increased to 75 lakhs. But
what if the model predicted its price as 30 lakhs? So this difference between
these actual and predicted values is calculated by the cost function.
Applications of Linear
Regression
❏ Market analysis
❏ Financial analysis
❏ Sports analysis
❏ Environmental health
❏ Medicine
Advantages of Linear Regression
❏ Linear Regression is simple to implement and easier to interpret the output
coefficients
❏ When you know the relationship between the independent and dependent
variable have a linear relationship, this algorithm is the best to use because of it’s
less complexity compared to other algorithms.
❏ Linear Regression is susceptible to over-fitting but it can be avoided using some
dimensionality reduction techniques, regularization (L1 and L2) techniques and
cross-validation.
❏ Linear Assumption
❏ Sensitivity to Exceptions
❏ Independence Presumption
❏ Limited to Linear Relationships
Drawbacks of Linear Regression
Conclusion
Linear regression is a foundational and widely used
technique in machine learning, offering a straightforward yet
effective way to model relationships between variables. It is
a valuable tool for making predictions and understanding
data patterns, though its suitability depends on the specific
problem and the linearity assumption. While it may not
always be the best choice, it remains an essential
component of the machine learning toolkit, providing
valuable insights in various domains.
References
❖ https://www.geeksforgeeks.org/ml-advantages-and-disadvantages-of-linear-regressio
n/
❖ https://iq.opengenus.org/advantages-and-disadvantages-of-linear-regression/
❖ https://www.intellspot.com/linear-regression-examples/
❖ https://www.tutorialspoint.com/advantages-and-disadvantages-of-linear-regression#:
~:text=The%20strategy%20is%20simple%20to,the%20subordinate%20and%20free%2
0factors
.
❖ https://sphweb.bumc.bu.edu/otlt/MPH-Modules/BS/BS704-EP713_MultivariableMetho
ds/
❖ https://www.javatpoint.com/simple-linear-regression-in-machine-learning
❖ https://youtu.be/zUQr6HAAKp4?si=V-ojf6pXnMO2p7DR
❖ https://youtu.be/lzGKRSvs5HM?si=RduTOfWWjb05n5tF
❖ https://www.shiksha.com/online-courses/articles/cost-function-in-machine-learning/#
Why-is-the-cost-function-needed?
❖ https://medium.com/@yennhi95zz/3-understanding-the-cost-function-in-linear-regression-for-mac
hine-learning-beginners-ec9edeecbdde
❖ https://datatab.net/tutorial/linear-regression
Thank You

Introduction to Linear Regression- Simple and First Algorithm in ML

  • 1.
  • 2.
    What is Regression? Regressionis a supervised learning technique which helps in finding the correlation between variables and enables us to predict the continuous output variable based on the one or more predictor variables. It is mainly used for prediction, forecasting, time series modeling, and
  • 3.
  • 4.
    ❏ Linear regressionanalysis is used to predict the value of a variable based on the value of another variable ❏ Linear regression is a type of supervised machine learning algorithm that computes the linear relationship between a dependent variable and one or more independent features. What is Linear Regression?
  • 5.
    Types of linearregression ❏ Simple linear regression : The goal of a simple linear regression is to predict the value of a dependent variable based on an independent variable. Simple linear regression is used to model the relationship between two continuous variables. Often, the objective is to predict the value of an output variable (or response) based on the value of an input (or predictor) variable. ❏ Multiple linear regression: Multiple linear regression is used to estimate the relationship between two or more independent variables and one dependent variable.
  • 6.
    Types of linearregression
  • 7.
    Y= mX+b  Yrepresents the dependent variable  X represents the independent variable  m is the slope of the line( how much Y changes for a unit change in X)  b is the intercept ( the value of Y when X is 0) Equation of Simple linear regression
  • 8.
    Example : PredictingPizza Prices Diameter (X) in Inches Price(Y) in Dollars 8 10 10 13 12 16 What will be the 20-inch pizza price?
  • 9.
    Example : PredictingPizza Prices m= sum of product of deviations / sum of square of deviation for x = 12/8 = 1.5 b= Mean of Y - (m* Mean of X) = 13 - (1.5*10) = -2 Y= mX+b = 1.5X- 2 = 1.5*20-2 = 28 Dollar
  • 10.
  • 11.
    Example of MultipleLinear Regression Here, the Matrices for Y and X are given as follows
  • 12.
    Example of MultipleLinear Regression The Coefficient of the Multiple Regression Equation is given as
  • 13.
    Example of MultipleLinear Regression
  • 14.
    Example of MultipleLinear Regression
  • 15.
    Cost Function inLinear Regression For the Linear regression model, the cost function will be the minimum of the Root Mean Squared Error of the model, obtained by subtracting the predicted values from actual values. It is a numeric value that indicates the success or failure of a particular model without needing to understand the inner workings of a model.
  • 16.
    Why is thecost function needed? Basically, our machine learning model predicts the new value. We aim to have the predicted value as close as possible to the predicted value. If the model predicts the value close to the actual value, then we will say it’s a good model. So here is where cost function plays an important role. This cost function is needed to calculate the difference between actual and predicted values. So here it is nothing, just the difference between the actual values-predicted values.
  • 17.
    Types of CostFunction in Linear Regression Mean error: These errors can be negative or positive. Therefore, they can cancel each other out during the summation, and the average error of the model will be zero. Mean Squared Error : MSE represents the average squared difference between the predictions and expected results. I = index of sample Ŷ = predicted value Y = expected value M = number of samples in the data set
  • 18.
    Types of CostFunction in Linear Regression Mean Absolute Error: MSE is a variation of MAE that squares the difference instead of taking the absolute value of the difference. There is no possibility of negative errors. I = index of sample Ŷ = predicted value Y = expected value M = number of samples in the data set
  • 19.
    Types of CostFunction in Linear Regression Root mean squared error (RMSE): The Root Mean Squared Error (RMSE) is one of the two main performance indicators for a regression model. It measures the average difference between values predicted by a model and the actual values.
  • 20.
    Exploring the CostFunction We have a training set with three points (1, 1), (2, 2), and (3, 3). We plot the function f(x) = w * x for different values of w and calculate the corresponding cost function J(w). When w = 1: f(x) = x, the line passes through the origin, perfectly fitting the data. The cost function J(w) is 0 since f(x) equals y for all training examples. Setting w = 0.5: f(x) = 0.5 * x, the line has a smaller slope. The cost function J(w) now measures the squared errors between f(x) and y for each example. It provides a measure of how well the line fits the data. Function f(x) vs. Cost Function J(w)
  • 21.
    Real-life example ofcost function Here, y denotes the target variable(Price of House), X denotes the size of the House and a0 is the intercept. The linear regression model will fit a straight line to our data, as shown in fig, and it will tell us what is the price of the House when we know the size of the House. Suppose this housing company sells houses having areas under 600 to 1500 square feet. So the prices will vary according to the size of the plot. For example House(1200 to 1500 square feet)= 65 lakhs. Now suddenly, there’s a rise in demand of Houses which means the price of this House will increase now. Suppose the price has now increased to 75 lakhs. But what if the model predicted its price as 30 lakhs? So this difference between these actual and predicted values is calculated by the cost function.
  • 22.
    Applications of Linear Regression ❏Market analysis ❏ Financial analysis ❏ Sports analysis ❏ Environmental health ❏ Medicine
  • 23.
    Advantages of LinearRegression ❏ Linear Regression is simple to implement and easier to interpret the output coefficients ❏ When you know the relationship between the independent and dependent variable have a linear relationship, this algorithm is the best to use because of it’s less complexity compared to other algorithms. ❏ Linear Regression is susceptible to over-fitting but it can be avoided using some dimensionality reduction techniques, regularization (L1 and L2) techniques and cross-validation.
  • 24.
    ❏ Linear Assumption ❏Sensitivity to Exceptions ❏ Independence Presumption ❏ Limited to Linear Relationships Drawbacks of Linear Regression
  • 25.
    Conclusion Linear regression isa foundational and widely used technique in machine learning, offering a straightforward yet effective way to model relationships between variables. It is a valuable tool for making predictions and understanding data patterns, though its suitability depends on the specific problem and the linearity assumption. While it may not always be the best choice, it remains an essential component of the machine learning toolkit, providing valuable insights in various domains.
  • 26.
    References ❖ https://www.geeksforgeeks.org/ml-advantages-and-disadvantages-of-linear-regressio n/ ❖ https://iq.opengenus.org/advantages-and-disadvantages-of-linear-regression/ ❖https://www.intellspot.com/linear-regression-examples/ ❖ https://www.tutorialspoint.com/advantages-and-disadvantages-of-linear-regression#: ~:text=The%20strategy%20is%20simple%20to,the%20subordinate%20and%20free%2 0factors . ❖ https://sphweb.bumc.bu.edu/otlt/MPH-Modules/BS/BS704-EP713_MultivariableMetho ds/ ❖ https://www.javatpoint.com/simple-linear-regression-in-machine-learning ❖ https://youtu.be/zUQr6HAAKp4?si=V-ojf6pXnMO2p7DR ❖ https://youtu.be/lzGKRSvs5HM?si=RduTOfWWjb05n5tF ❖ https://www.shiksha.com/online-courses/articles/cost-function-in-machine-learning/# Why-is-the-cost-function-needed? ❖ https://medium.com/@yennhi95zz/3-understanding-the-cost-function-in-linear-regression-for-mac hine-learning-beginners-ec9edeecbdde ❖ https://datatab.net/tutorial/linear-regression
  • 27.