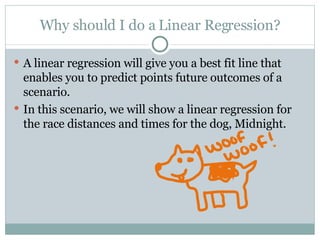
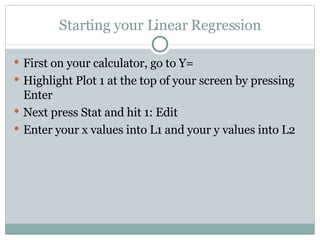
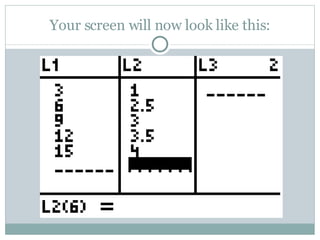
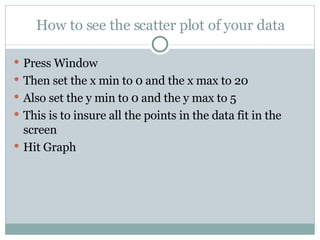
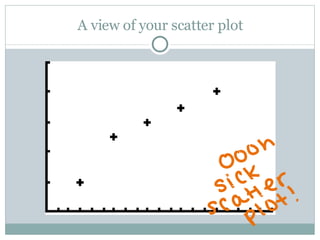
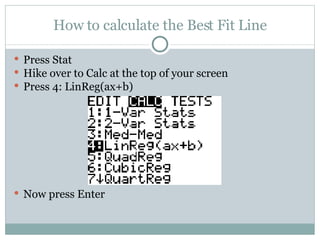
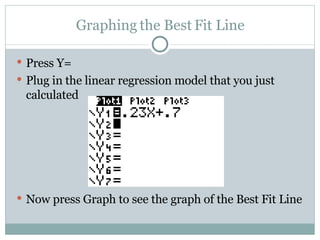
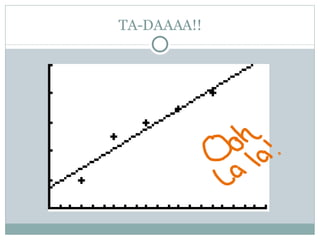
BY: KATE ALBERTINI AND KATIE FAIRMAN  How to do a Linear Reggression
Why should I do a Linear Regression? A linear regression will give you a best fit line that enables you to predict points future outcomes of a scenario. In this scenario, we will show a linear regression for the race distances and times for the dog, Midnight.
Starting your Linear Regression First on your calculator, go to Y= Highlight Plot 1 at the top of your screen by pressing Enter Next press Stat and hit 1: Edit Enter your x values into L1 and your y values into L2
Your screen will now look like this:
How to see the scatter plot of your data Press Window  Then set the x min to 0 and the x max to 20  Also set the y min to 0 and the y max to 5 This is to insure all the points in the data fit in the screen Hit Graph
A view of your scatter plot
How to calculate the Best Fit Line Press Stat Hike over to Calc at the top of your screen Press 4: LinReg(ax+b) Now press Enter
Your screen will now look like this:
Graphing the Best Fit Line Press Y= Plug in the linear regression model that you just calculated Now press Graph to see the graph of the Best Fit Line
TA-DAAAA!!
Congratulations! You’ve made your Linear Regression Now you are able to plug in different distances for x and predict how fast Midnight will be able to race the distance!

Linear Regression

  • 1.
    BY: KATE ALBERTINIAND KATIE FAIRMAN How to do a Linear Reggression
  • 2.
    Why should Ido a Linear Regression? A linear regression will give you a best fit line that enables you to predict points future outcomes of a scenario. In this scenario, we will show a linear regression for the race distances and times for the dog, Midnight.
  • 3.
    Starting your LinearRegression First on your calculator, go to Y= Highlight Plot 1 at the top of your screen by pressing Enter Next press Stat and hit 1: Edit Enter your x values into L1 and your y values into L2
  • 4.
    Your screen willnow look like this:
  • 5.
    How to seethe scatter plot of your data Press Window Then set the x min to 0 and the x max to 20 Also set the y min to 0 and the y max to 5 This is to insure all the points in the data fit in the screen Hit Graph
  • 6.
    A view ofyour scatter plot
  • 7.
    How to calculatethe Best Fit Line Press Stat Hike over to Calc at the top of your screen Press 4: LinReg(ax+b) Now press Enter
  • 8.
    Your screen willnow look like this:
  • 9.
    Graphing the BestFit Line Press Y= Plug in the linear regression model that you just calculated Now press Graph to see the graph of the Best Fit Line
  • 10.
  • 11.
    Congratulations! You’ve madeyour Linear Regression Now you are able to plug in different distances for x and predict how fast Midnight will be able to race the distance!