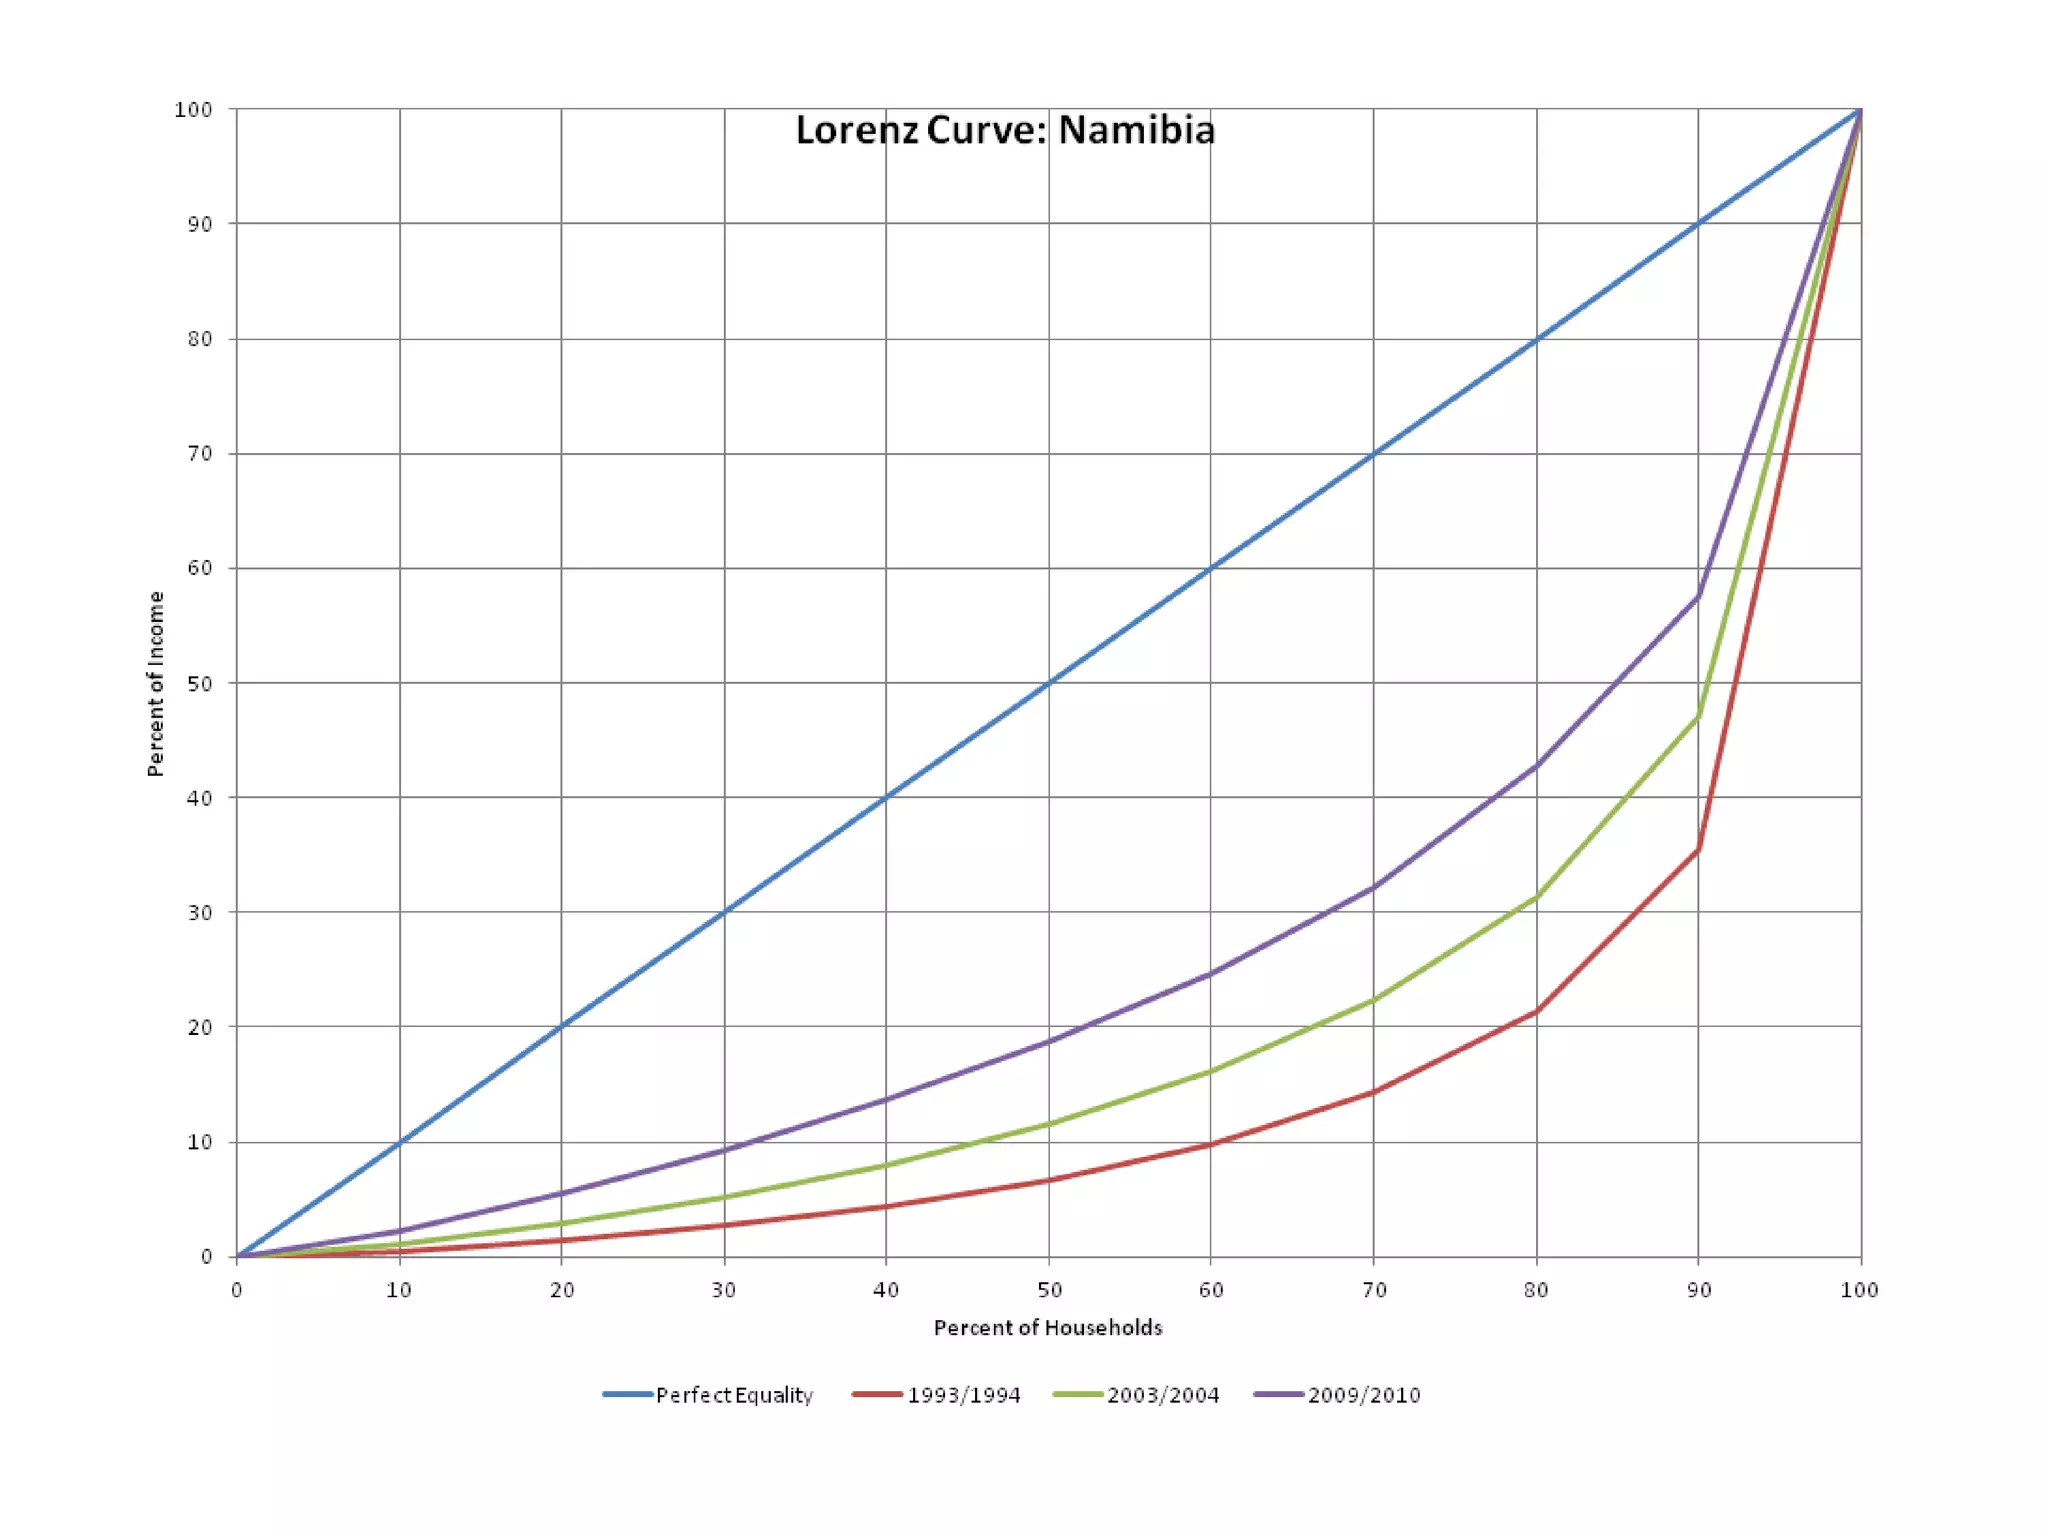
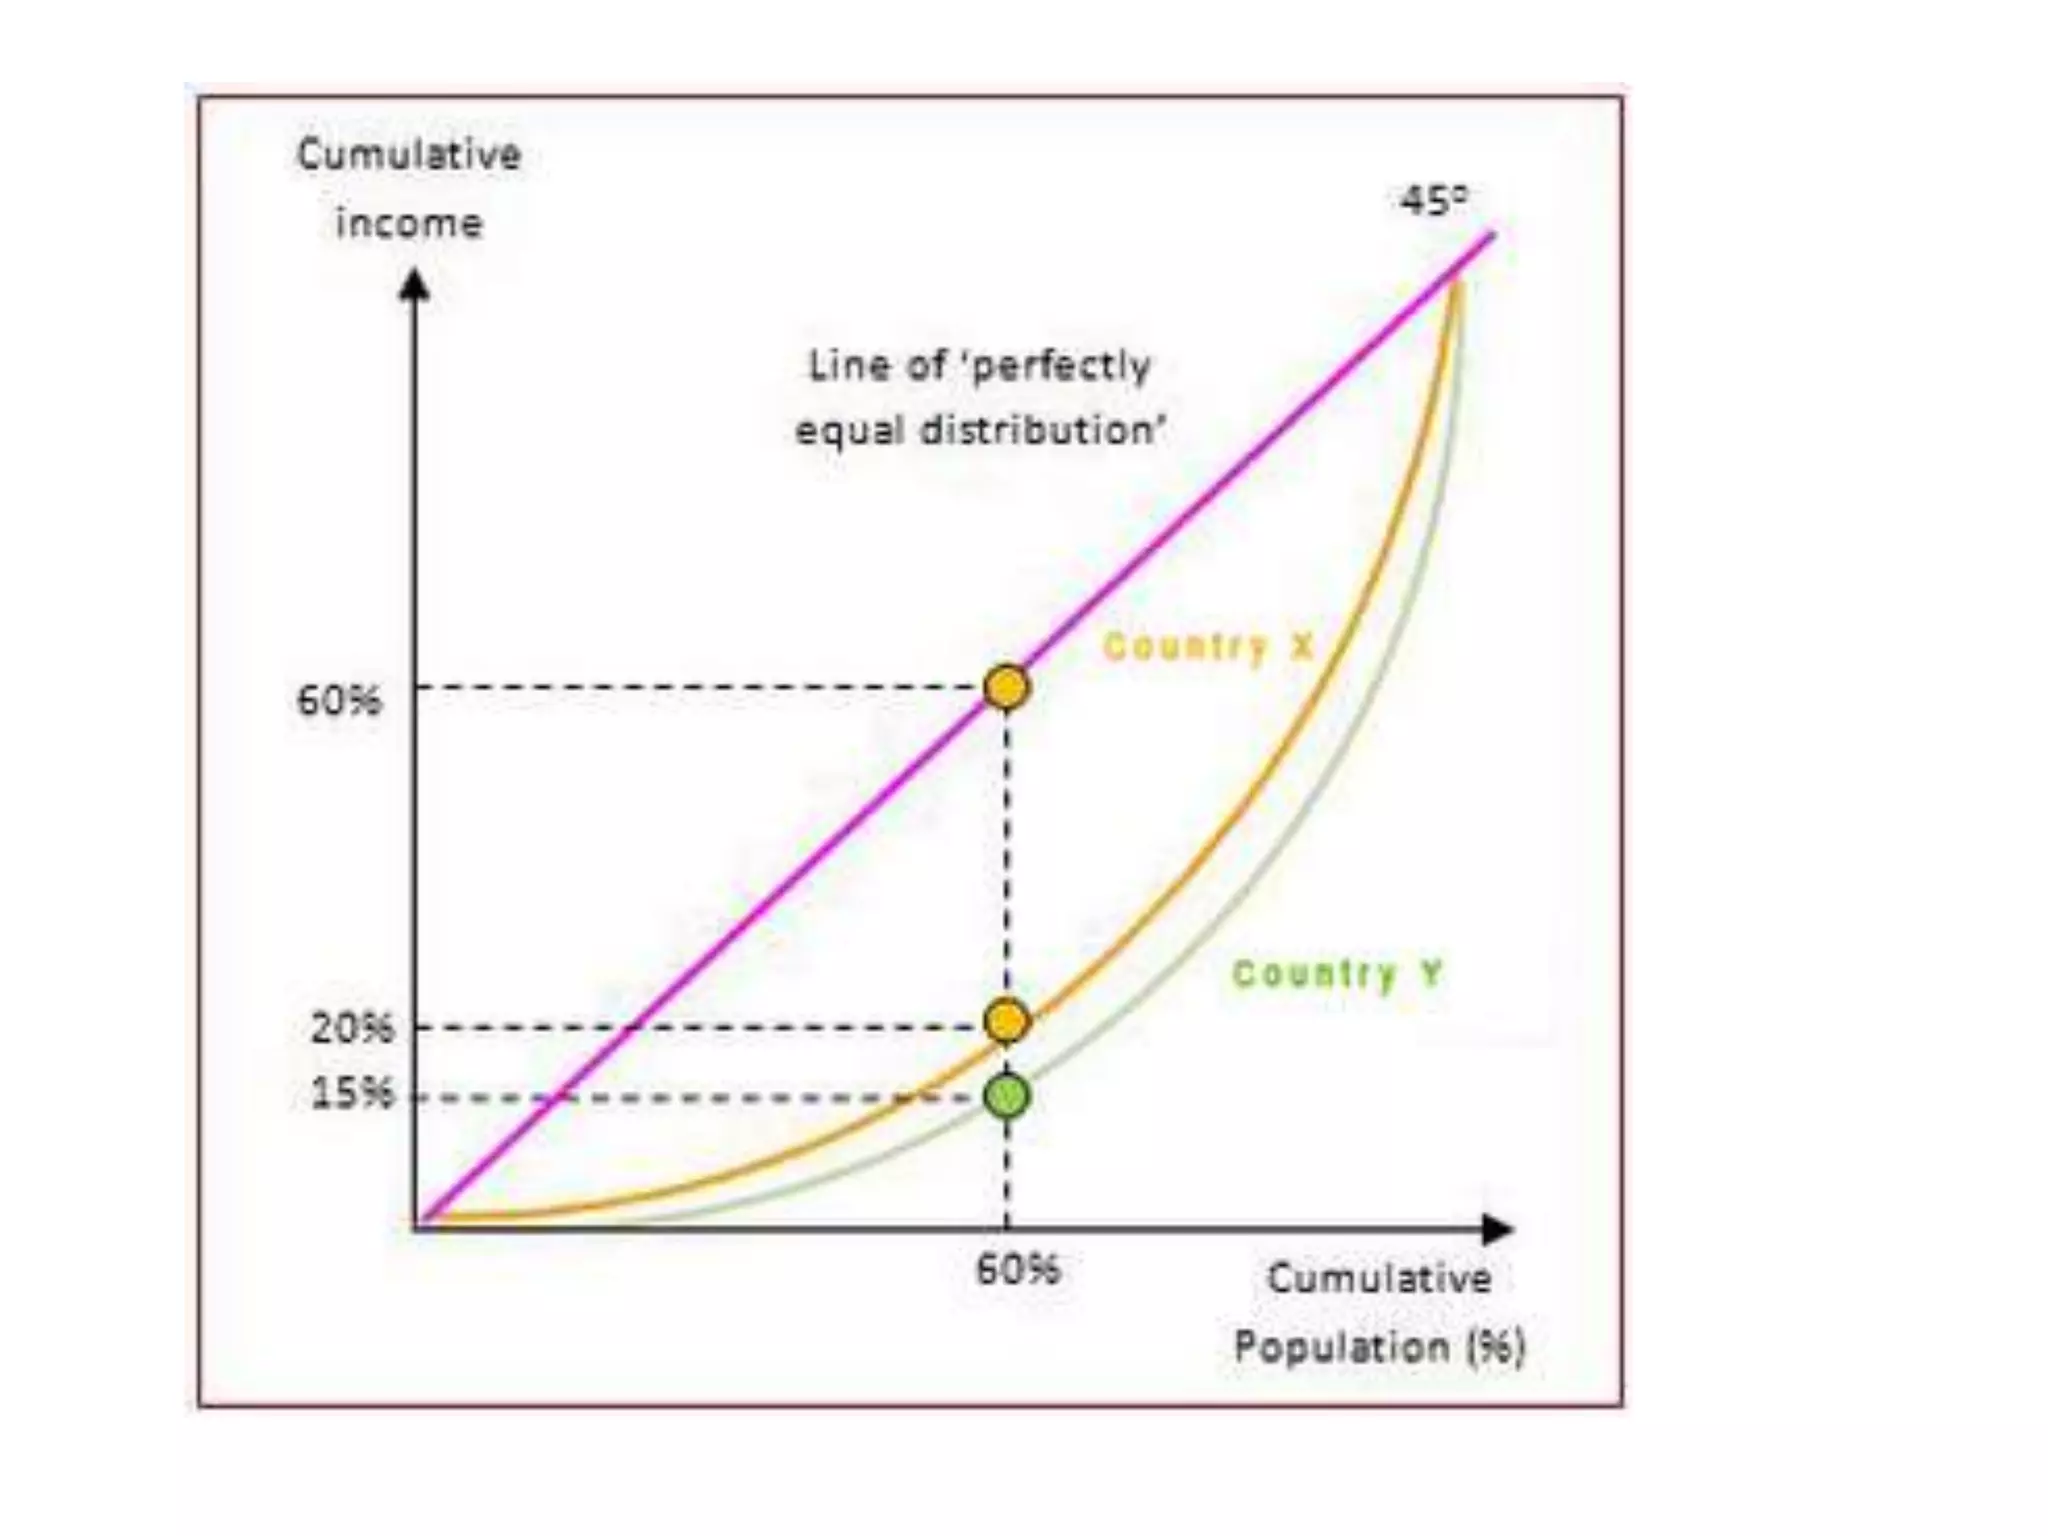
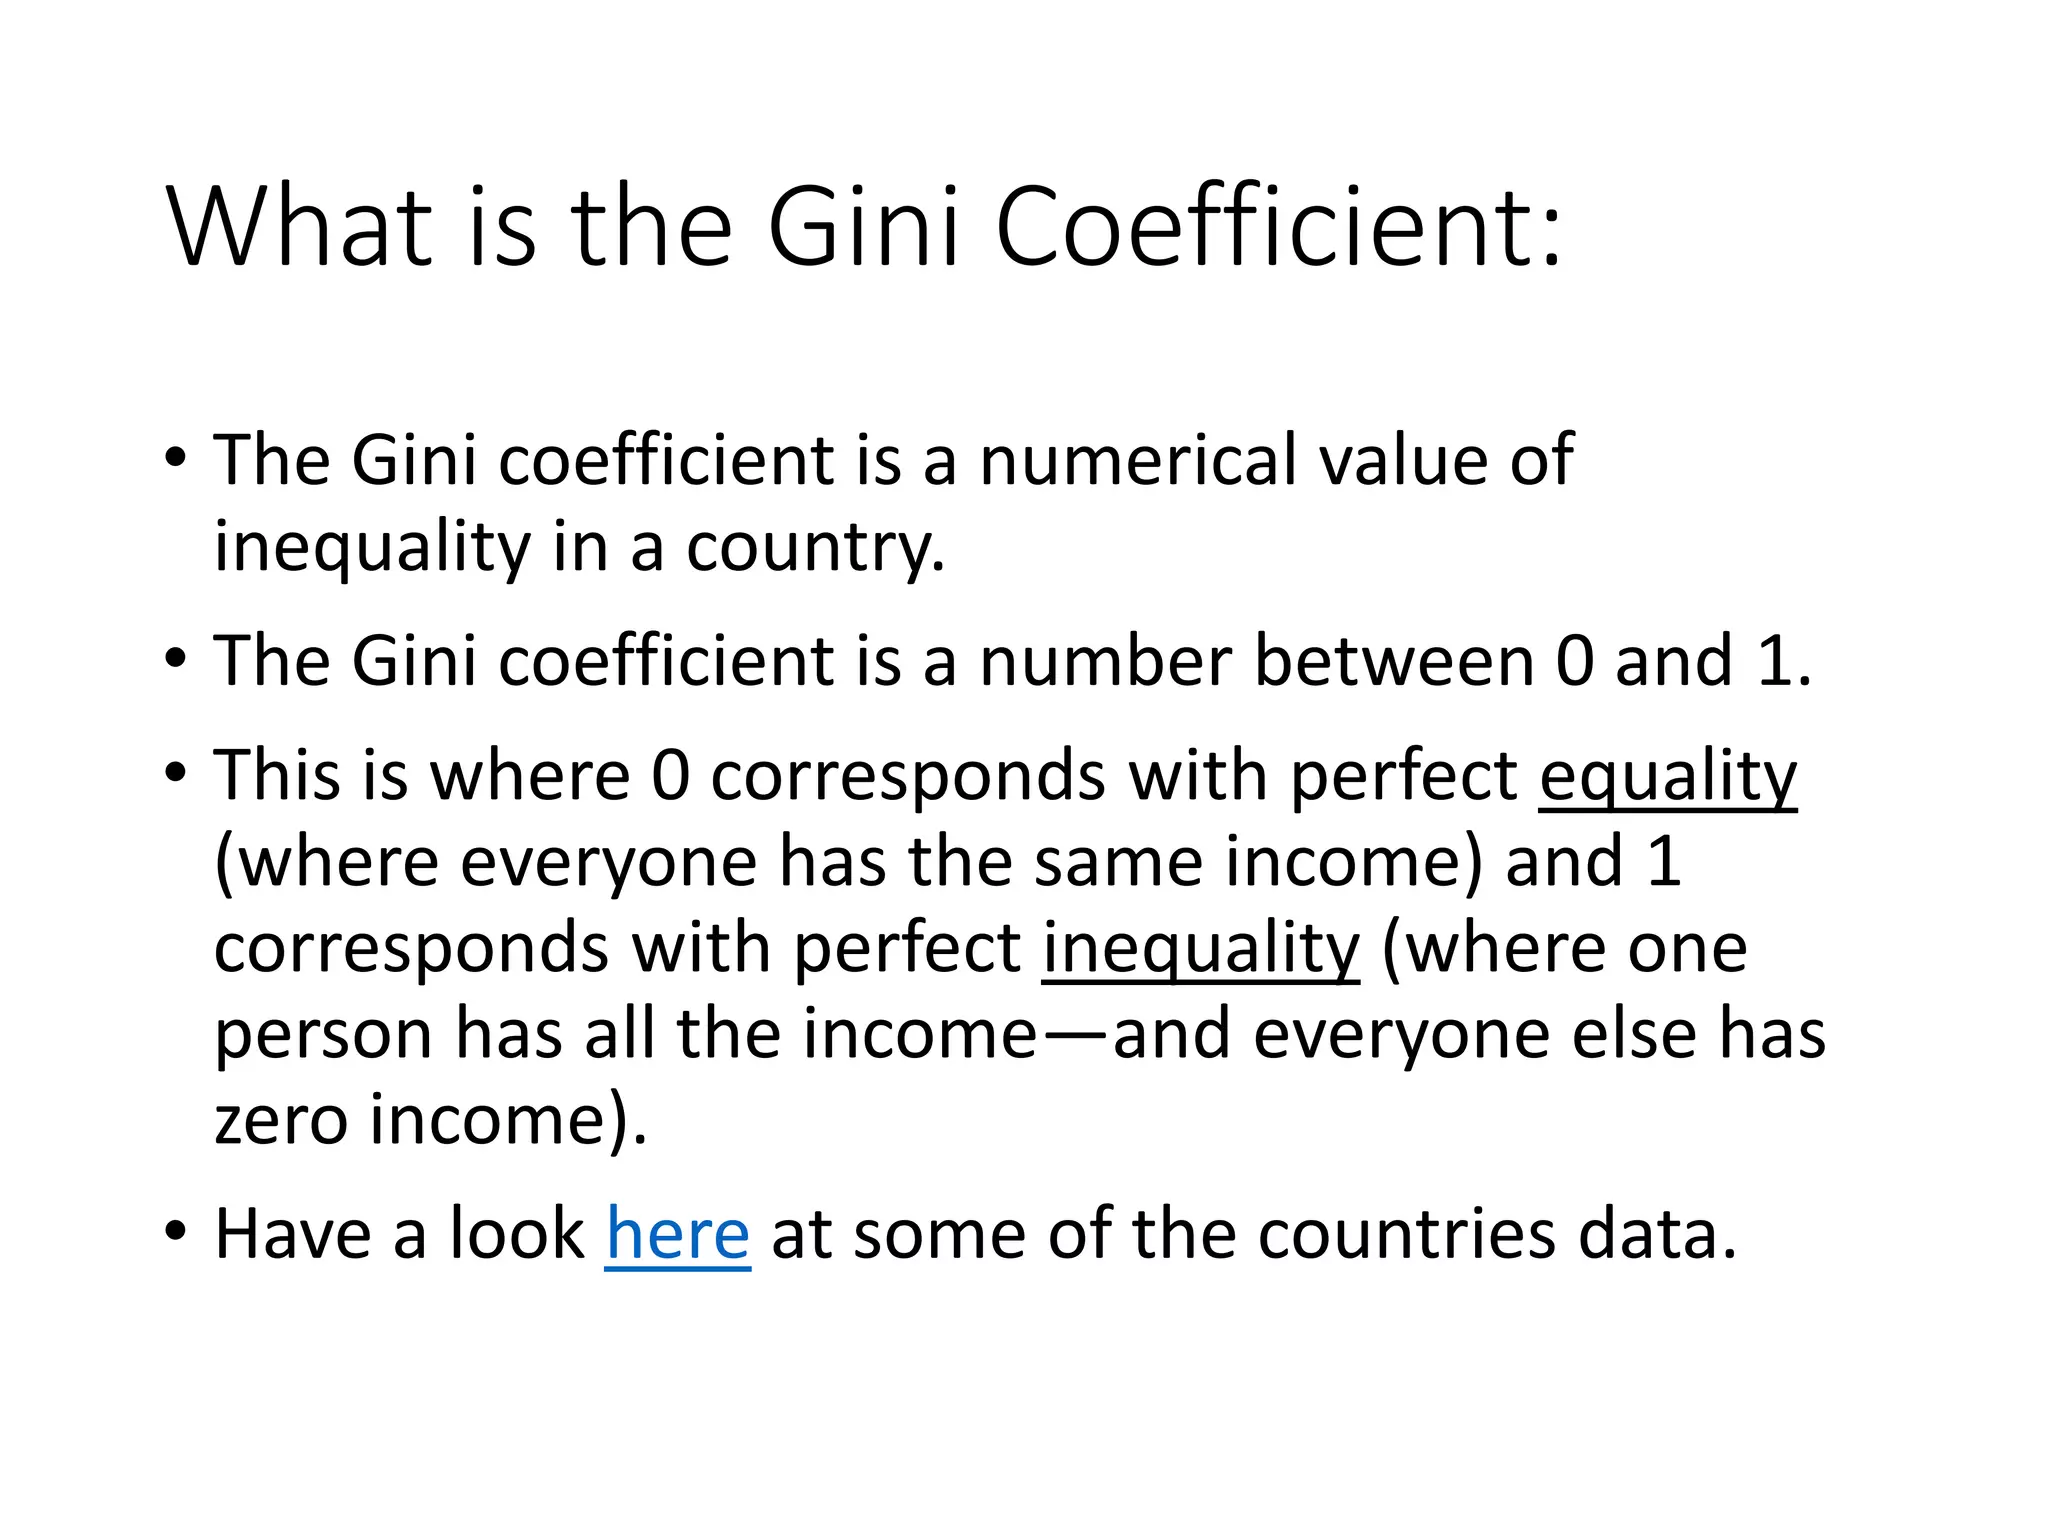
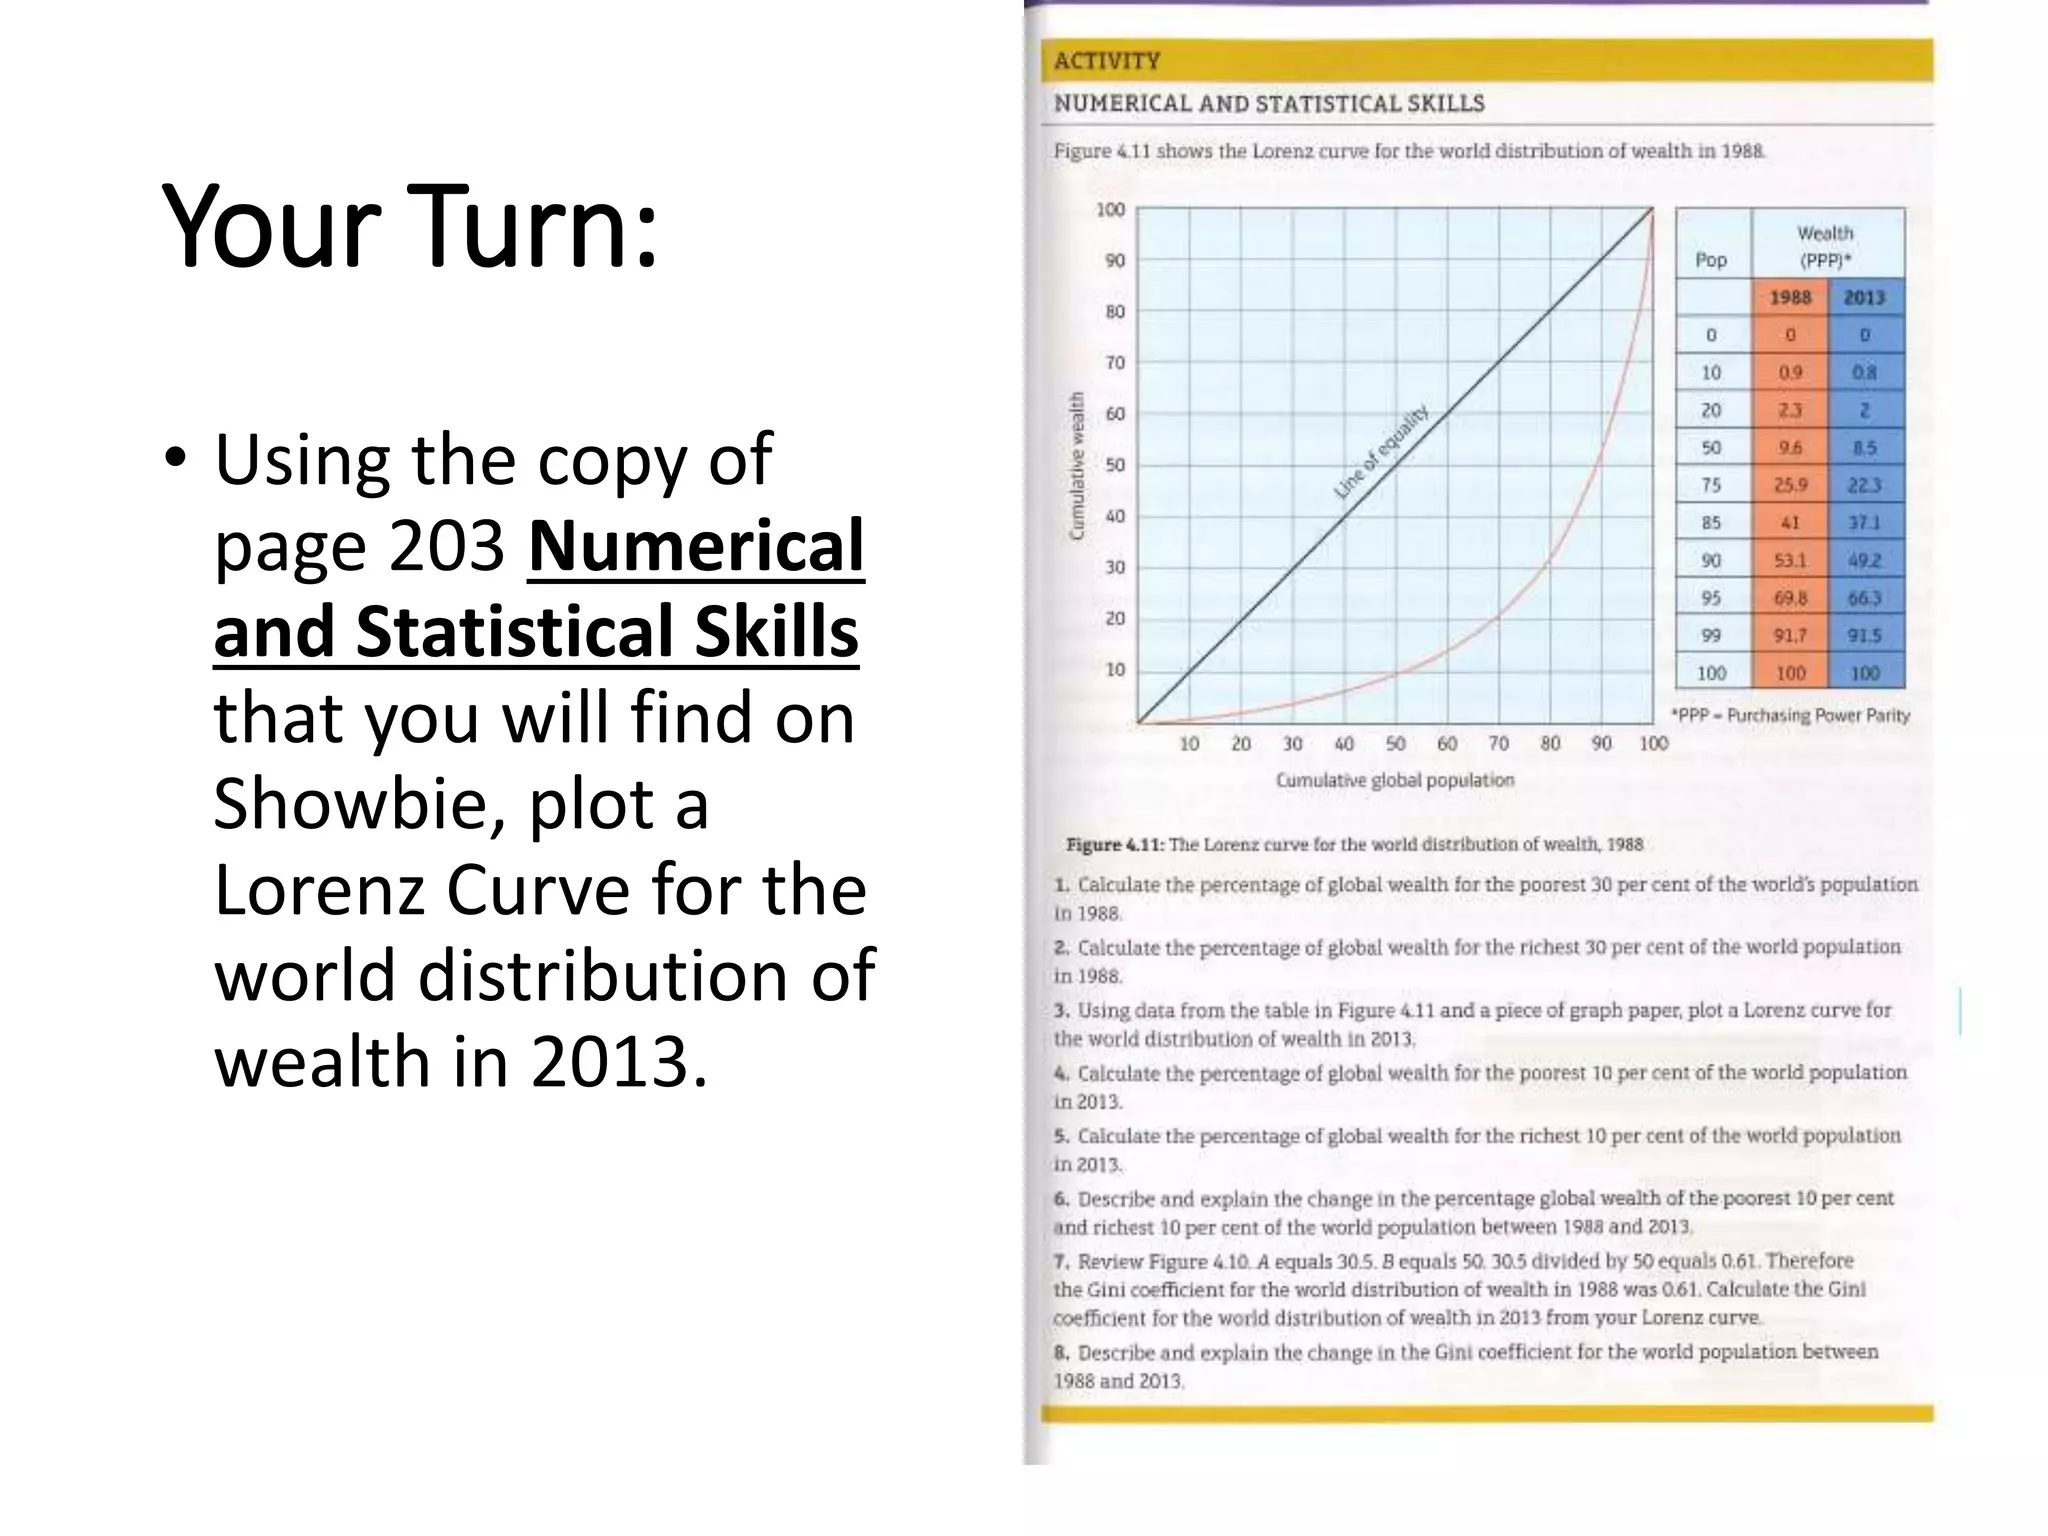
This document discusses income inequality between countries and within countries. It begins by explaining the Lorenz curve, which graphs the distribution of income in a country and shows how far it deviates from perfect equality. It then defines the Gini coefficient as a number between 0 and 1 that measures inequality, where 0 represents perfect equality and 1 represents perfect inequality. The document provides instructions on how to calculate the Gini index using the areas on a Lorenz curve diagram. It includes an example of how to find the areas and check the calculation. Finally, it asks the reader to plot a Lorenz curve for the world distribution of wealth in 2013 using data from provided sources.