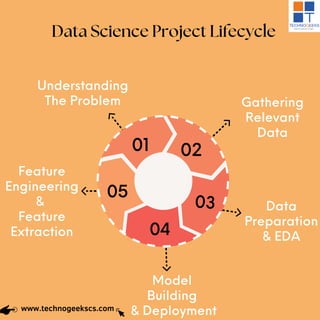
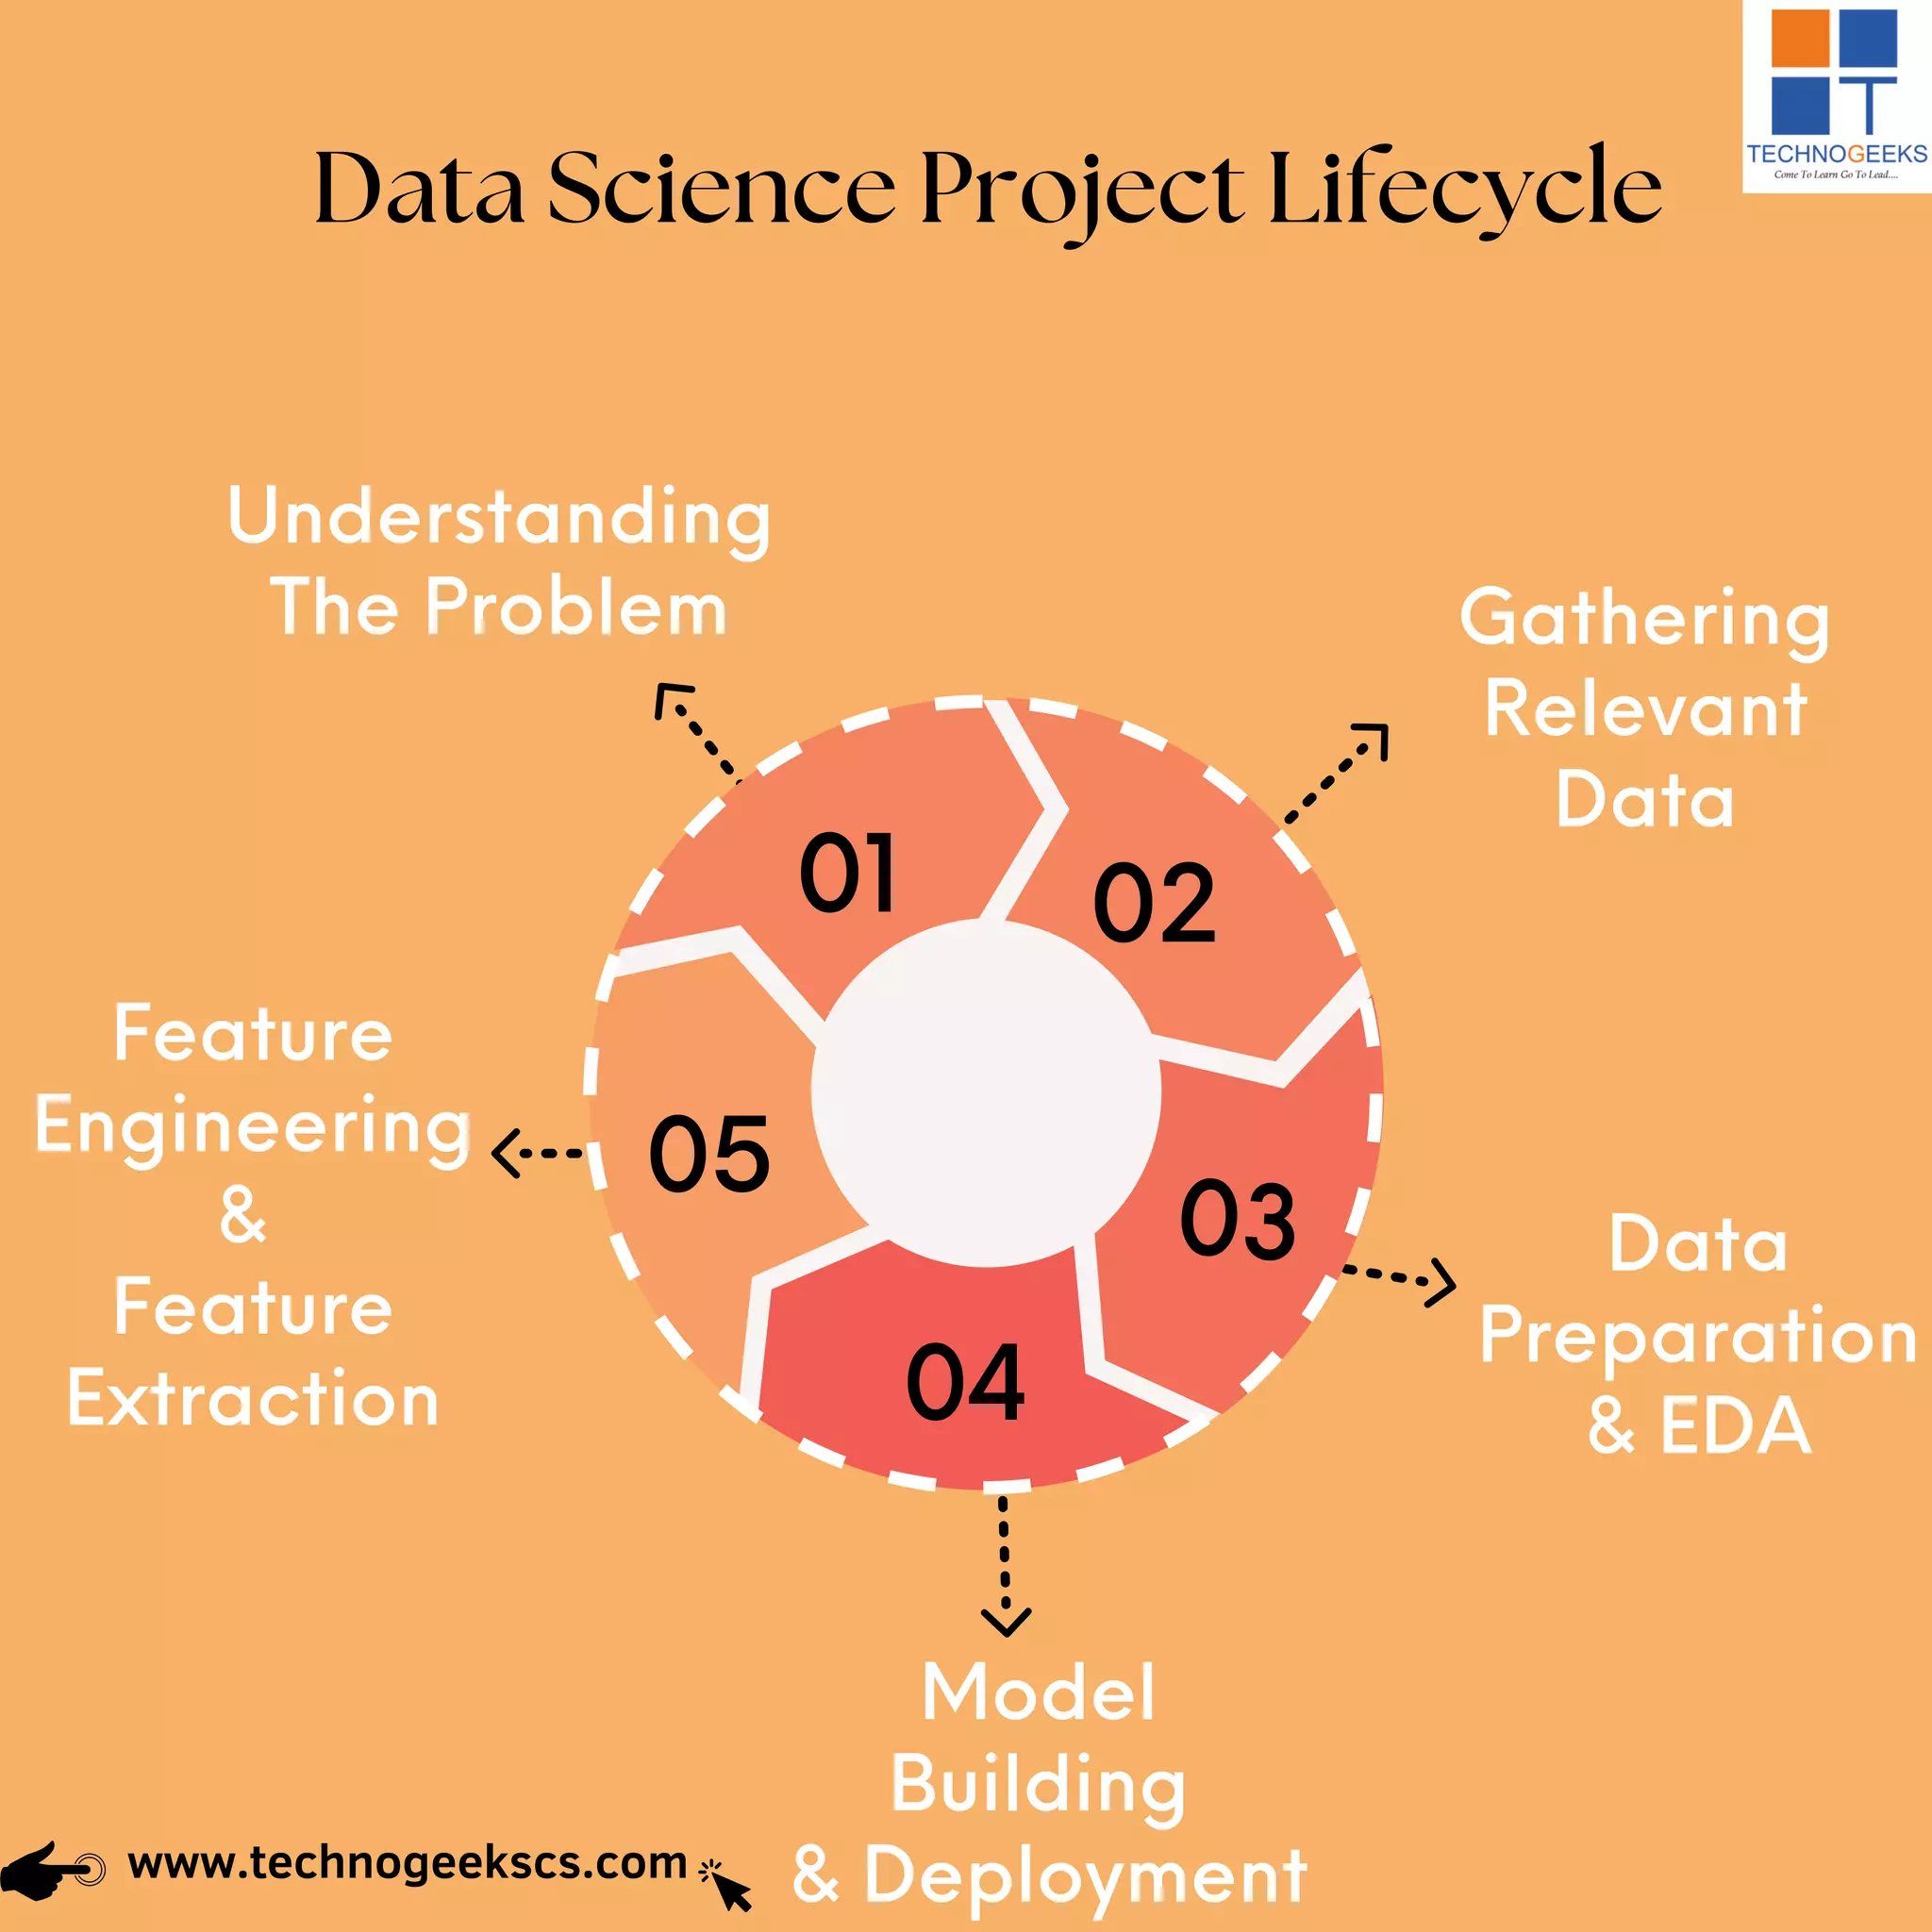
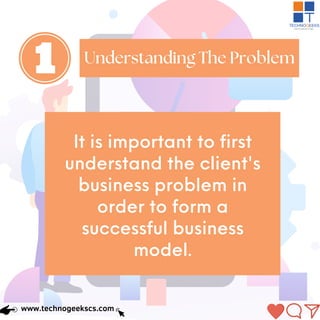
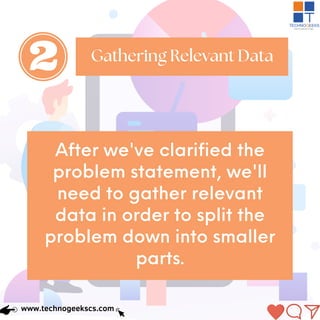
Life Cycle Of Data Science Project-
1)Understanding the problem
2)gathering Relevant Data
3)Data preparation
4)Data Modeling
5)Feature Engineering and Feature Extraction
Techknomatic is an emerging Visual Analytics company with specialization in visualization consulting using a wide range of Business Intelligence tools.
A Technology partner of choice, backed by a sound knowledge of visualization to apply analytics on business data, Techknomatic’s comprehensive range of analytics solutions help data-driven businesses turn data to insights, so one can make informed decisions at the right time.
Envisioned with making Techknomatic a key player in Visual Analytics we strive for providing insightful BI consulting as a trusted knowledge and a resource partner of our clients.
Data Architecture, Solution Architecture, Platform Architecture — What’s the ...DATAVERSITY
A solid data architecture is critical to the success of any data initiative. But what is meant by “data architecture”? Throughout the industry, there are many different “flavors” of data architecture, each with its own unique value and use cases for describing key aspects of the data landscape. Join this webinar to demystify the various architecture styles and understand how they can add value to your organization.
Doing Analytics Right - Building the Analytics EnvironmentTasktop
Implementing analytics for development processes is challenging. As in discussed in the previous webinars, the right analytics are determined by the goals of the organization, not by the available data. So implementing your analytics solutions will require an efficient analytics and data architecture, including the ability to combine and stage data from heterogeneous sources. An architecture that excludes the ability to gain access to the necessary data will create a barrier to deploying your newly designed analytics program, and will force you back into the “light is brighter here” anti-pattern.
This webinar will describe the technical considerations of implementing the data architecture for your analytics program, and explain how Tasktop can help.
Conceptual vs. Logical vs. Physical Data ModelingDATAVERSITY
A model is developed for a purpose. Understanding the strengths of each of the three Data Modeling types will prepare you with a more robust analyst toolkit. The program will describe modeling characteristics shared by each modeling type. Using the context of a reverse engineering exercise, delegates will be able to trace model components as they are used in a common data reengineering exercise that is also tied to a Data Governance exercise.
Learning objectives:
-Understanding the role played by models
-Differentiate appropriate use among conceptual, logical, and physical data models
- Understand the rigor of the round-trip data reengineering analyses
- Apply appropriate use of various Data Modeling types
Tech Jobs That Don’t Require Coding .pptxcalltutors
There are a lot of tech jobs that don't require coding languages such as data analyst, product manager, scrum master, IT Business analyst, and so on.
This presentation gives an overview of StreamCentral technology targeted for IT professionals. StreamCentral is software to model and build Big Data Solutions. StreamCentral consists of a Big Data Solutions Modeler that not only makes it easy to model traditional BI/DW and Big Data solutions but also auto deploys the model on the latest innovations in Big Data Management solutions (like HP Vertica and SQL Server Parallel Data Warehouse). StreamCentral Big Data Server executes the model definition in real-time. StreamCentral drastically reduces the time to market, risk and cost associated with building traditional BI/DW and Big Data solutions!
Using Data Science to Build an End-to-End Recommendation SystemVMware Tanzu
We get recommendations everyday: Facebook recommends people we should connect with; Amazon recommends products we should buy; and Google Maps recommends routes to take. What all these recommendation systems have in common are data science and modern software development.
Recommendation systems are also valuable for companies in industries as diverse as retail, telecommunications, and energy. In a recent engagement, for example, Pivotal data scientists and developers worked with a large energy company to build a machine learning-based product recommendation system to deliver intelligent and targeted product recommendations to customers to increase revenue.
In this webinar, Pivotal data scientist Ambarish Joshi will take you step-by-step through the engagement, explaining how he and his Pivotal colleagues worked with the customer to collect and analyze data, develop predictive models, and operationalize the resulting insights and surface them via APIs to customer-facing applications. In addition, you will learn how to:
- Apply agile practices to data science and analytics.
- Use test-driven development for feature engineering, model scoring, and validating scripts.
- Automate data science pipelines using pyspark scripts to generate recommendations.
- Apply a microservices-based architecture to integrate product recommendations into mobile applications and call center systems.
Presenters: Ambarish Joshi and Jeff Kelly, Pivotal
Combining structured project data from Deltek Vision with photography and graphics from a DAM (digital asset management) system speeds marketing workflows. Without a DAM, project photography and marketing graphics often reside in a file folder system on shared network drives. With a DAM, marketers can tag graphics with keywords and make them easily searchable and accessible firm-wide. By linking a DAM with project information in Deltek Vision, marketing graphics are always tagged with the most up to date and accurate project codes and details. Attend this session if you're an AEC marketer looking to improve graphics and photo management, and leverage project data from Vision to produce brochure-quality documents fast.
DataOps - The Foundation for Your Agile Data ArchitectureDATAVERSITY
Achieving agility in data and analytics is hard. It’s no secret that most data organizations struggle to deliver the on-demand data products that their business customers demand. Recently, there has been much hype around new design patterns that promise to deliver this much sought-after agility.
In this webinar, Chris Bergh, CEO and Head Chef of DataKitchen will cut through the noise and describe several elegant and effective data architecture design patterns that deliver low errors, rapid development, and high levels of collaboration. He’ll cover:
• DataOps, Data Mesh, Functional Design, and Hub & Spoke design patterns;
• Where Data Fabric fits into your architecture;
• How different patterns can work together to maximize agility; and
• How a DataOps platform serves as the foundational superstructure for your agile architecture.
Efforts to improve computer software have led to the general use of certain methodologies, such as the Agile System Development Lifecycle, that are extremely focused on software coding. Even common technologies used for Big Data analytics, such as Hadoop and commodity disc storage, require additional programmer attention to implement capabilities that used to be handled by relational database management systems and (the) smart disc. How are organizations that are successfully “data driven” changing to focus on data-centric development?
Canadian Experts Discuss Modern Data Stacks and Cloud Computing for 5 Years o...Daniel Zivkovic
Two #ModernDataStack talks and one DevOps talk: https://youtu.be/4R--iLnjCmU
1. "From Data-driven Business to Business-driven Data: Hands-on #DataModelling exercise" by Jacob Frackson of Montreal Analytics
2. "Trends in the #DataEngineering Consulting Landscape" by Nadji Bessa of Infostrux Solutions
3. "Building Secure #Serverless Delivery Pipelines on #GCP" by Ugo Udokporo of Google Cloud Canada
We ran out of time for the 4th presenter, so the event will CONTINUE in March... stay tuned! Compliments of #ServerlessTO.
Most Popular Backend Framework :-
➤ Spring Framework + Spring boot for Java Developers
➤ Django for Python Developers
➤ Express.js for JavaScript Developers
➤ ASP.NET core for .NET developers
➤ Laravel for PHP Programmers
➤ Ruby on Rails for Ruby Programmers
➤ CakePHP Framework for PHP Developers
➤ Flask Framework for Python Developers
A free and open source front-end development framework called Bootstrap.
It is used to build websites and web applications.
The main goal of this utility was to build a tool that helps in the development of website-related applications fast, easy, convenient and more responsive.
Its availability of many size, color, font, and layout options for the project was the main factor in its inclusion in the Bootstrap framework.
➤ Microsoft Excel was developed by Microsoft Corporation in 1994 and is used to present numeric and statistical data in a tabular form.
➤ SQL was developed in the 1970s by IBM researchers Raymond Boyce and Donald Chamberlin to extract, organize, manage & manipulate data stored in relational databases.
➤ Excel is a spreadsheet or worksheet file made of rows and columns that help sort, organize, and calculate numerical data.
➤ SQL is a query language used to manipulate databases and get information stored in a relational database management system (RDBMS).
➤ Excel is helpful for producing quick data summaries and visualizations
➤ SQL is needed to work with large volumes of data, manage databases, and use relational databases to their full potential.
➤ Microsoft Excel is used in business analyst roles for quick calculations, data summaries, and data visualizations.
➤ Data analysts use SQL to take care of large databases and find important and relevant data for business use.
➤ In Microsoft Excel, even slightly more than 100,000 will probably cause your computer to slow down.
➤ SQL does not slow down with larger data sets depending on the software and database.
In Excel, your data is saved in a file that is typically set up with tabs, columns, and rows on your computer.
➤ You make SQL queries and send them to the database. The database gets them and either fulfills your requests or changes them.
➤ Excel does not include encryption features for protecting sensitive data such as personally identifiable information, financial data, etc.
➤ The SQL database is designed to be a secure database platform. It has a number of features that can encrypt data, limit access and authorization, and keep data from being stolen, destroyed, or used in other bad ways.
➤ Excel spreadsheets are susceptible to small human mistakes.
➤The most common SQL error is a syntax error.
How to visualize Number using Python Library sunil173422
Matplotlib is a popular
Python library that is used
to create 2D plots.
It takes data from an array of
numbers and generates a plot
in the form of a graph or
image.
Matplotlib provides many methods to visualize
numbers and their squares using different colors,shapes, and graphs.
👉 Java and Python are two of the most popular programming languages. In this Java vs. Python comparison, we examine how the two languages compare to one another.
👉 Python is an object-oriented language, whereas Java is a procedural language, which is the primary distinction between the two. Both are excellent languages for developing web apps.
👉 Python comes in first on the TIOBE index's list, whereas Java comes in third.
👉 Python is an interpreted and dynamically typed language, while Java is a statically typed and compiled language. Java runs faster and is simpler to debug, but Python is simpler to use and read.
👉 Multi-cloud is a combination of on-premise, public, and private clouds.
It can be a combination of Saas, PaaS & IaaS Services.
👉 Hybrid cloud computing is a service that delivers the best of both private and public cloud features. You get the security of a private cloud. But you also get the elasticity, flexibility, and cost savings of a public cloud.
A hybrid cloud combines both public and private clouds to give customers additional flexibility and greater control over their computing environment.
This solution allows an organization to take advantage of private cloud economies (such as a more streamlined on-premises IT infrastructure) while still providing the elasticity and agility of a public cloud.
Hybrid cloud computing enables enterprises to achieve higher availability, better performance, more functionality, and higher security.
Comparison Between react js & react nativesunil173422
There are some major differences between Reactjs and Native React.
Take a look at following👇
👉 Reactjs is a JavaScript library that allows programmers to design an engaging and high-performing user interface layer, whereas React Native is a complete framework for developing cross-platform apps for the web, iOS, and Android.
👉 React Native is similar to React, but instead of using web components as building blocks, it uses native components. Rather than the browser, it is focused on mobile platforms.
👉 React is the base abstraction of React DOM for the web platform in React JS, whereas in React Native, React is the base abstraction of React Native. As a result, the syntax and workflow stay the same, but the components do not.
ETL Testing Vs Database Testing-
ETL and database testing both involve data validation, but they are not the same thing. Database testing is typically performed on transactional systems, whereas ETL testing is performed on data in a data warehouse. The transactional database receives data from various applications.
CI/CD is an important DevOps practice as well as a best practice in Agile methodology.
This strategy enables development teams to deliver and deploy applications continuously, hence speeding up the application development & deployment process.
Elements Of CI/CD Pipelines -
1)Build
2)Test
3)Release
4)Deploy
5)Validation and compliance
DevOps Site Reliability Engineer Vs DevOpssunil173422
SRE bridges the gap between developers and IT operations teams to design and maintain an organization's systems' scalability, stability, and predictability.
While DevOps model was developed to remove silos between development and operations teams to work together across the entire software application cycle of development, test, deployment to operations.
Learn Data Science With Python
Step1 - Mastering Python
step2 - Data Analysis with Python
step3 - Data Visualization with Python
step4 - Machine Learning with Python
step5 - NLP with Deep Learning
step6 - REST API with Flask and Python
👉 ETL and ELT are three-phase process types of data processing that are used in data integration and data analytics.
👉 ETL stands for Extract, Transform, and Load.
👉 ELT stands for Extract, Load, and Transform.
👉 Both ETL and ELT use similar steps to process data.
👉 The key difference between these two is the fact that with ETL you have to first load the data into your database before it can be transformed, while with ELT you can just do the transformation without loading any data at all.
Relationship between DEVOPS AND CLOUD-
-DevOps and cloud can collaborate in this way since everyone is learning new definitions and techniques at the same time.
-Developers and operations are both comfortable with the cloud's new language, since developers frequently teach operations about code and operations can teach developers about infrastructure and security.
-Resulting in a meeting place that fosters good team chemistry.
Role of DevOps in the Cloud when helping organizations-
1)Build
2)Testing
3)Run
"Data pipelines" are a collection of processes that transmit data from one location to another location.
The end-to-end process of gathering data, turning it into insights and models, disseminating insights, and applying the model whenever and wherever the action is required to achieve the business goal is stitched together by a data pipeline.
Architects and developers have had to adjust to "big data" because of the significantly increased volume, diversity, and velocity of data in recent years.
Big Data is a collection of large amounts of complicated or unstructured data that is difficult to process using typical data processing software or on-hand database management solutions.
There are five defining properties that can help break down Big Data.
And these five characteristics that define big data are volume, variety, velocity, value and veracity.
Unit 8 - Information and Communication Technology (Paper I).pdfThiyagu K
This slides describes the basic concepts of ICT, basics of Email, Emerging Technology and Digital Initiatives in Education. This presentations aligns with the UGC Paper I syllabus.
Introduction to AI for Nonprofits with Tapp NetworkTechSoup
Dive into the world of AI! Experts Jon Hill and Tareq Monaur will guide you through AI's role in enhancing nonprofit websites and basic marketing strategies, making it easy to understand and apply.
Acetabularia Information For Class 9 .docxvaibhavrinwa19
Acetabularia acetabulum is a single-celled green alga that in its vegetative state is morphologically differentiated into a basal rhizoid and an axially elongated stalk, which bears whorls of branching hairs. The single diploid nucleus resides in the rhizoid.
Macroeconomics- Movie Location
This will be used as part of your Personal Professional Portfolio once graded.
Objective:
Prepare a presentation or a paper using research, basic comparative analysis, data organization and application of economic information. You will make an informed assessment of an economic climate outside of the United States to accomplish an entertainment industry objective.
Biological screening of herbal drugs: Introduction and Need for
Phyto-Pharmacological Screening, New Strategies for evaluating
Natural Products, In vitro evaluation techniques for Antioxidants, Antimicrobial and Anticancer drugs. In vivo evaluation techniques
for Anti-inflammatory, Antiulcer, Anticancer, Wound healing, Antidiabetic, Hepatoprotective, Cardio protective, Diuretics and
Antifertility, Toxicity studies as per OECD guidelines
Synthetic Fiber Construction in lab .pptxPavel ( NSTU)
Synthetic fiber production is a fascinating and complex field that blends chemistry, engineering, and environmental science. By understanding these aspects, students can gain a comprehensive view of synthetic fiber production, its impact on society and the environment, and the potential for future innovations. Synthetic fibers play a crucial role in modern society, impacting various aspects of daily life, industry, and the environment. ynthetic fibers are integral to modern life, offering a range of benefits from cost-effectiveness and versatility to innovative applications and performance characteristics. While they pose environmental challenges, ongoing research and development aim to create more sustainable and eco-friendly alternatives. Understanding the importance of synthetic fibers helps in appreciating their role in the economy, industry, and daily life, while also emphasizing the need for sustainable practices and innovation.
How to Make a Field invisible in Odoo 17Celine George
It is possible to hide or invisible some fields in odoo. Commonly using “invisible” attribute in the field definition to invisible the fields. This slide will show how to make a field invisible in odoo 17.
1. Data Science Project Lifecycle
01 02
03
04
05
Gathering
Relevant
Data
Data
Preparation
& EDA
Feature
Engineering
&
Feature
Extraction
Model
Building
& Deployment
Understanding
The Problem
www.technogeekscs.com
2. Understanding The Problem
It is important to first
understand the client's
business problem in
order to form a
successful business
model.
www.technogeekscs.com
3. Gathering Relevant Data
After we've clarified the
problem statement, we'll
need to gather relevant
data in order to split the
problem down into smaller
parts.
www.technogeekscs.com
4. Data Preparation
We must proceed to data
preparation after acquiring
data from appropriate
sources. This stage aids in the
comprehension of the data
and prepares it for further
analysis.
www.technogeekscs.com
5. Data Modeling
We use the prepared data
as the input in this data
modeling procedure, and
we try to create the desired
output with it.
www.technogeekscs.com
6. This is the final step in the data
science project life cycle.
We need to be sure we've
chosen the right solution after
a thorough evaluation before
we deploy the model. It's then
distributed on the specified
channel and format.
www.technogeekscs.com
Feature Engineering &
Feature Extraction