Download as PDF, PPTX


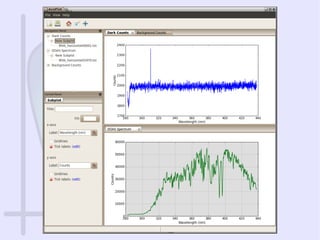

![FTIR Plugin
#define new data series type for FTIR data
class FTIRSpectrumData(series.XYDataSeries):
def __init__(self, *args, **kwargs):
super(FTIRSpectrumData, self).__init__(*args, **kwargs)
self.add_control_panel(BackgroundCalcCtrl(self))
@staticmethod
def get_supported_subplot_type():
return FTIRSpectrumSubplot
class FTIRPlugin(plugins.AvoPlotPluginSimple):
def __init__(self):
super(FTIRPlugin, self).__init__("FTIR Plugin", FTIRSpectrumData)
self.set_menu_entry(['FTIR', 'New Spectrum'], "Plot an FTIR spectrum")](https://image.slidesharecdn.com/lifeaftermatplotlibbykaylalacovino-140421100904-phpapp01/85/Life-after-Matplotlib-Harder-Better-Faster-Stronger-by-Kayla-Lacovino-20-320.jpg)


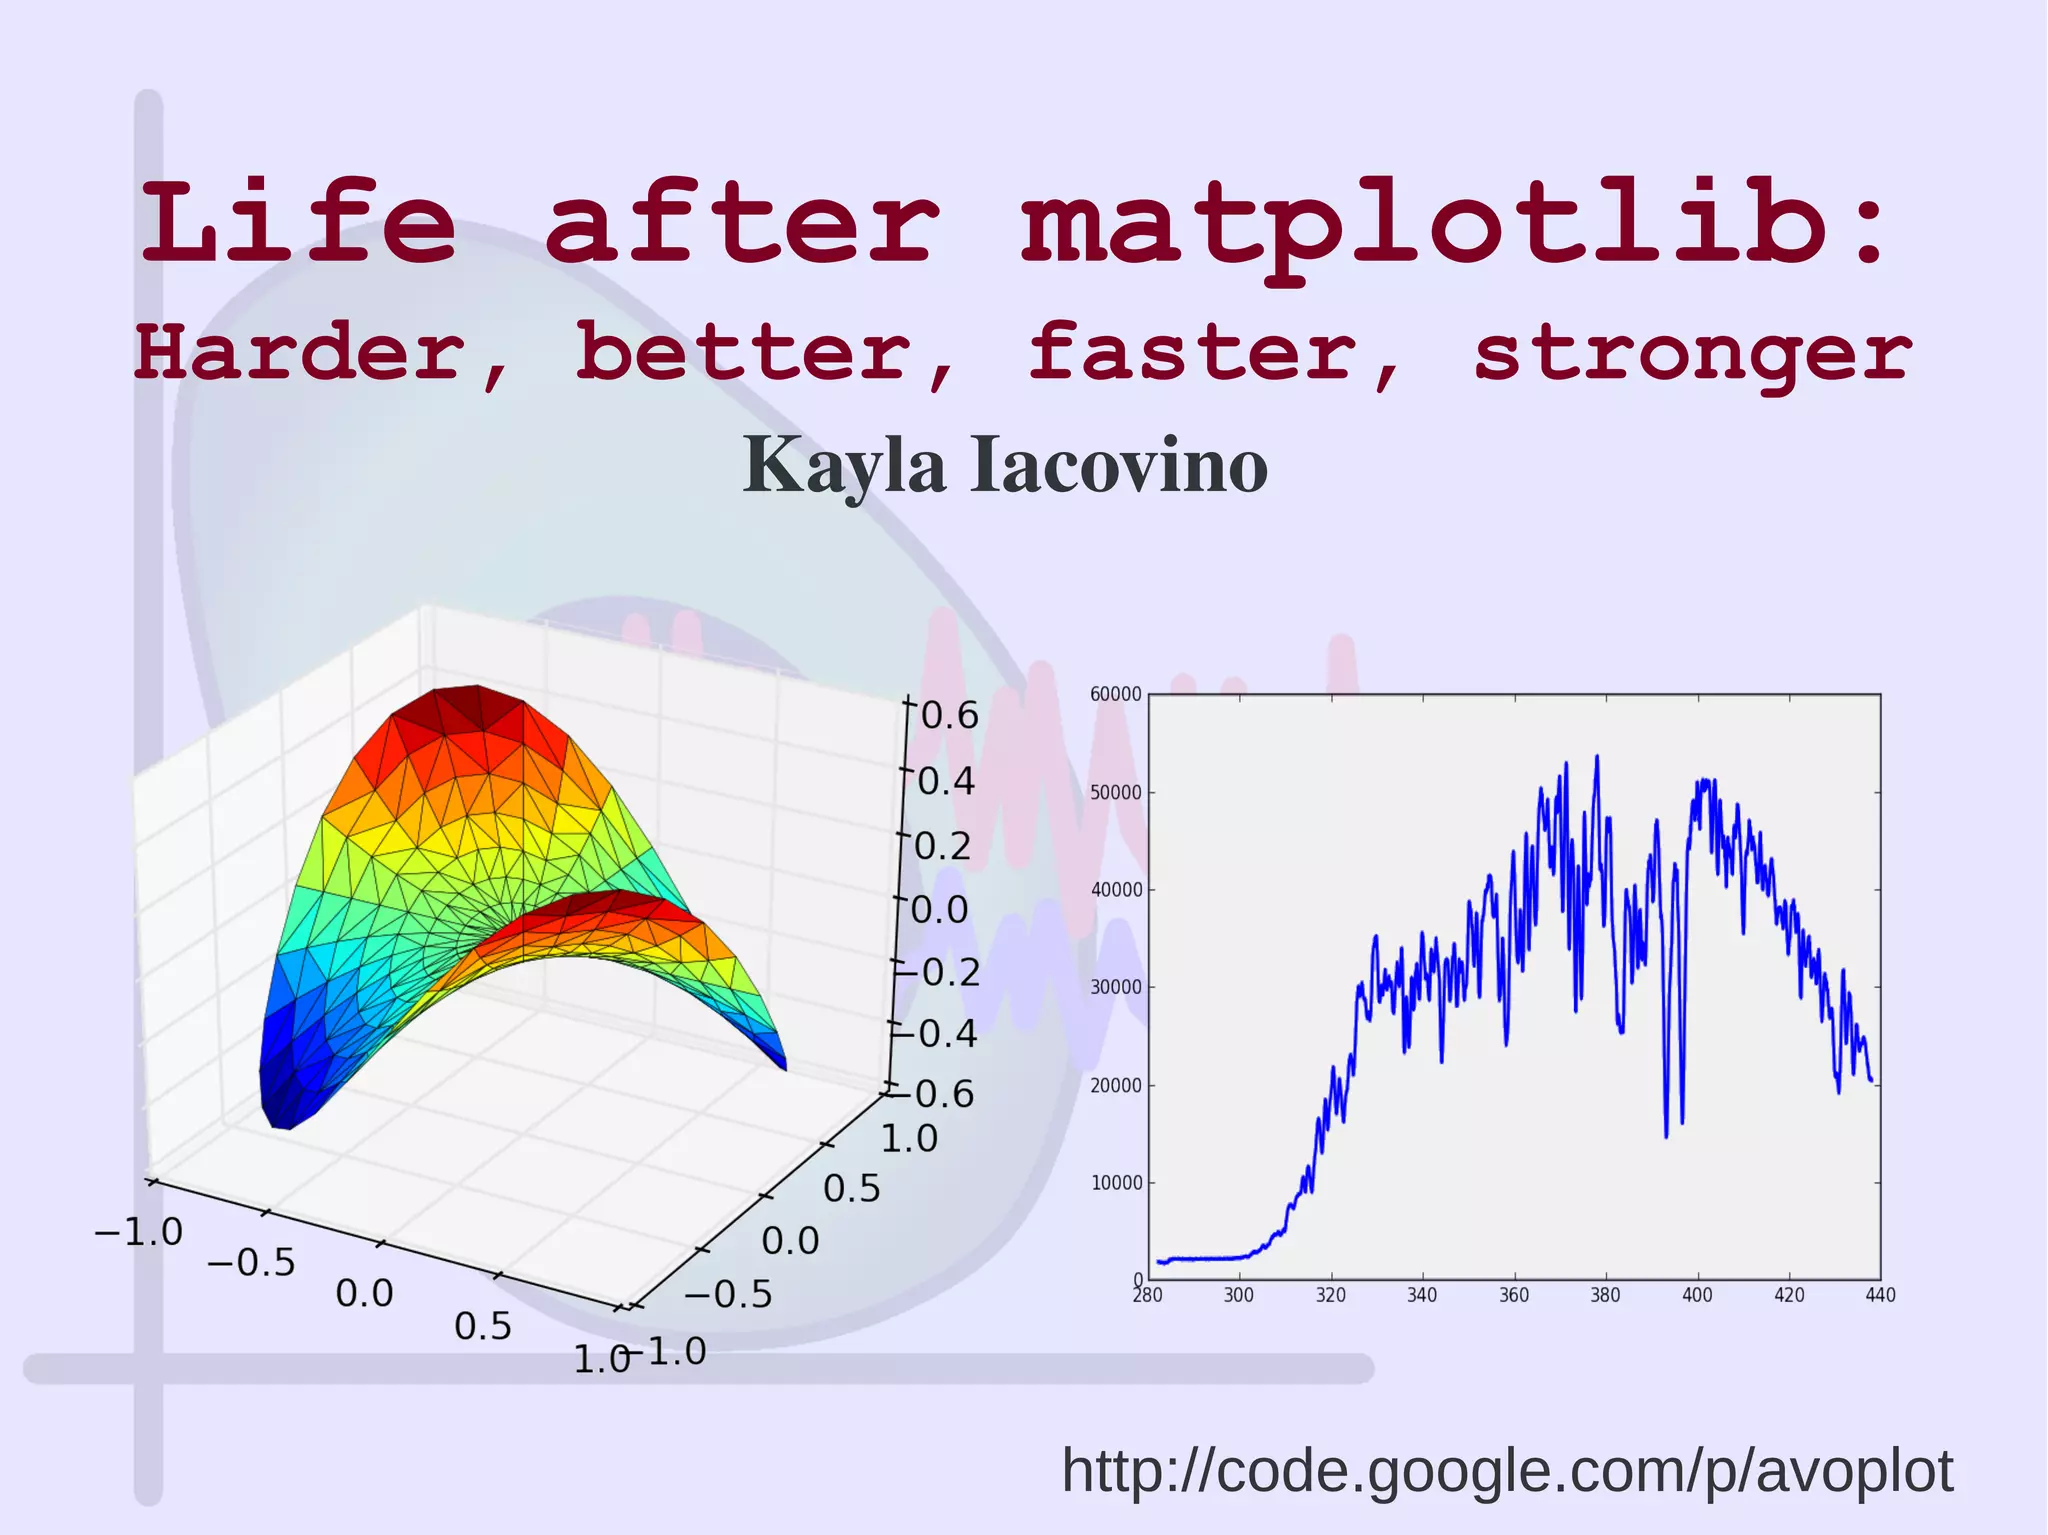
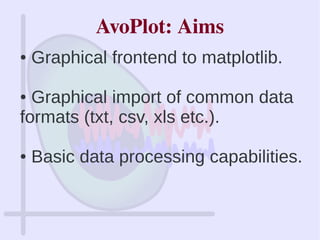
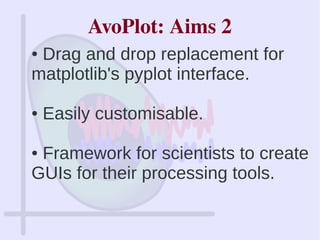
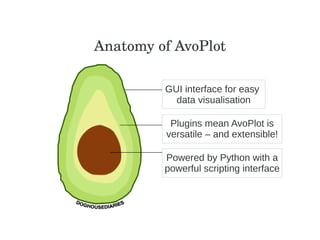
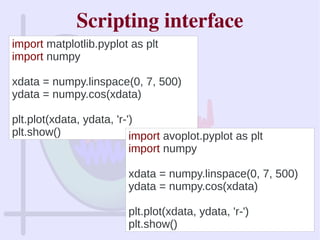
This document introduces AvoPlot, a graphical frontend for matplotlib that aims to make data visualization easier for scientists. AvoPlot allows graphical import of common data formats, basic data processing, and a drag-and-drop replacement for matplotlib's plotting interface. Plugins can be created to add new data types and processing tools. The document provides background on issues with existing tools, outlines AvoPlot's design and goals, and demonstrates its scripting interface and use of plugins through an example FTIR plugin. It concludes by inviting more developers to contribute to the open source project.


![[Game] Programming I Didn't Learn in School](https://cdn.slidesharecdn.com/ss_thumbnails/progammingididnt-170622202727-thumbnail.jpg?width=640&height=640&fit=bounds)


![[COSCUP 2018] uTensor C++ Code Generator](https://cdn.slidesharecdn.com/ss_thumbnails/coscuputensor-180813100051-thumbnail.jpg?width=640&height=640&fit=bounds)