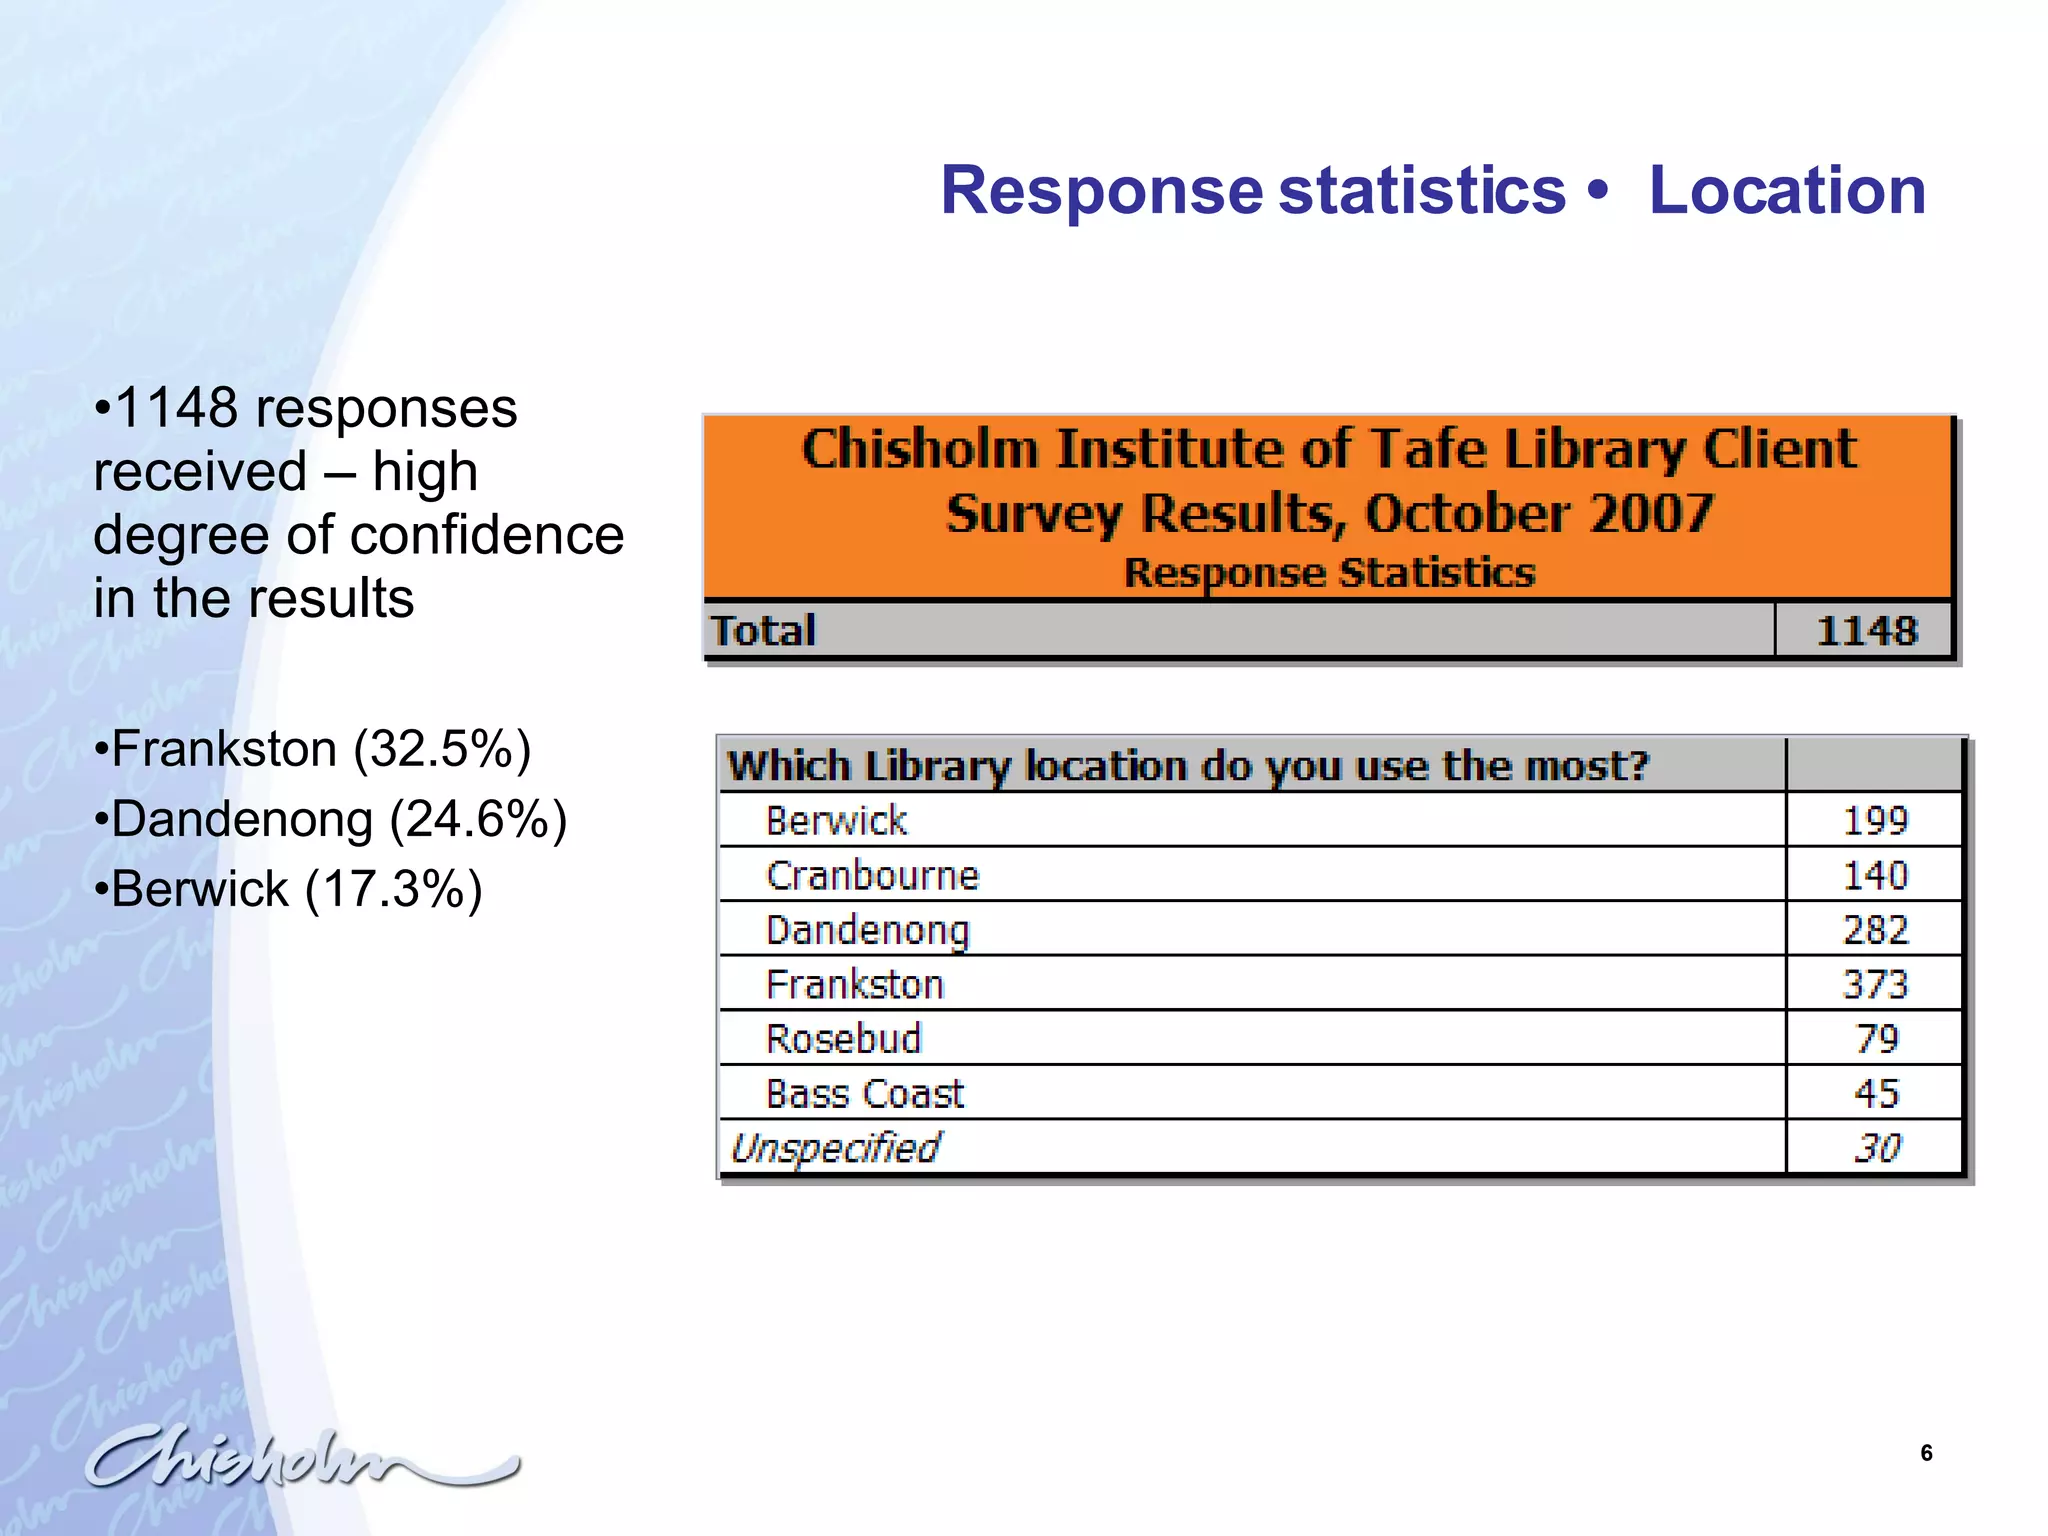
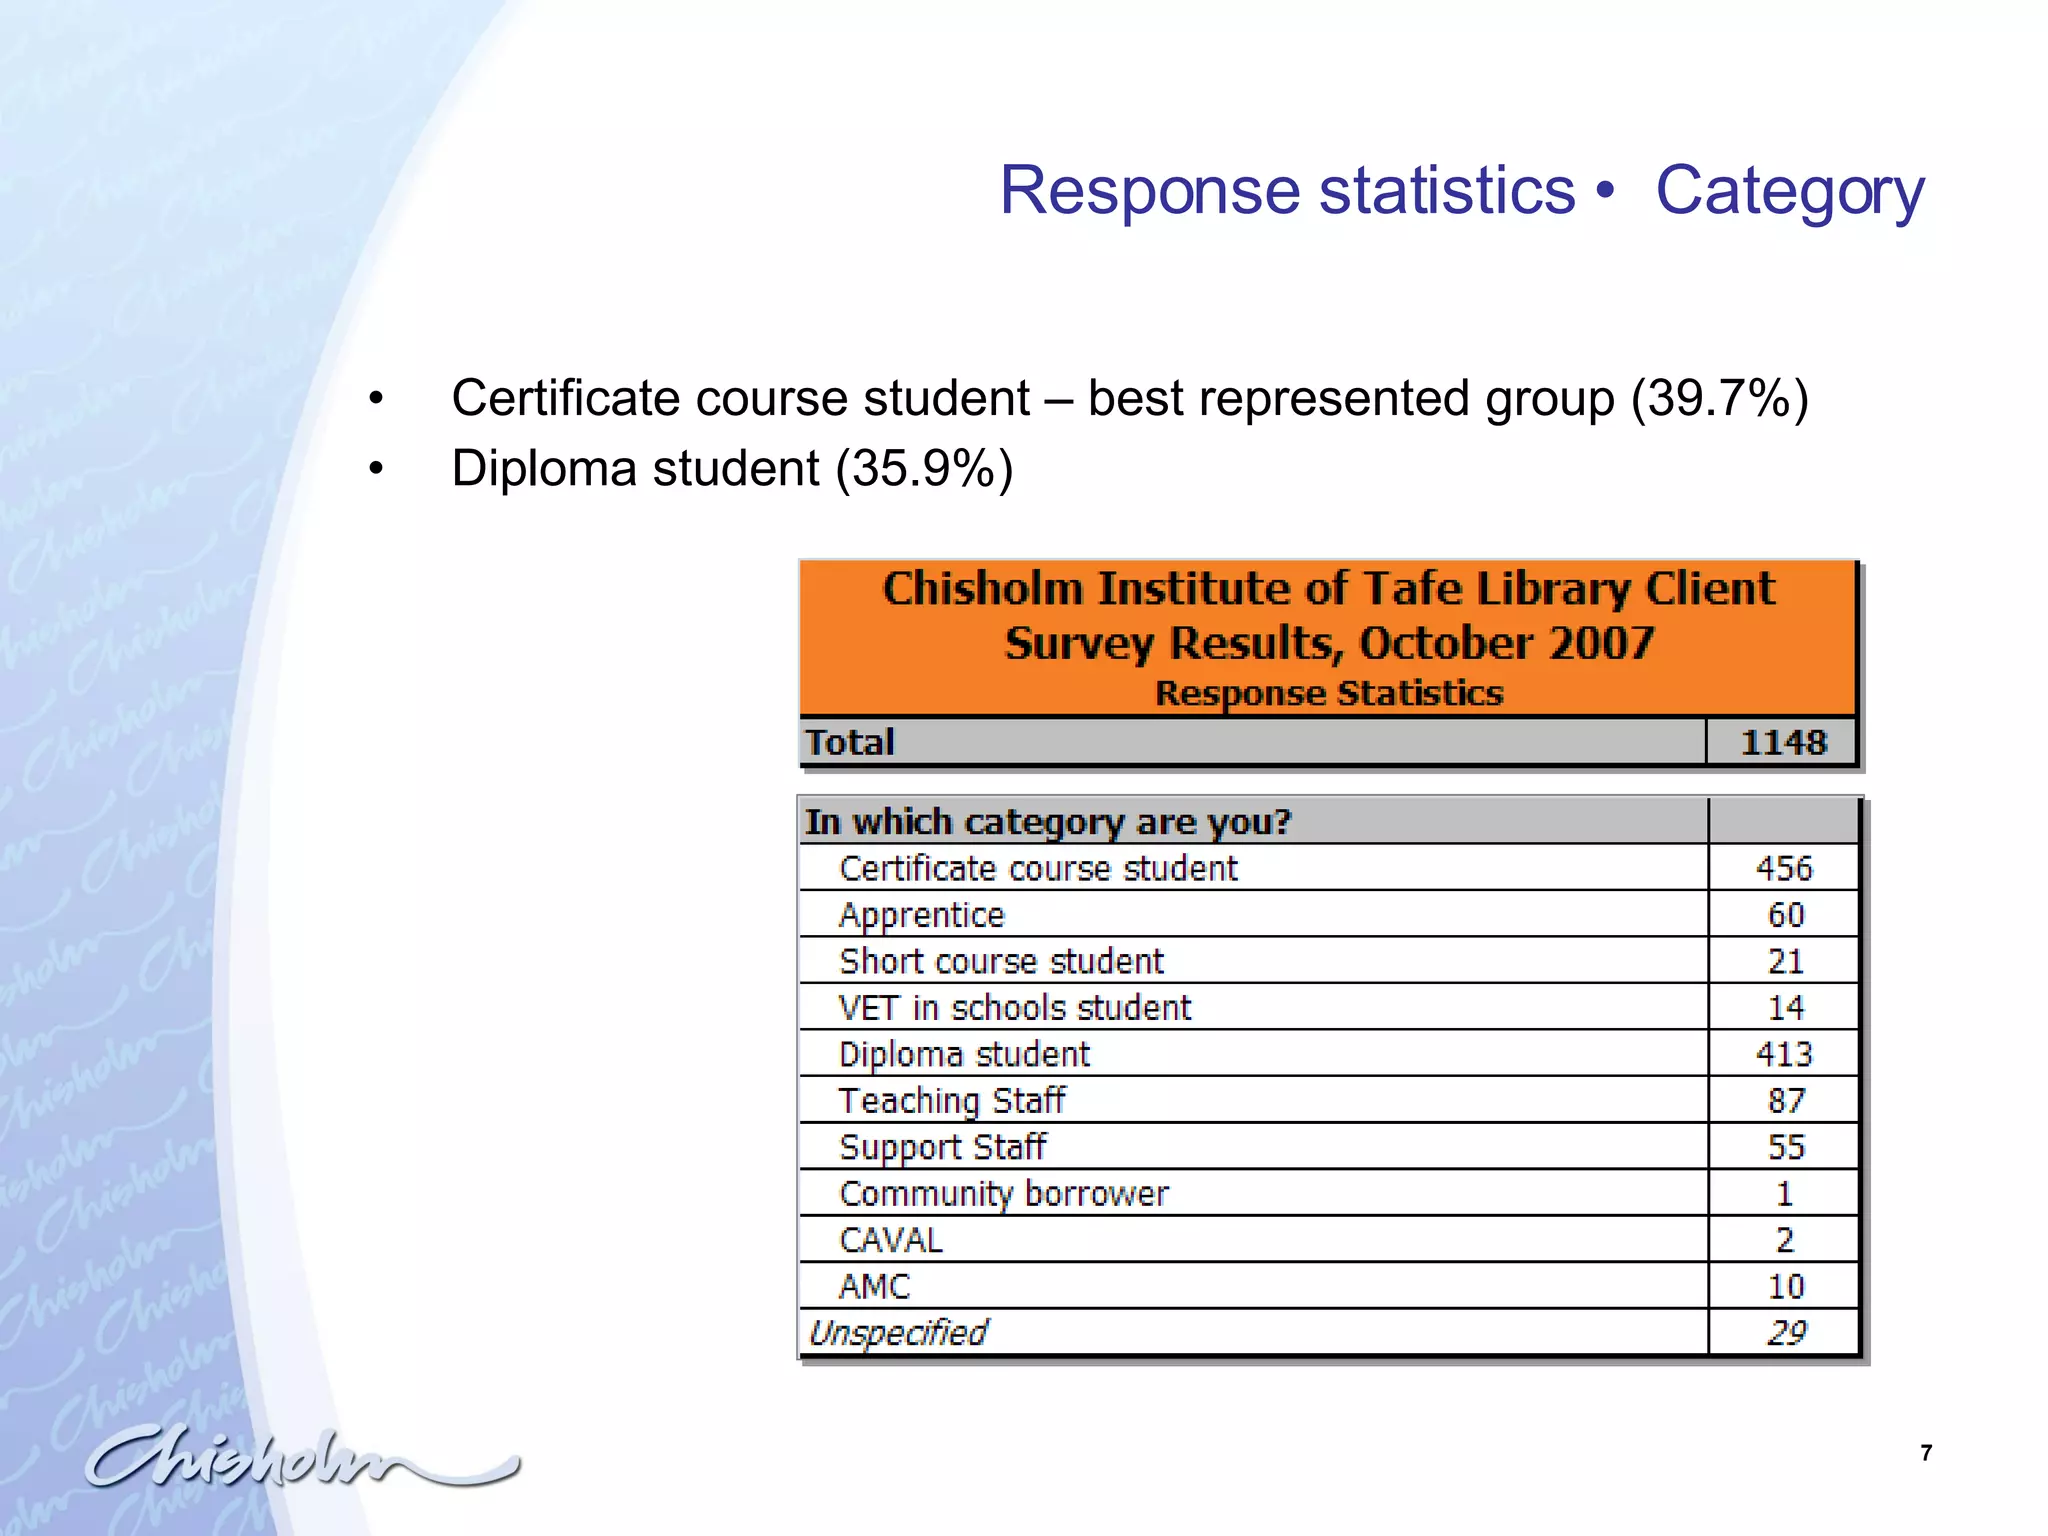
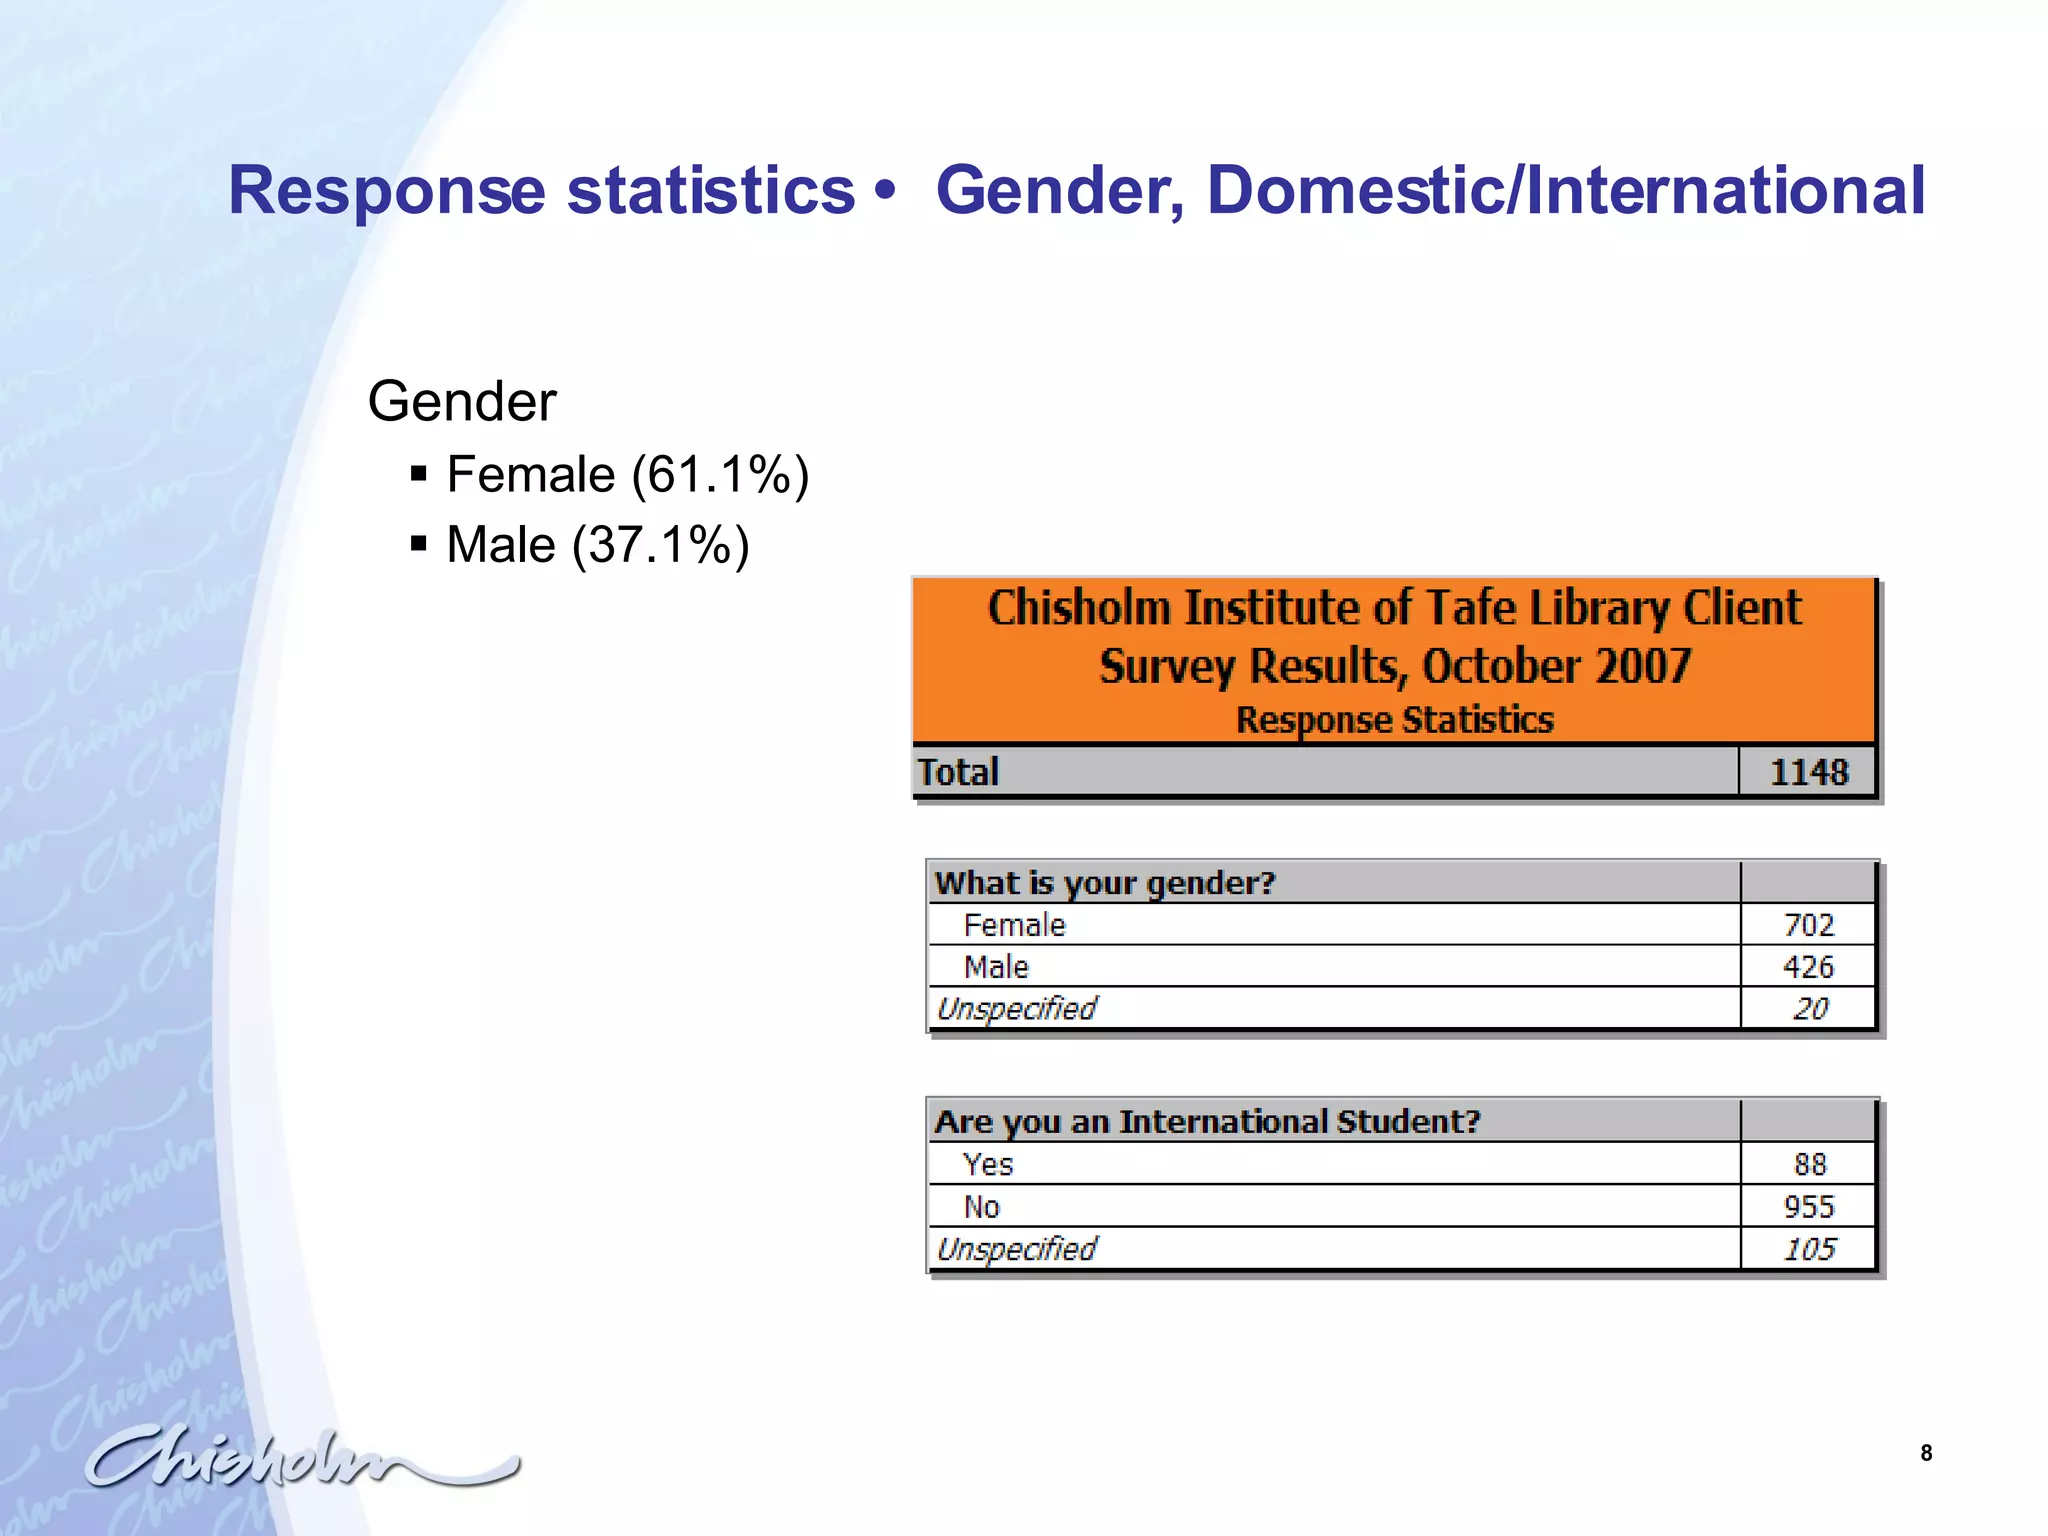
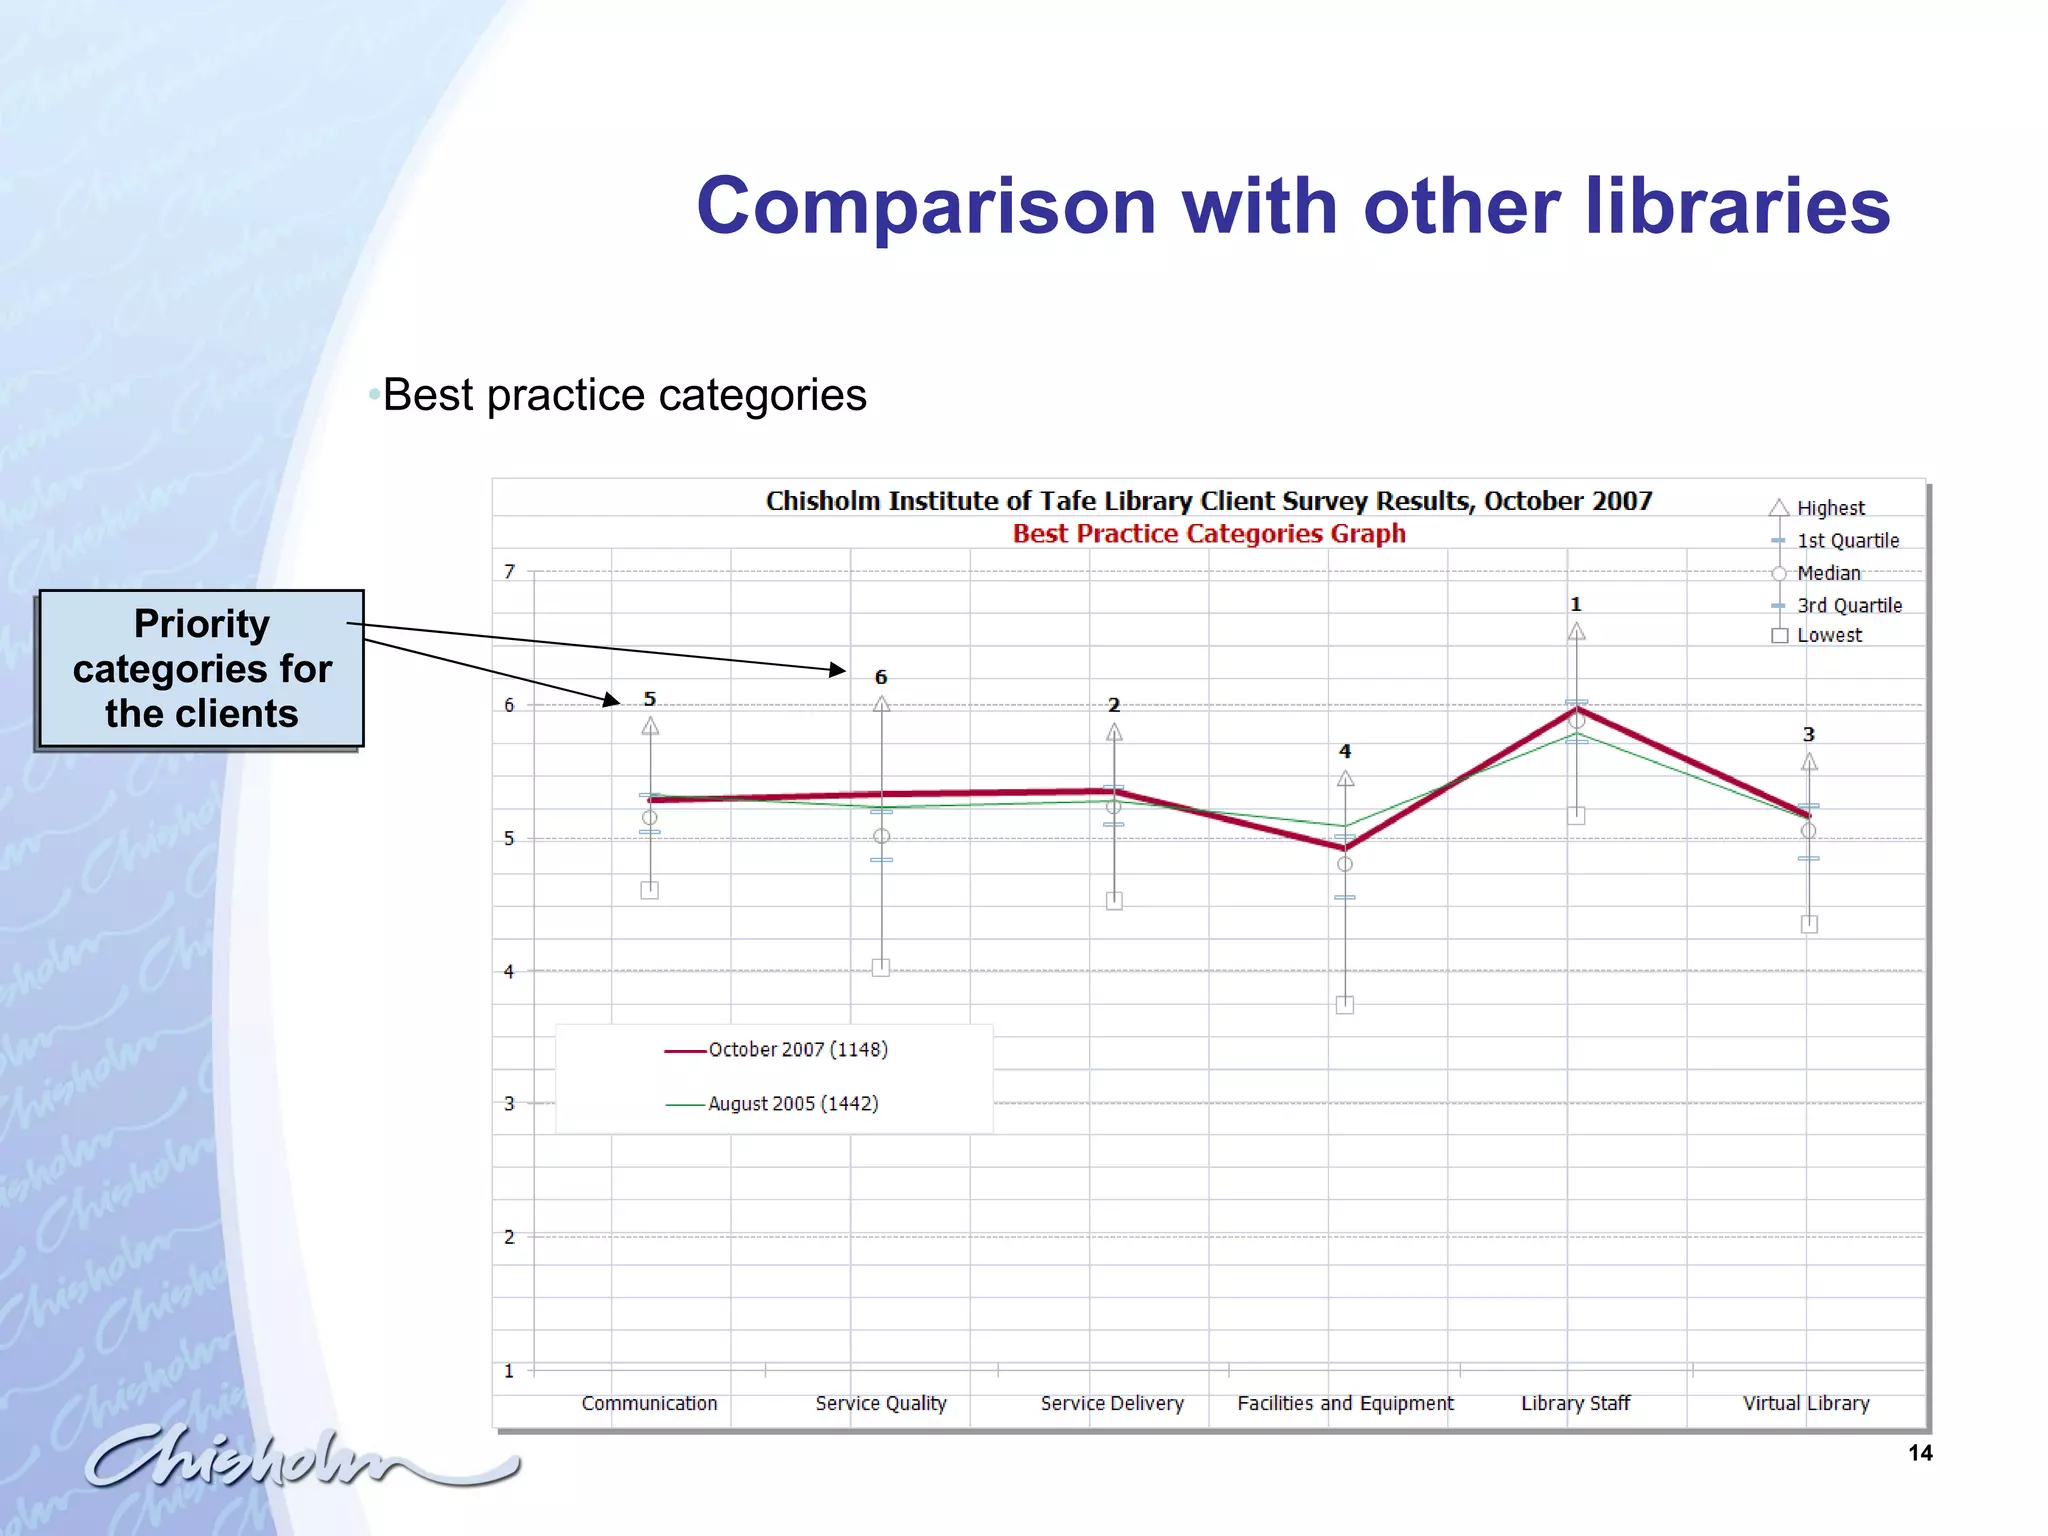
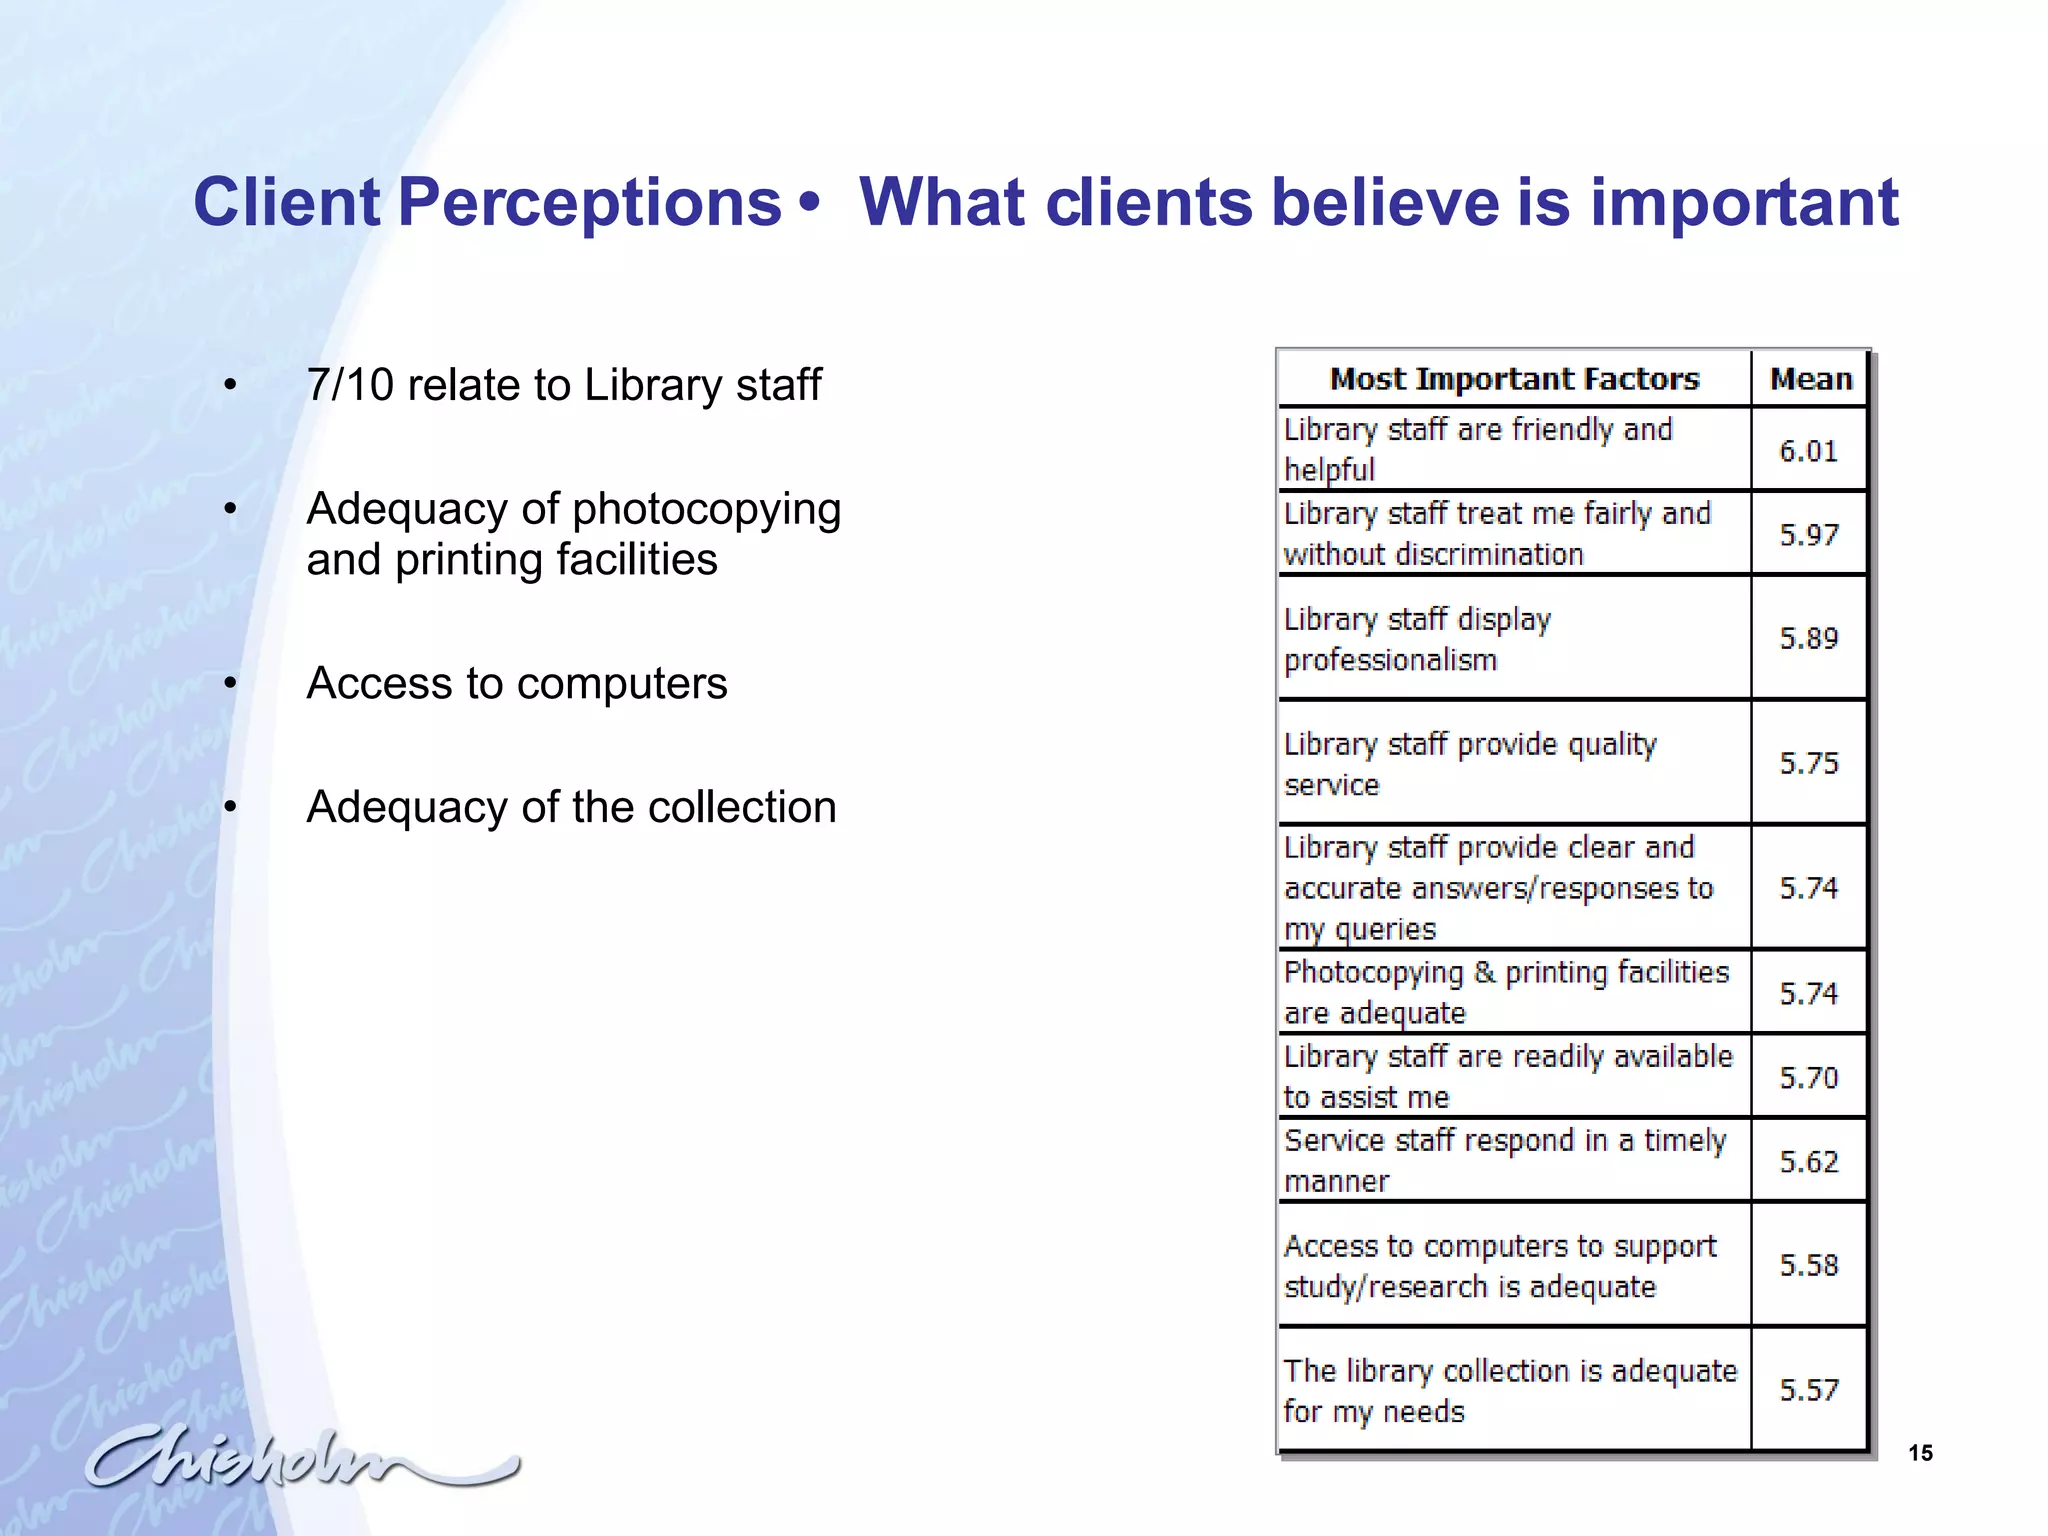
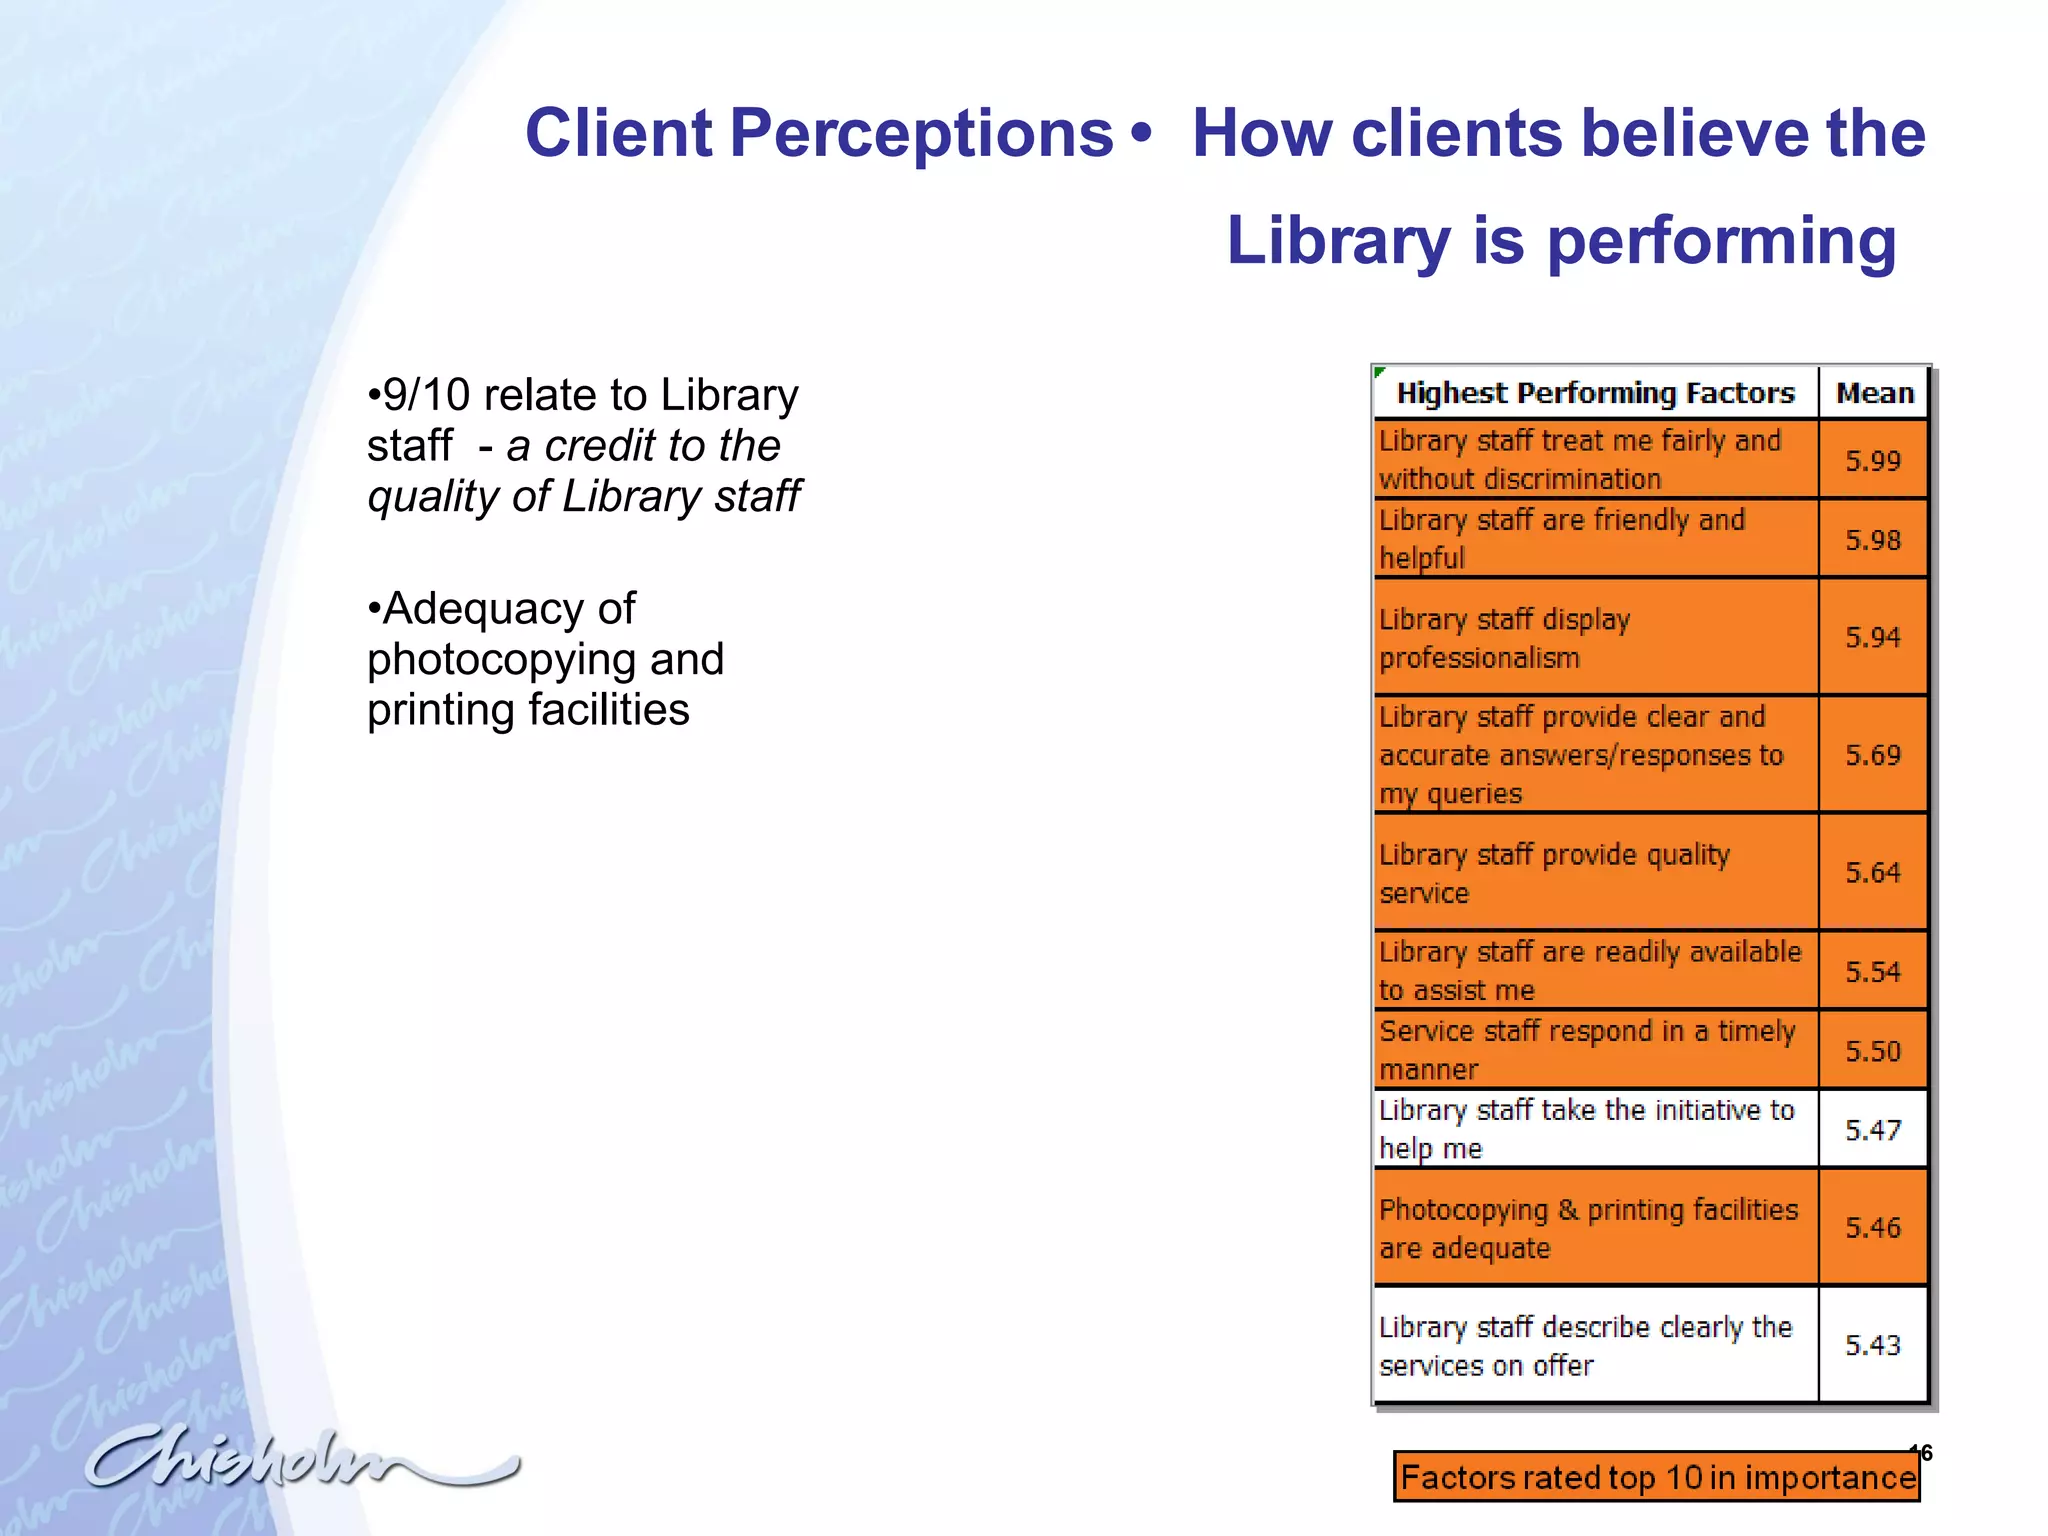
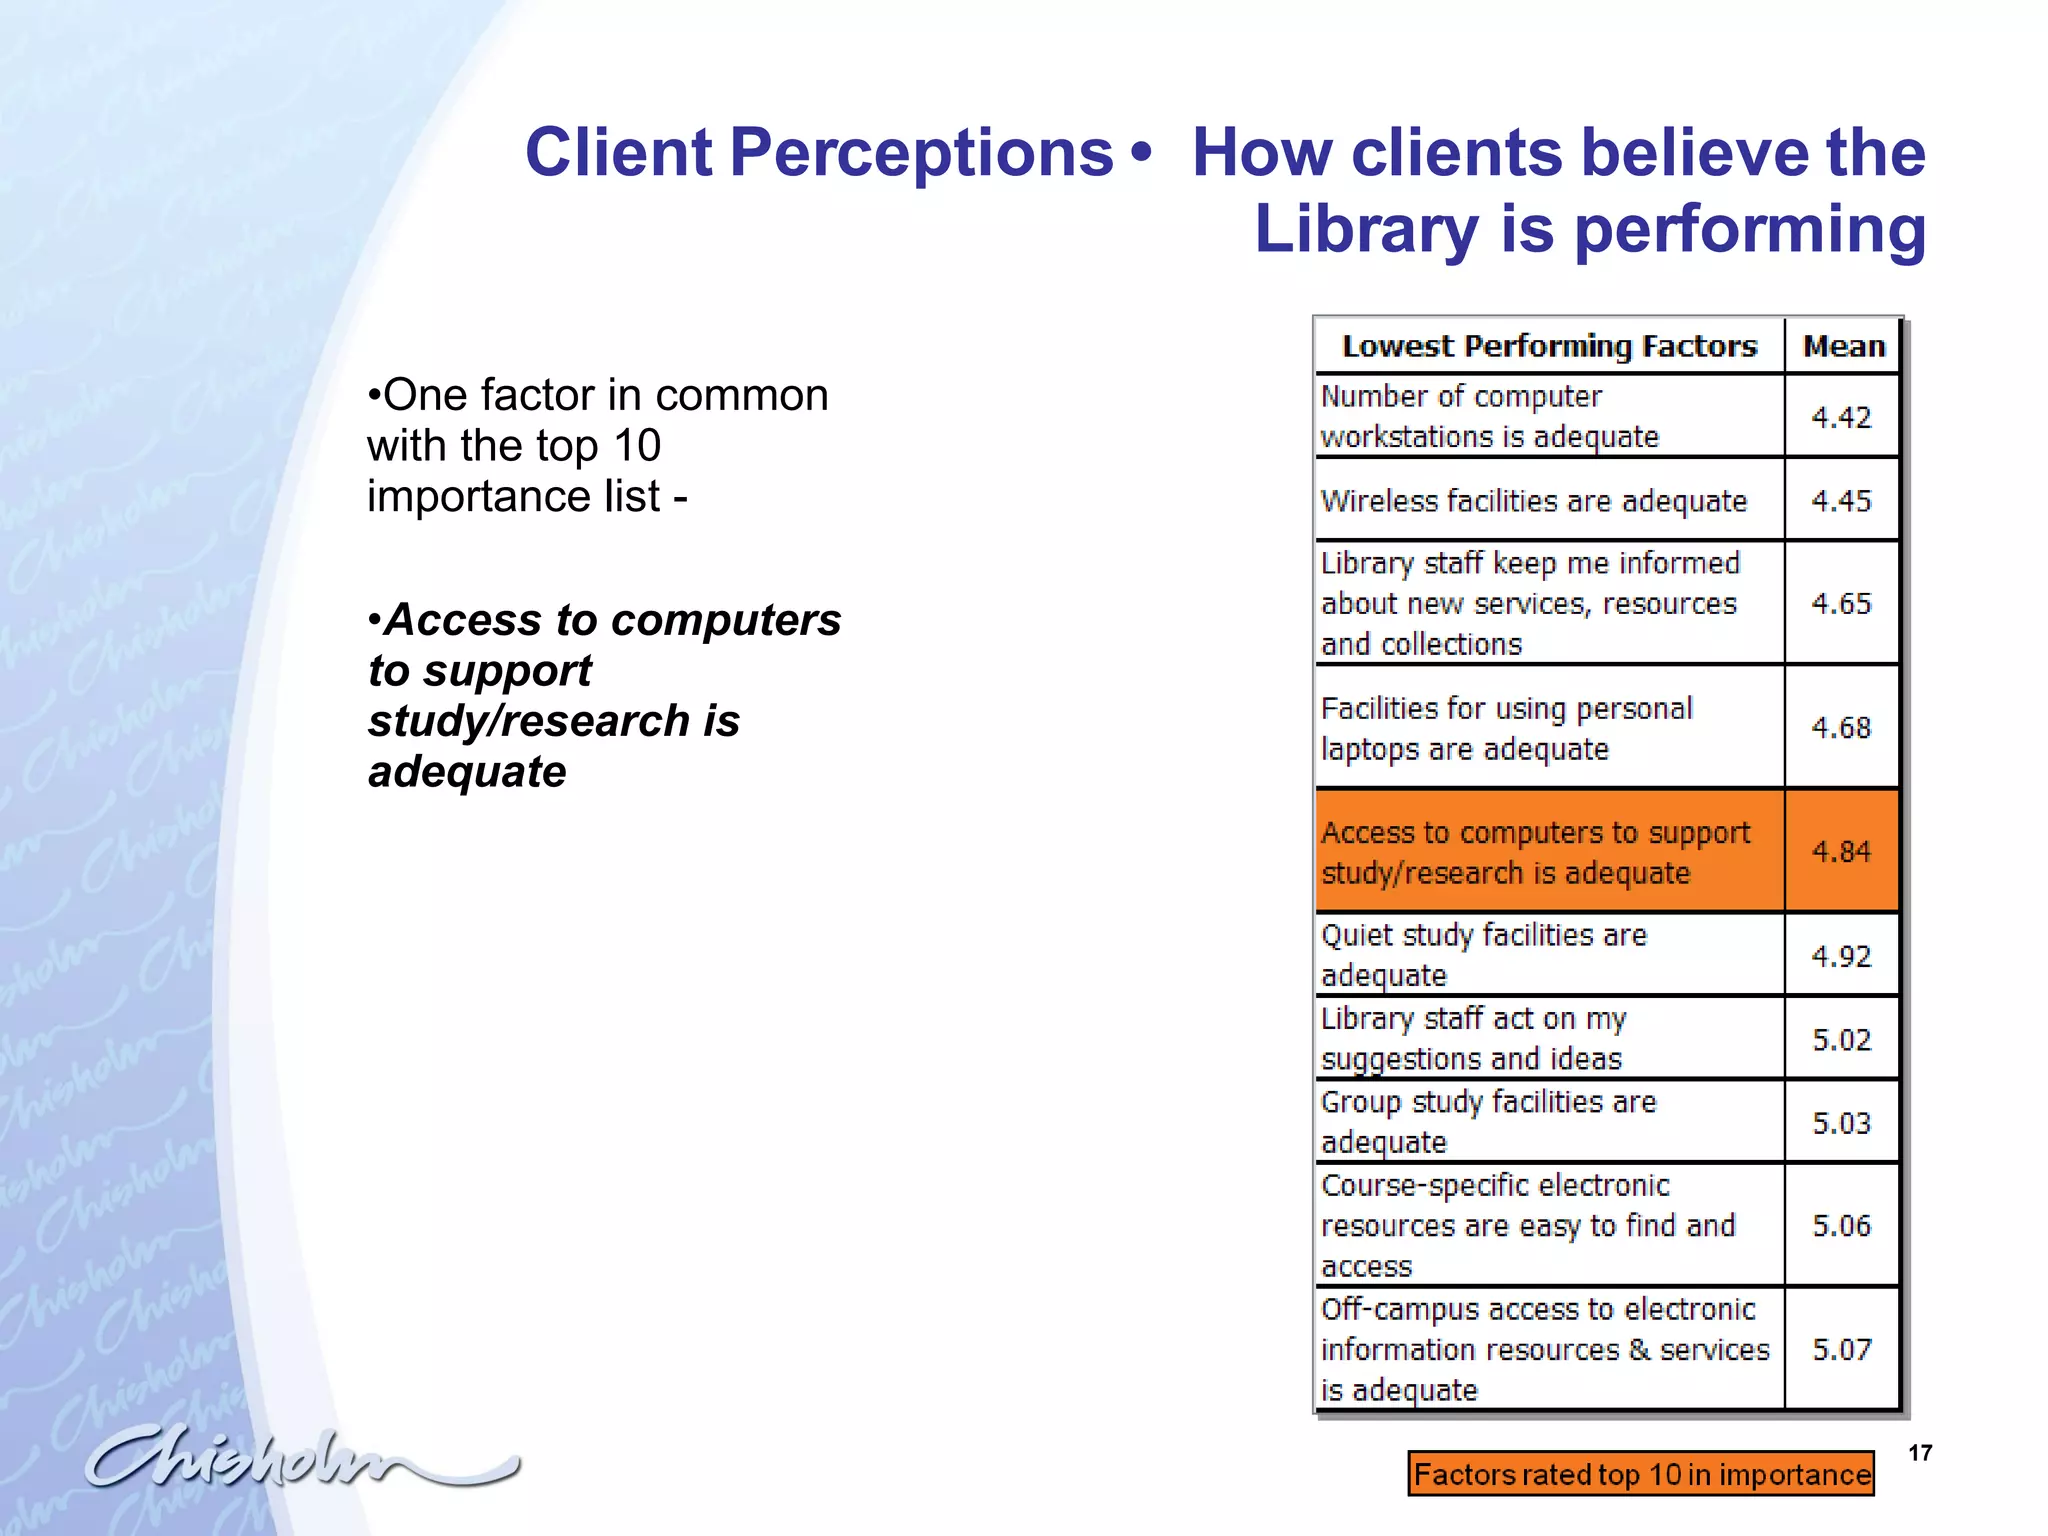
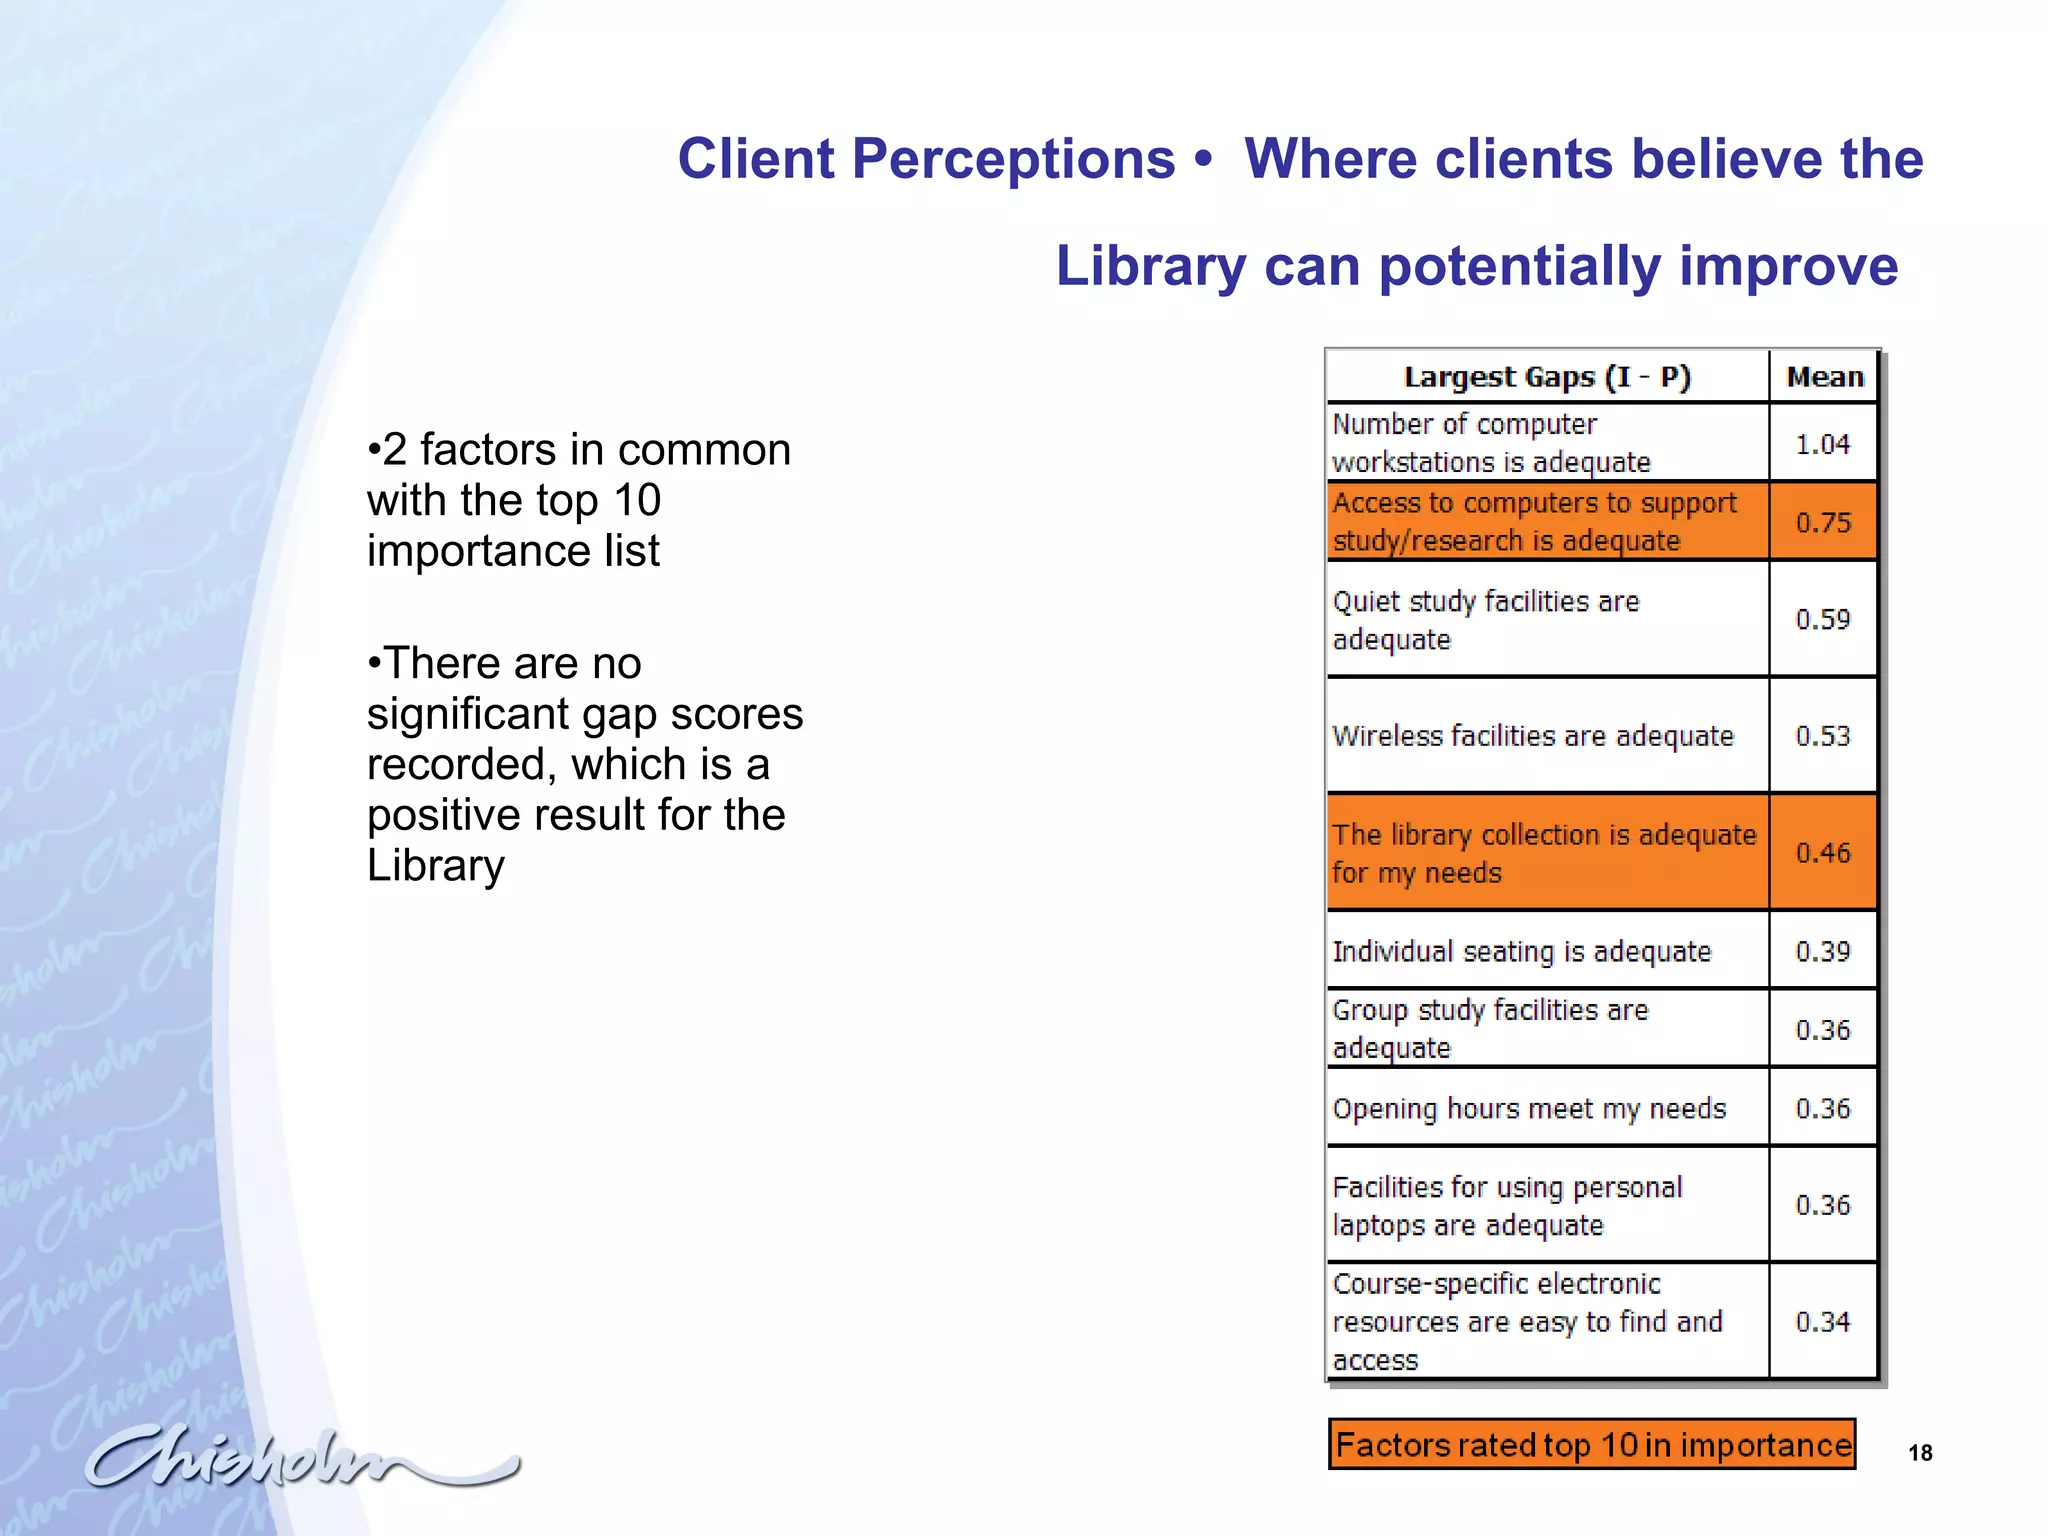
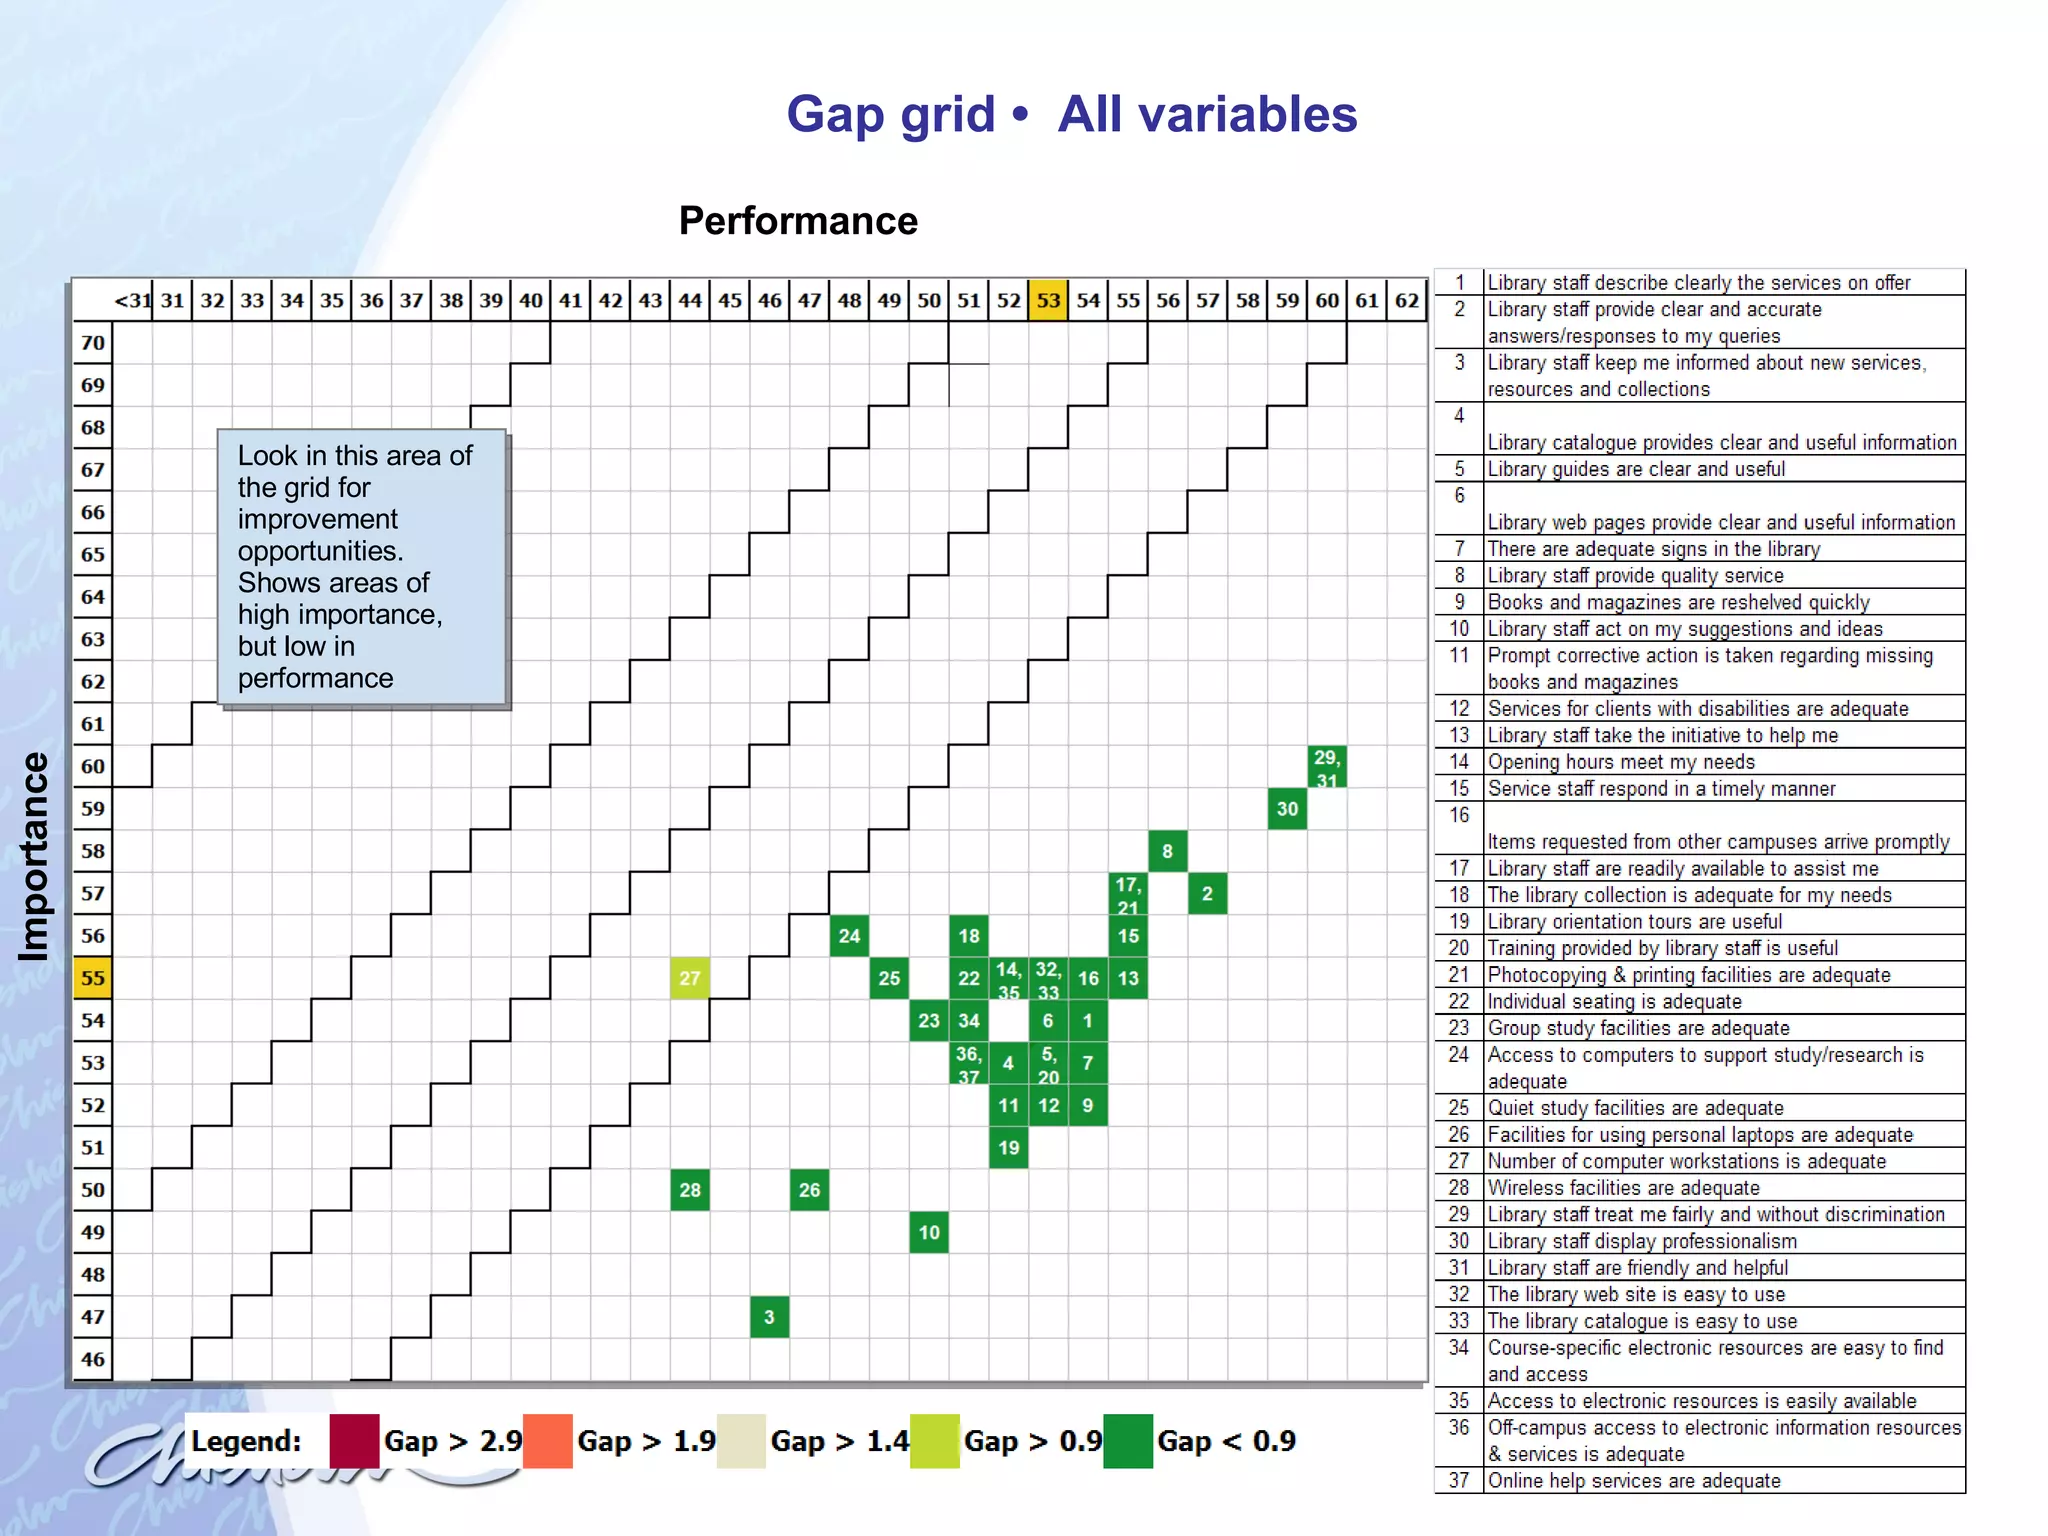
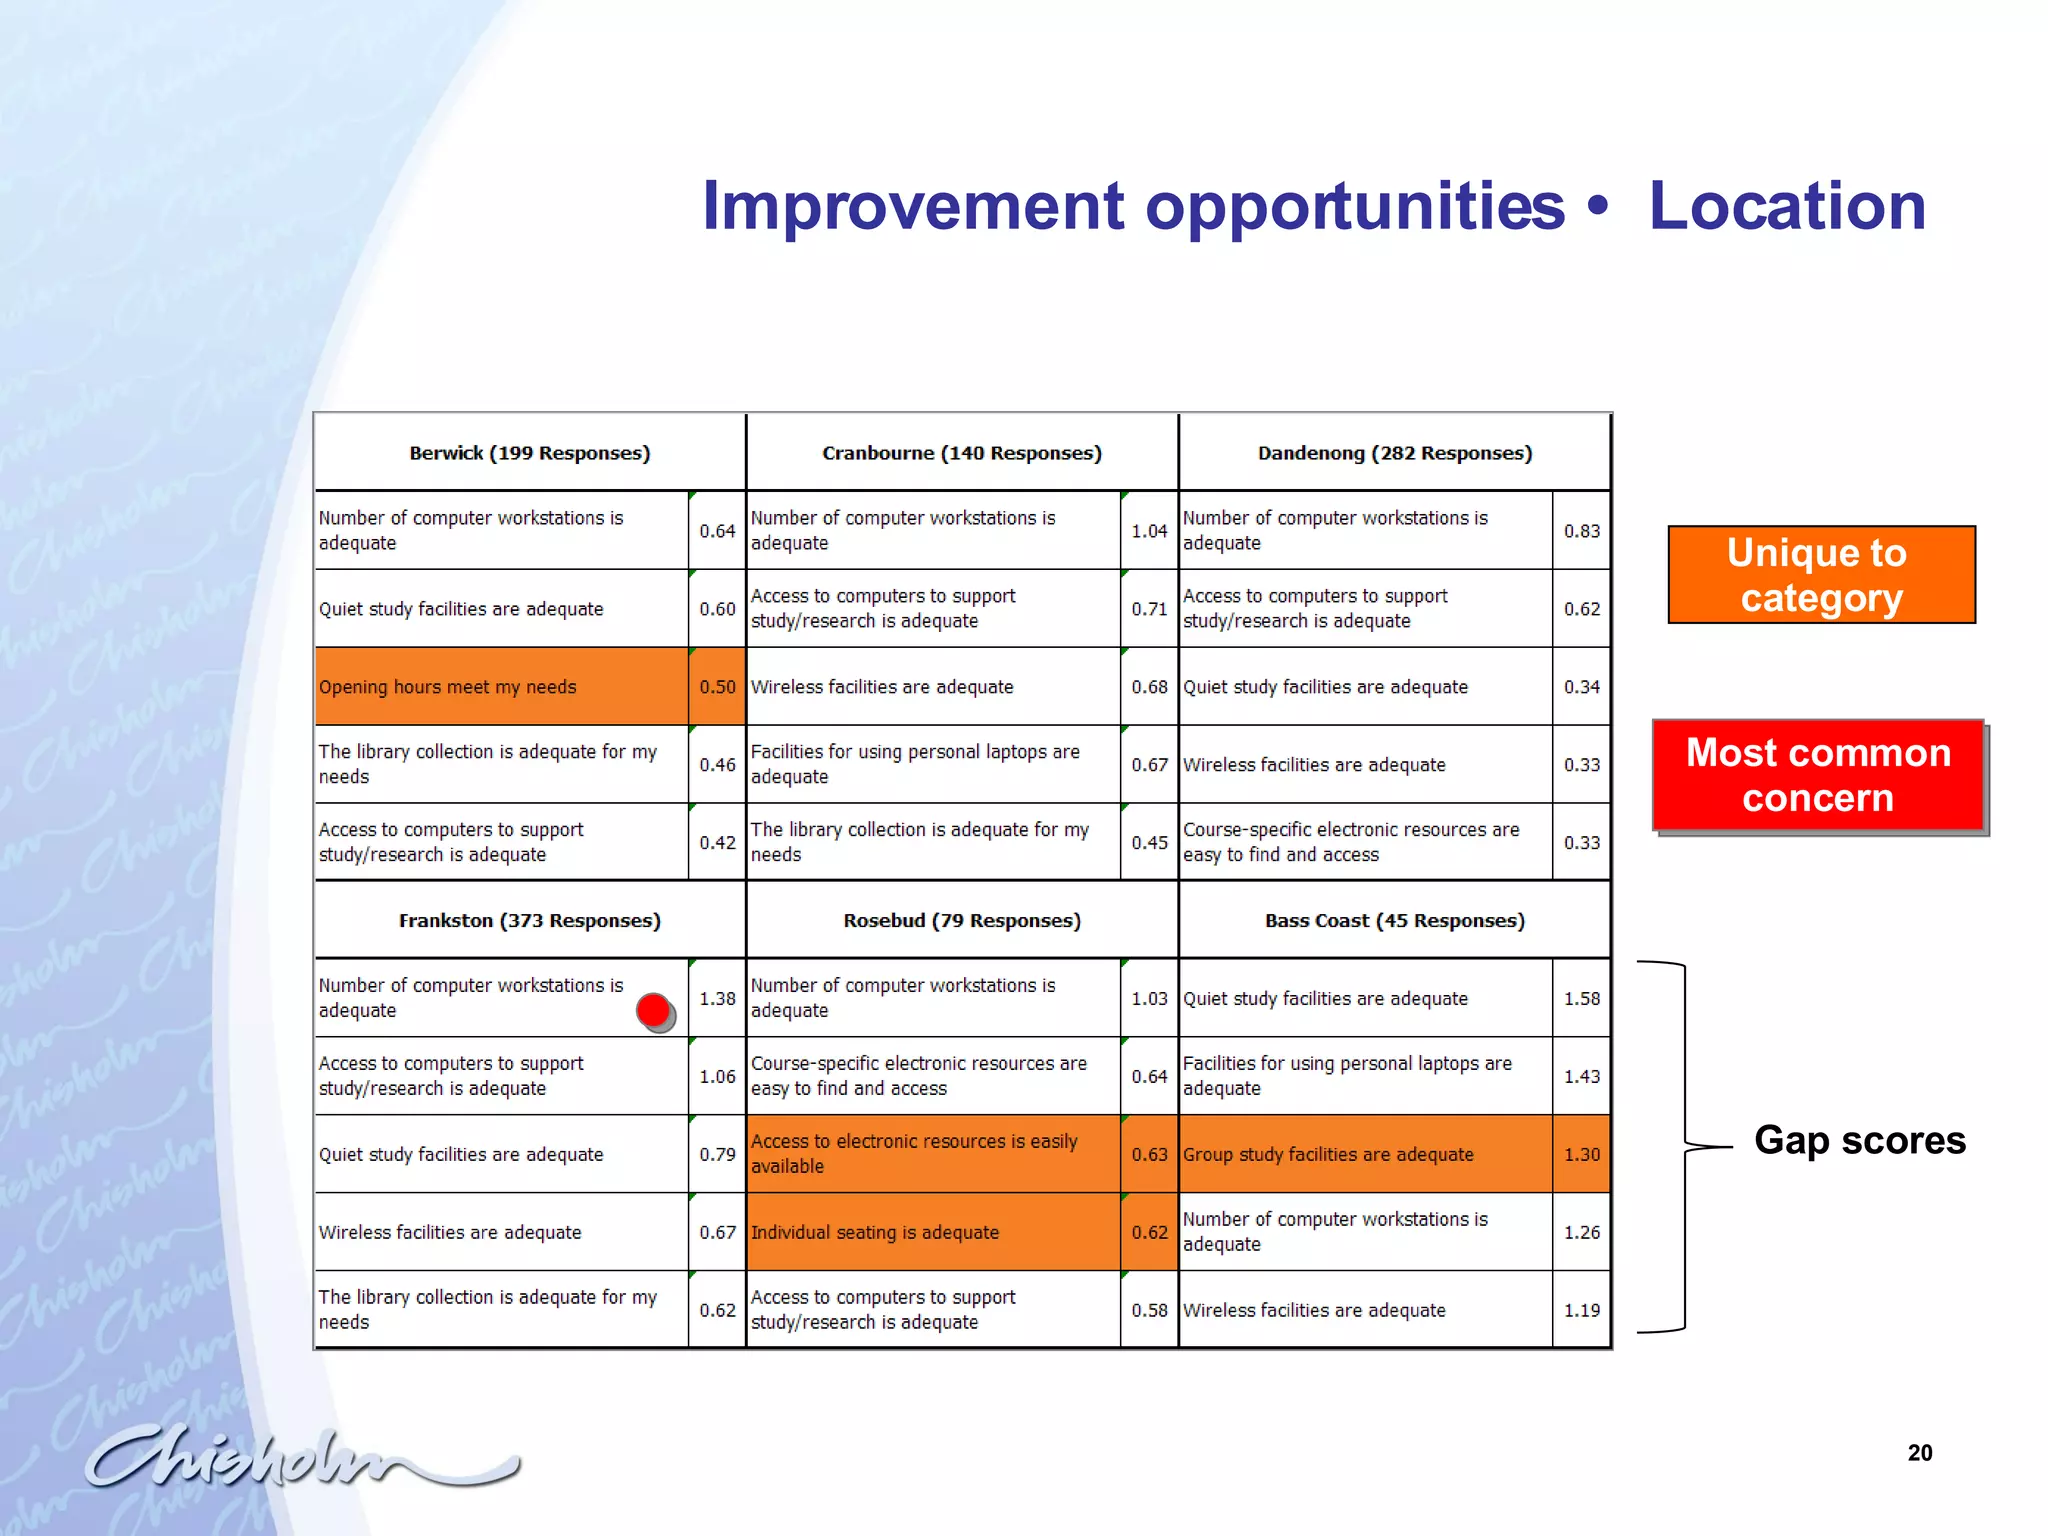
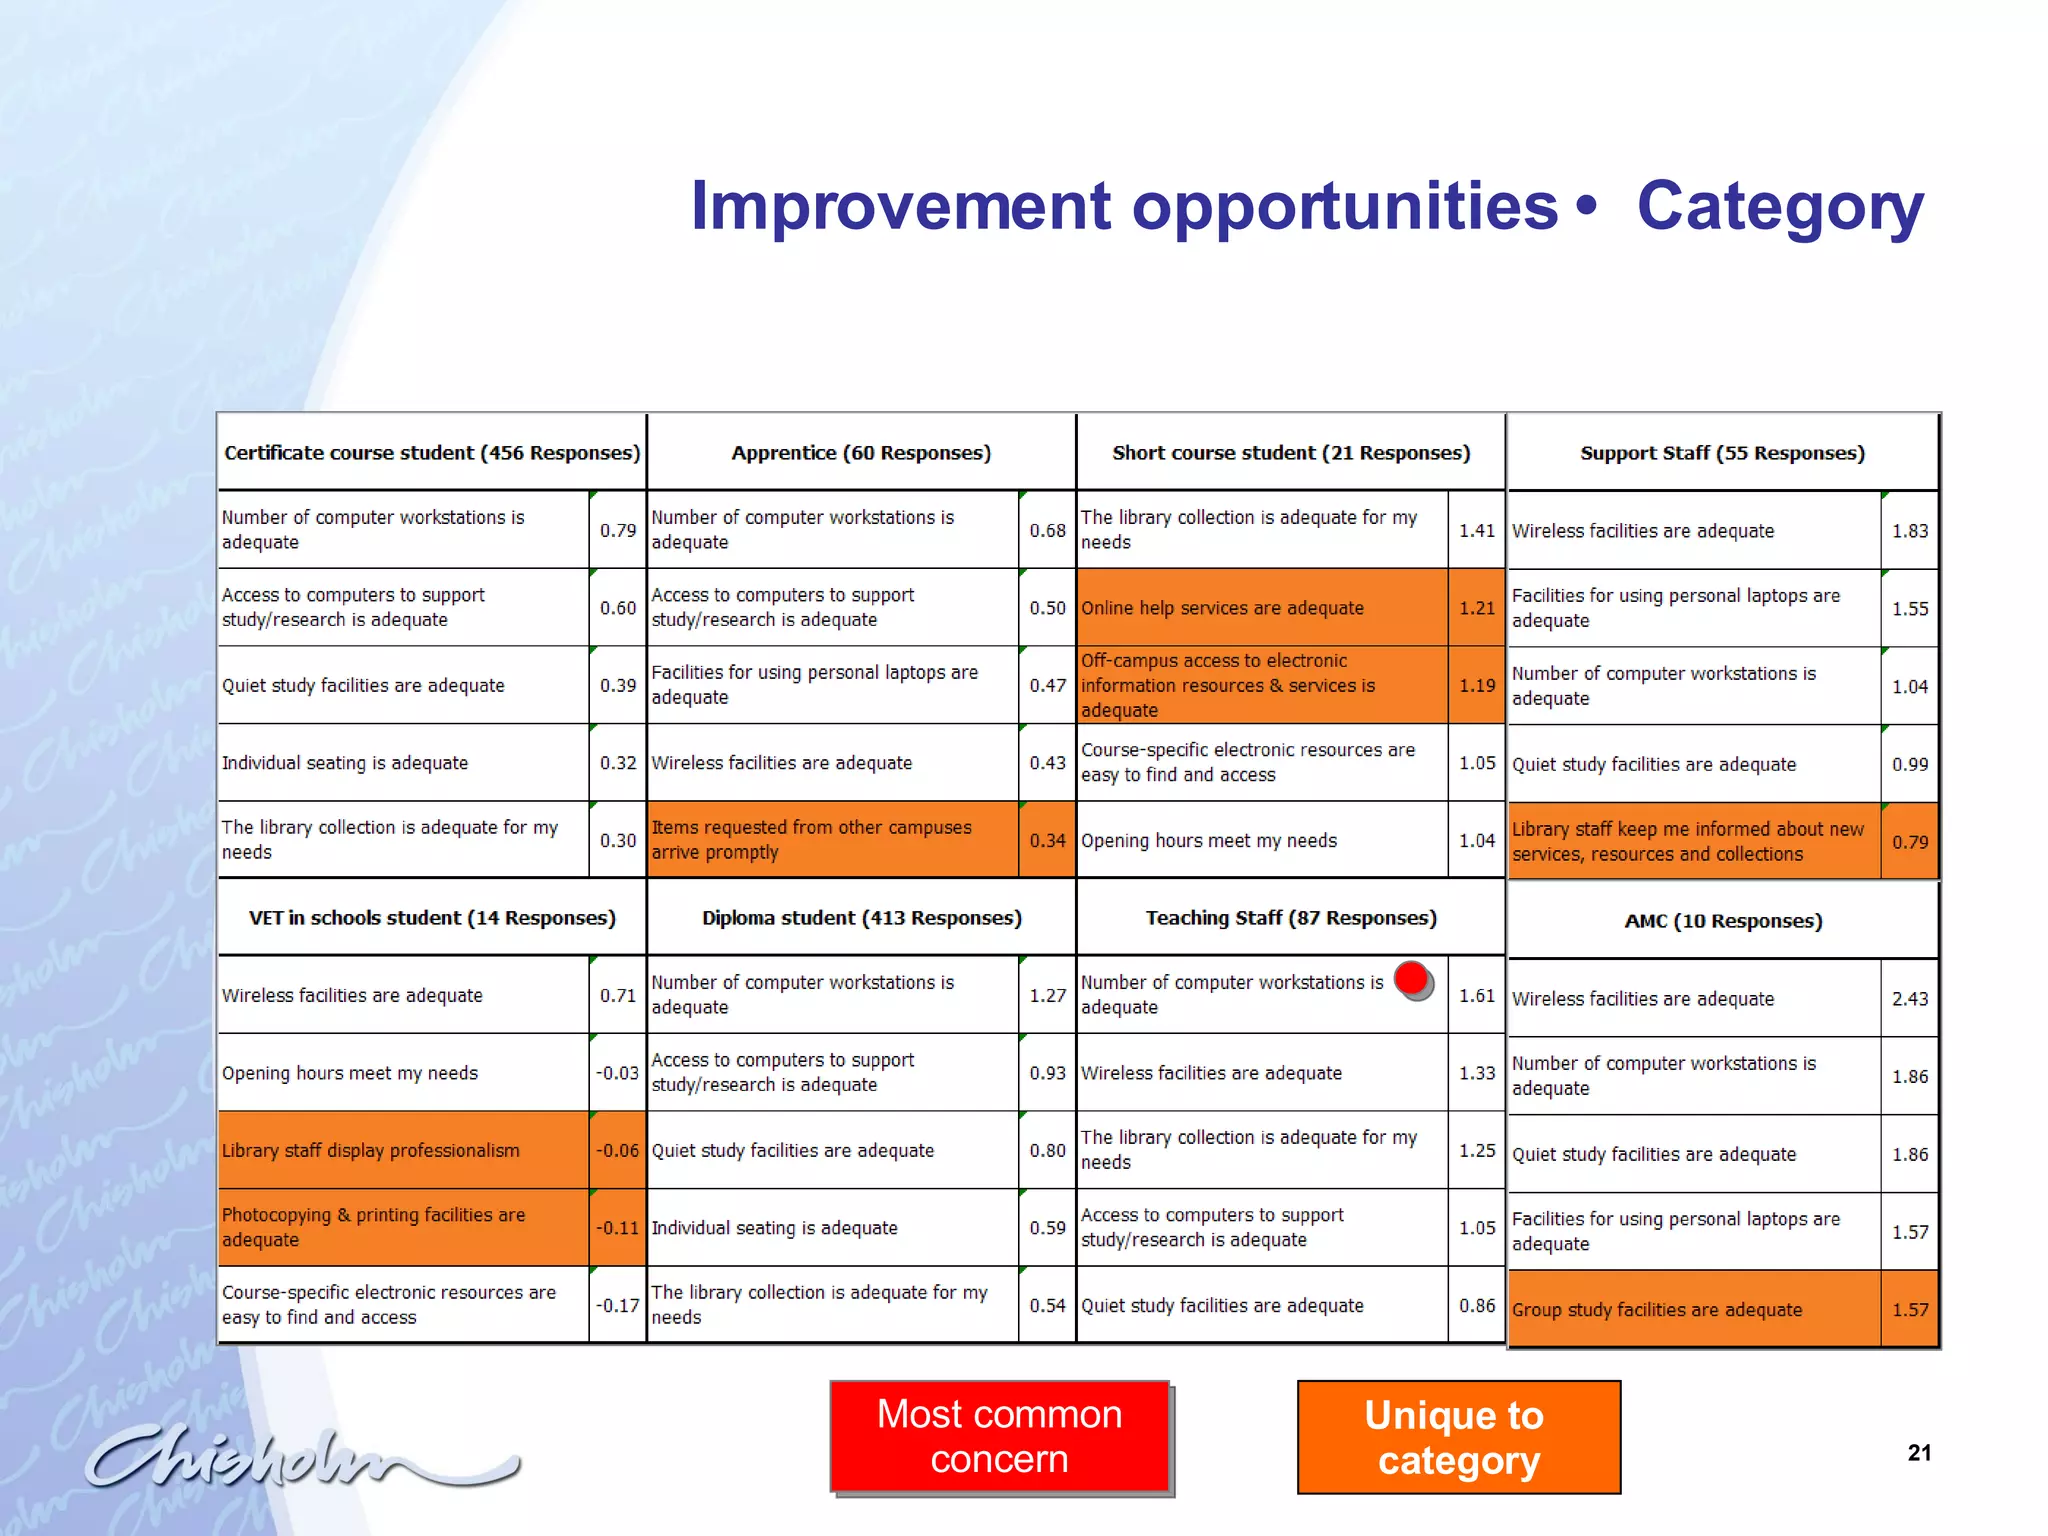
Library Client Survey 2007 Adrian Shaw  Manager Library and Information Management
Background Generally we run a survey to: to assess library service strengths and weaknesses;  to assess clients' perceptions of library services;  to assess different expectations and performance evaluations across client categories;
Background Why Insync? possible to compare our performance over time   Measure performance in comparison with other Australian university and TAFE institutes libraries  – benchmarking They do ALL the analysis
Background 2nd Insync Surveys Library Client Survey undertaken by Chisholm Institute of TAFE Library  Clients provided some demographic information Clients were asked to rate variables (statements)  on a scale of  1-7: the  importance  of each of the statements to them their impression of the Library’s  performance  on each statement
Methodology 37 Variables (statements)  – some unique,  considered critical to the continued success of the Library   Gap analysis methodology used to measure difference between mean importance and mean performance Gaps >2.0 are significant Analysis by campus, category, gender, frequency of visit
Response statistics  •  Location 1148 responses received – high degree of confidence in the results Frankston (32.5%) Dandenong (24.6%) Berwick (17.3%)
Response statistics  •  Category Certificate course student – best represented group (39.7%) Diploma student (35.9%)
Response statistics  •  Gender, Domestic/International Gender Female (61.1%) Male (37.1%)
Response statistics  •  Frequency of visits Library 2-4 days a week  (37.5%) Fortnightly  (19.8%) Rarely (19%) Online Rarely (48.3%) 2-4 days a week (20.6%)
Comparison with other libraries  •  Weighted Performance Index A top 25% performer
Comparison with other libraries  •  Weighted Performance Index Lowest performing category Highest performing category Comparison with highest, lowest and median performers in the database
Comparison with other libraries   General assessment of client satisfaction
Comparison with other libraries   Personal assessment of overall quality
Comparison with other libraries   Best practice categories Priority categories for the clients
Client Perceptions  •  What clients believe is important   7/10 relate to Library staff Adequacy of photocopying and printing facilities Access to computers Adequacy of the collection
Client Perceptions  •  How clients believe the Library is performing   9/10 relate to Library staff  -  a credit to the quality of Library staff Adequacy of photocopying and printing facilities
Client Perceptions  •  How clients believe the Library is performing One factor in common with the top 10 importance list -  Access to computers to support study/research is adequate
Client Perceptions  •  Where clients believe the Library can potentially improve   2 factors in common with the top 10 importance list  There are no significant gap scores recorded, which is a positive result for the Library
Look in this area of the grid for improvement opportunities.  Shows areas of high importance, but low in performance Gap grid •  All variables Performance Importance
Improvement opportunities  •  Location Gap scores Most common concern Unique to  category
Improvement opportunities  •  Category Most common concern Unique to  category
Improvement opportunities  •  Library visits Most common concerns Unique to  category
Improvement opportunities  •  Online visits Most common concerns Unique to  category
Improvement opportunities  •  Status Most common concerns Unique to  category
Improvement opportunities  •  Gender Shared concerns across both groups
Review  •  What clients believe is important Quality and professionalism of Library staff Adequacy of photocopying and printing facilities Access to computers Adequacy of the collection
Review  •  How clients believe the Library is performing performed highest on the category of  Library Staff According to library clients, seven out of ten of the highest performing variables relate to library staff  lowest score recorded was for  Facilities and Equipment   (but still performing above the median) Communication, Service Quality, Service Delivery  and  Virtual Library  are all above average performers
Review  •  Where clients believe the Library can potentially improve there are no gap scores of greater than 2.00, which is a positive result for the Library   The areas that need to be watched are: Access to computers to support study/research is adequate  – Importance (9), performance (33) The library collection is adequate for my needs  – Importance (10), performance (26)
Review  •  Recommendations   When prioritising issues for action, it is recommended that: a combination of the provided analyses verbatim comments  be used to gain a more in-depth understanding around what drives clients’ concerns

Library Client Survey 2007

  • 1.
    Library Client Survey2007 Adrian Shaw Manager Library and Information Management
  • 2.
    Background Generally werun a survey to: to assess library service strengths and weaknesses; to assess clients' perceptions of library services; to assess different expectations and performance evaluations across client categories;
  • 3.
    Background Why Insync?possible to compare our performance over time Measure performance in comparison with other Australian university and TAFE institutes libraries – benchmarking They do ALL the analysis
  • 4.
    Background 2nd InsyncSurveys Library Client Survey undertaken by Chisholm Institute of TAFE Library Clients provided some demographic information Clients were asked to rate variables (statements) on a scale of 1-7: the importance of each of the statements to them their impression of the Library’s performance on each statement
  • 5.
    Methodology 37 Variables(statements) – some unique, considered critical to the continued success of the Library Gap analysis methodology used to measure difference between mean importance and mean performance Gaps >2.0 are significant Analysis by campus, category, gender, frequency of visit
  • 6.
    Response statistics • Location 1148 responses received – high degree of confidence in the results Frankston (32.5%) Dandenong (24.6%) Berwick (17.3%)
  • 7.
    Response statistics • Category Certificate course student – best represented group (39.7%) Diploma student (35.9%)
  • 8.
    Response statistics • Gender, Domestic/International Gender Female (61.1%) Male (37.1%)
  • 9.
    Response statistics • Frequency of visits Library 2-4 days a week (37.5%) Fortnightly (19.8%) Rarely (19%) Online Rarely (48.3%) 2-4 days a week (20.6%)
  • 10.
    Comparison with otherlibraries • Weighted Performance Index A top 25% performer
  • 11.
    Comparison with otherlibraries • Weighted Performance Index Lowest performing category Highest performing category Comparison with highest, lowest and median performers in the database
  • 12.
    Comparison with otherlibraries General assessment of client satisfaction
  • 13.
    Comparison with otherlibraries Personal assessment of overall quality
  • 14.
    Comparison with otherlibraries Best practice categories Priority categories for the clients
  • 15.
    Client Perceptions • What clients believe is important 7/10 relate to Library staff Adequacy of photocopying and printing facilities Access to computers Adequacy of the collection
  • 16.
    Client Perceptions • How clients believe the Library is performing 9/10 relate to Library staff - a credit to the quality of Library staff Adequacy of photocopying and printing facilities
  • 17.
    Client Perceptions • How clients believe the Library is performing One factor in common with the top 10 importance list - Access to computers to support study/research is adequate
  • 18.
    Client Perceptions • Where clients believe the Library can potentially improve 2 factors in common with the top 10 importance list There are no significant gap scores recorded, which is a positive result for the Library
  • 19.
    Look in thisarea of the grid for improvement opportunities. Shows areas of high importance, but low in performance Gap grid • All variables Performance Importance
  • 20.
    Improvement opportunities • Location Gap scores Most common concern Unique to category
  • 21.
    Improvement opportunities • Category Most common concern Unique to category
  • 22.
    Improvement opportunities • Library visits Most common concerns Unique to category
  • 23.
    Improvement opportunities • Online visits Most common concerns Unique to category
  • 24.
    Improvement opportunities • Status Most common concerns Unique to category
  • 25.
    Improvement opportunities • Gender Shared concerns across both groups
  • 26.
    Review • What clients believe is important Quality and professionalism of Library staff Adequacy of photocopying and printing facilities Access to computers Adequacy of the collection
  • 27.
    Review • How clients believe the Library is performing performed highest on the category of Library Staff According to library clients, seven out of ten of the highest performing variables relate to library staff lowest score recorded was for Facilities and Equipment (but still performing above the median) Communication, Service Quality, Service Delivery and Virtual Library are all above average performers
  • 28.
    Review • Where clients believe the Library can potentially improve there are no gap scores of greater than 2.00, which is a positive result for the Library The areas that need to be watched are: Access to computers to support study/research is adequate – Importance (9), performance (33) The library collection is adequate for my needs – Importance (10), performance (26)
  • 29.
    Review • Recommendations When prioritising issues for action, it is recommended that: a combination of the provided analyses verbatim comments be used to gain a more in-depth understanding around what drives clients’ concerns