Download as PDF, PPTX

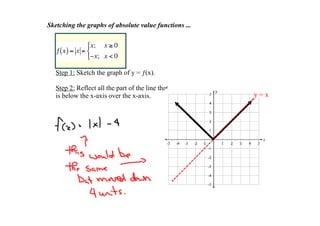
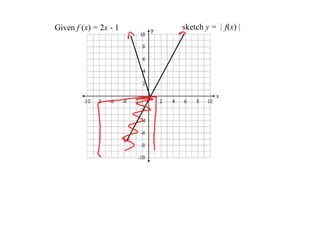
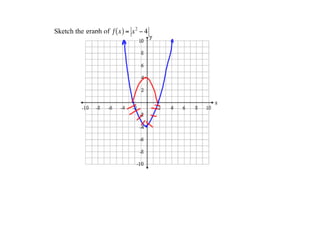
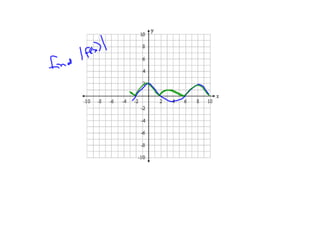
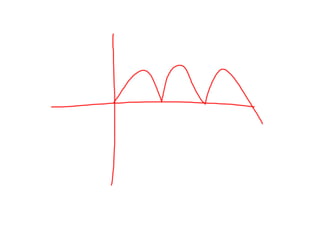
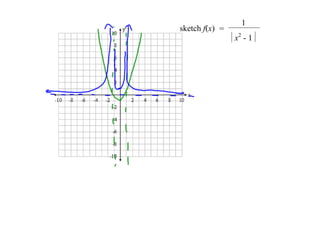
This document provides steps for sketching the graphs of absolute value functions: sketch the underlying function first, then reflect any parts below the x-axis over the x-axis to obtain the absolute value graph. It also gives two examples - sketching y = 2x - 1 and y = (x^2 - 1)^(1/2) - and directs the reader to an exercise involving sketching another absolute value function graph.


