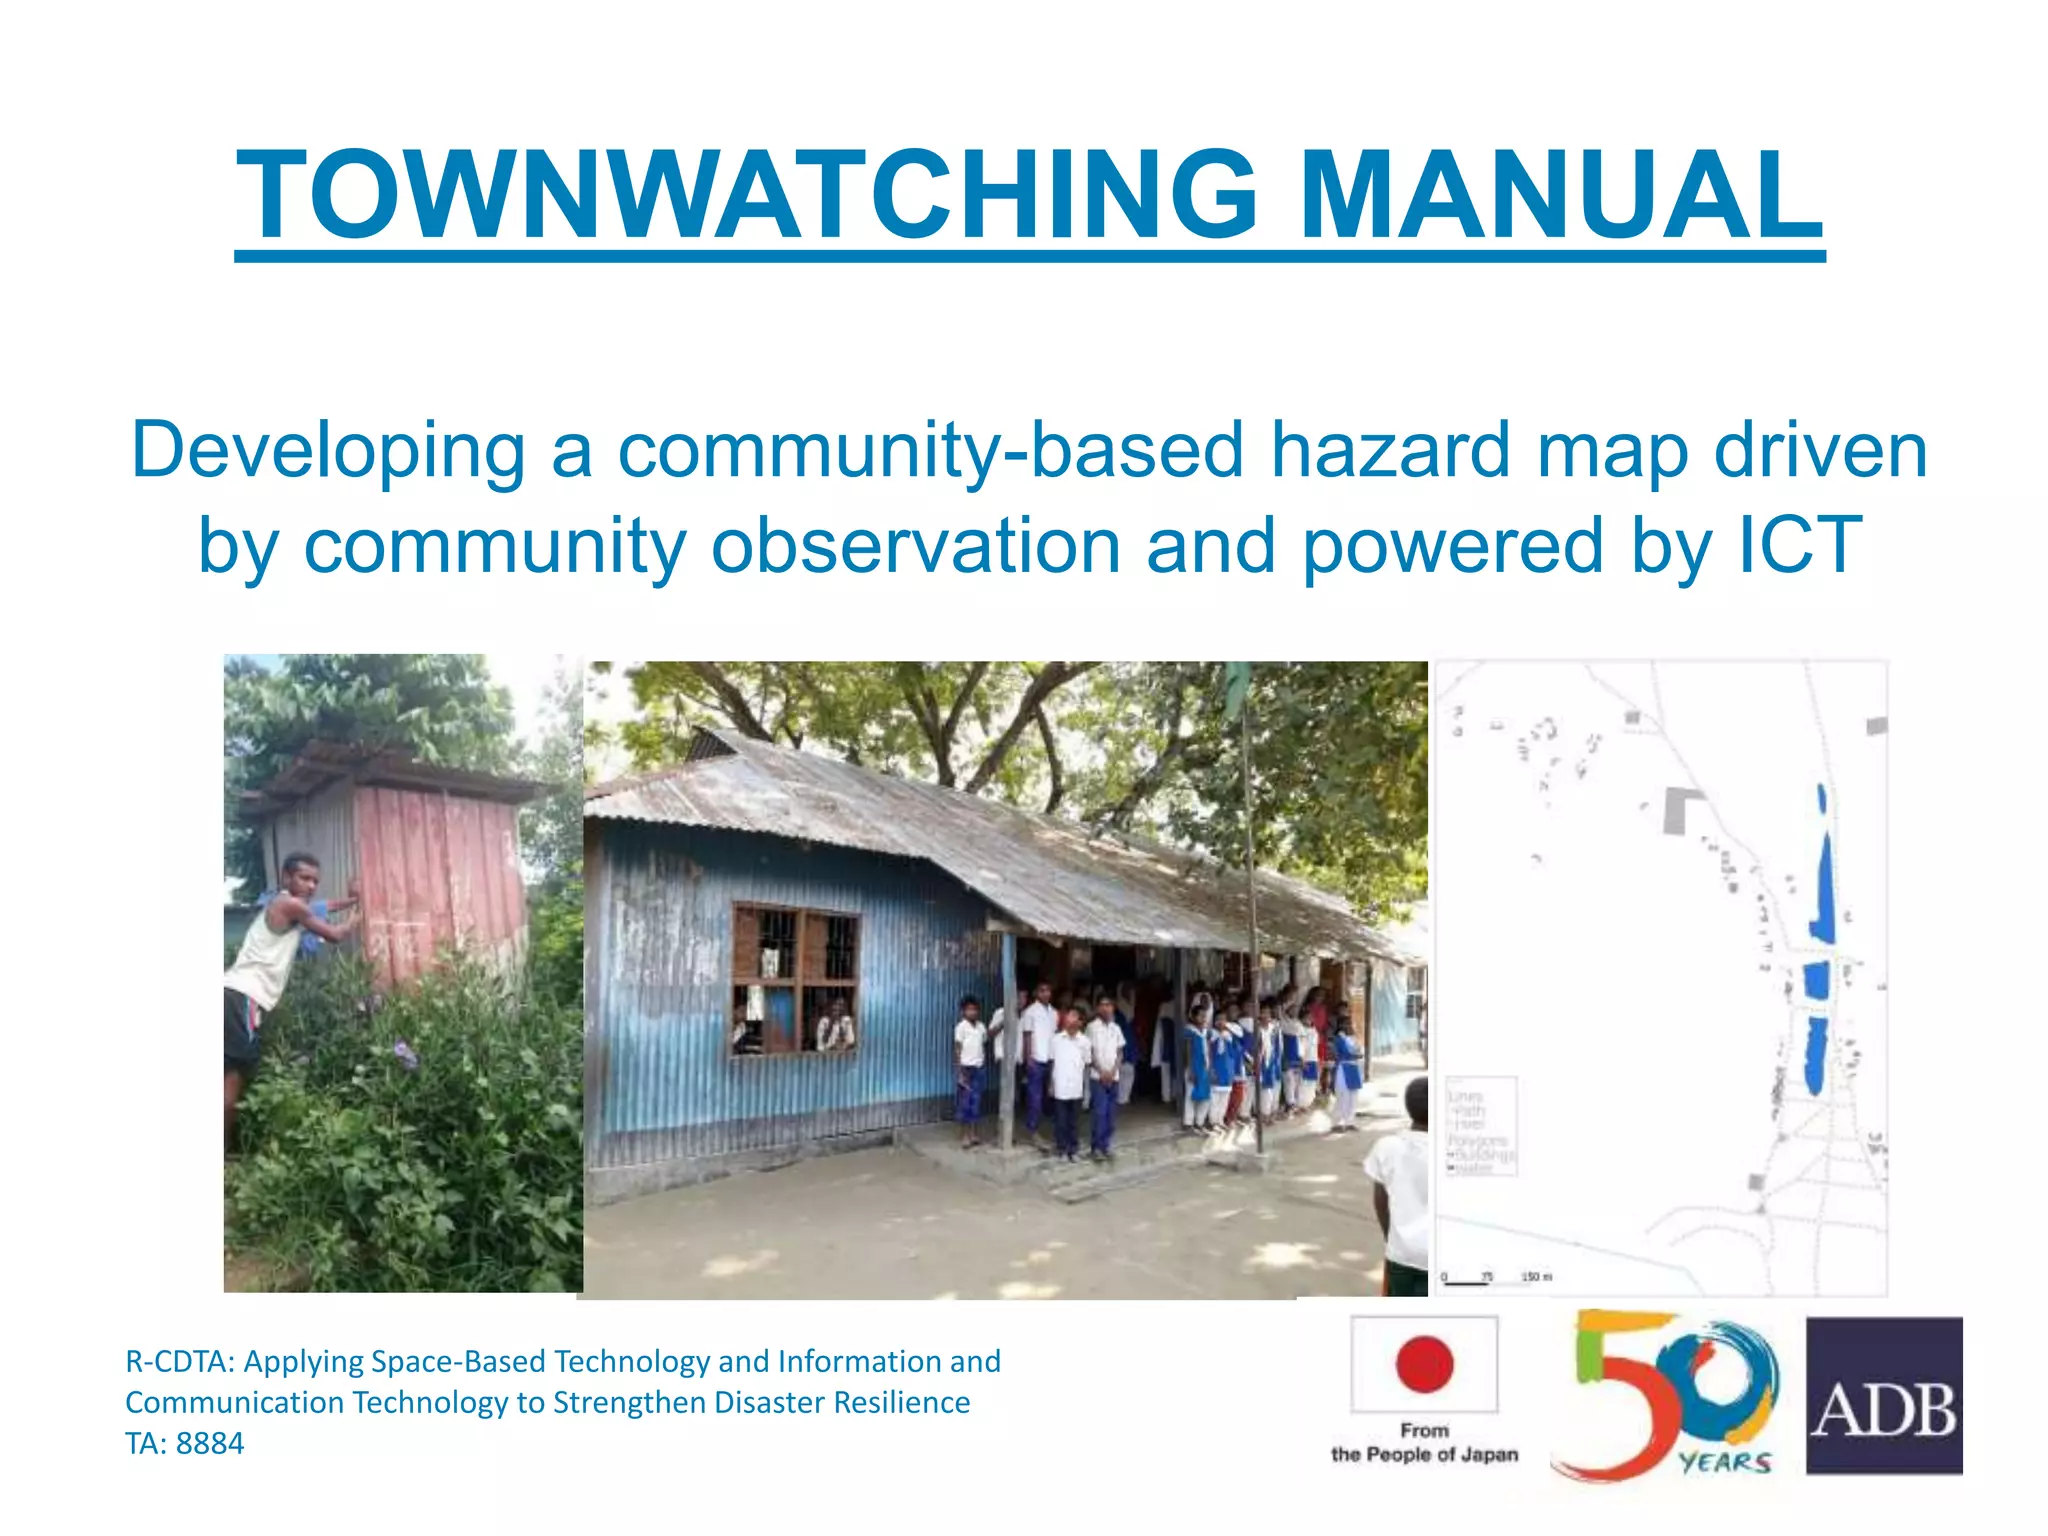
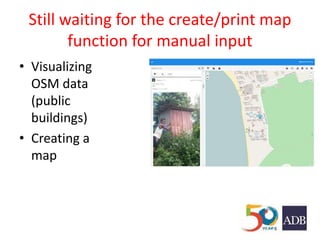
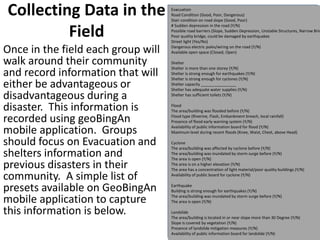
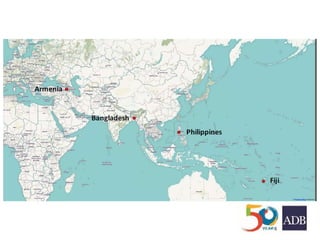
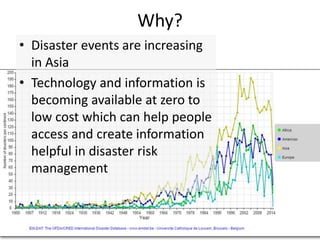
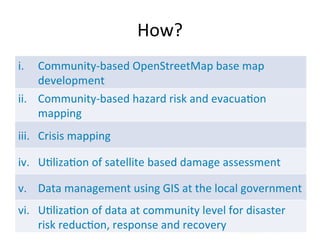
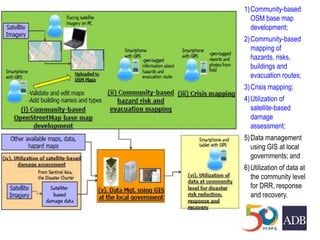
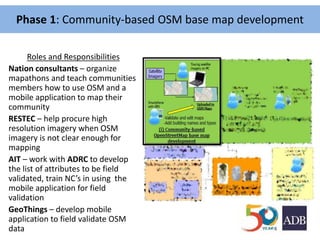
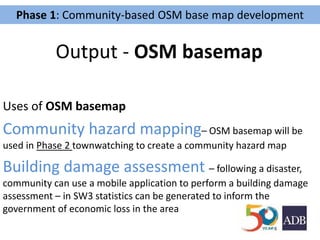
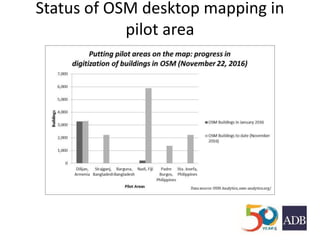
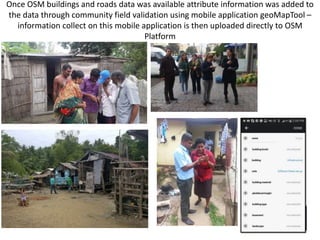
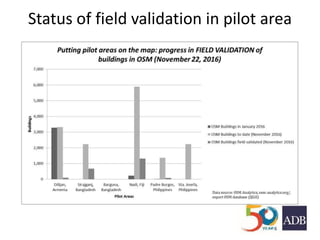
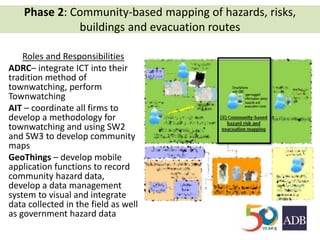
TOWNWATCHING MANUAL
Developing a community-based hazard map driven
by community observation and powered by ICT
R-CDTA: Applying Space-Based Technology and Information and
Communication Technology to Strengthen Disaster Resilience
TA: 8884
Installation/Registration of geoBingAn
• Download from playstore
• Register with email address and a password of your
choosing
• Check your email for approval
• Follow email instructions
Membership of geoBingAn for
townwatching
• Download from playstore
• Register with email address and a password of your
choosing
• Check your email for approval
• Follow email instructions
Prepare Materials
• In geoBingAn.info use the OSM
basemap to create a paper
map of the area extent of your
townwatching activity
• The paper map should
highlight the following:
all public buildings such as:
schools, shelters, hospitals,
police and fire stations
All OSM buildings
All roads, paths, waterways and
open space
Still waiting for the create/print map
function for manual input
• Visualizing
OSM data
(public
buildings)
• Creating a
map
Creating Groups
• Groups should be composed of a
heterogeneous mix of stakeholders and not
exceed more than 7 people;
• Each group should have one disaster
management expert
Still waiting for the administrator
function so members can have tw
function on their mobile phone
What is townwatching?
Townwatching is a process to prepare a community-
based hazard map for disaster reduction through
community-based observation. A hazard map
provides graphic information on potential natural
hazards and evacuation matters.
Community based hazard mapping has 3 key objectives:
a) involve local residents in developing the hazard map for their community
b) reflect the opinions of local residents in policies made by their local government,
and
c) foster common understanding of risks among local residents, government officials
and experts
Collecting Data in the
Field
Once in the field each group will
walk around their community
and record information that will
either be advantageous or
disadvantageous during a
disaster. This information is
recorded using geoBingAn
mobile application. Groups
should focus on Evacuation and
shelters information and
previous disasters in their
community. A simple list of
presets available on GeoBingAn
mobile application to capture
this information is below.
Evacuation
Road Condition (Good, Poor, Dangerous)
Stair condition on road slope (Good, Poor)
# Sudden depression in the road (Y/N)
Possible road barriers (Slope, Sudden Depression, Unstable Structures, Narrow Brid
Poor quality bridge, could be damaged by earthquakes
Street light (Yes/No)
Dangerous electric poles/wiring on the road (Y/N)
Available open space (Closed, Open)
Shelter
Shelter is more than one storey (Y/N)
Shelter is strong enough for earthquakes (Y/N)
Shelter is strong enough for cyclones (Y/N)
Shelter capacity ________________
Shelter has adequate water supplies (Y/N)
Shelter has sufficient toilets (Y/N)
Flood
The area/building was flooded before (Y/N)
Flood type (Riverine, Flash, Embankment breach, local rainfall)
Presence of flood early warning system (Y/N)
Availability of public information board for flood (Y/N)
Maximum level during recent floods (Knee, Waist, Chest, above Head)
Cyclone
The area/building was affected by cyclone before (Y/N)
The area/building was inundated by storm surge before (Y/N)
The area is open (Y/N)
The area is on a higher elevation (Y/N)
The area has a concentration of light material/poor quality buildings (Y/N)
Availability of public board for cyclone (Y/N)
Earthquake
Building is strong enough for earthquakes (Y/N)
The area/building was inundated by storm surge before (Y/N)
The area is open (Y/N)
Landslide
The area/building is located in or near slope more than 30 Degree (Y/N)
Slope is covered by vegetation (Y/N)
Presence of landslide mitigation measures (Y/N)
Availability of public information board for landslide (Y/N)
Advantageous or Disadvantageous
Advantageous/Capacities
 things that will increase
community’s resilience to
disaster
 signage informing the
public about disaster or
hazards in the area
 weather station
 shelter
Disadvantageous/Vulnerabilities
 previous disaster has
occurred
 high water marks or the
extent of a storm surge
 poor quality
infrastructure
 areas likely to be
affected by future
hazards
Shelter
• Draw small polygons around shelters
Evacuation route
• Evacuation route criteria:
Routes should avoid hazard polygons
Evacuation routes should start at an highly
dense area and link people to shelters
Why?
• Disaster events are increasing
in Asia
• Technology and information is
becoming available at zero to
low cost which can help people
access and create information
helpful in disaster risk
management
How?
Organizations Involved
• To be developed
1)Community-based
OSM base map
development;
2)Community-based
mapping of
hazards, risks,
buildings and
evacuation routes;
3)Crisis mapping;
4)Utilization of
satellite-based
damage
assessment;
5)Data management
using GIS at local
governments; and
6)Utilization of data at
the community level
for DRR, response
and recovery.
Phase 1: Community-based OSM base map development
Roles and Responsibilities
Nation consultants – organize
mapathons and teach communities
members how to use OSM and a
mobile application to map their
community
RESTEC – help procure high
resolution imagery when OSM
imagery is not clear enough for
mapping
AIT – work with ADRC to develop
the list of attributes to be field
validated, train NC’s in using the
mobile application for field
validation
GeoThings – develop mobile
application to field validate OSM
data
Phase 1: Community-based OSM base map development
Output - OSM basemap
Uses of OSM basemap
Community hazard mapping– OSM basemap will be
used in Phase 2 townwatching to create a community hazard map
Building damage assessment – following a disaster,
community can use a mobile application to perform a building damage
assessment – in SW3 statistics can be generated to inform the
government of economic loss in the area
Status of OSM desktop mapping in
pilot area
Once OSM buildings and roads data was available attribute information was added to
the data through community field validation using mobile application geoMapTool –
information collect on this mobile application is then uploaded directly to OSM
Platform
Status of field validation in pilot area
Phase 2: Community-based mapping of hazards, risks,
buildings and evacuation routes
Roles and Responsibilities
ADRC– integrate ICT into their
tradition method of
townwatching, perform
Townwatching
AIT – coordinate all firms to
develop a methodology for
townwatching and using SW2
and SW3 to develop community
maps
GeoThings – develop mobile
application functions to record
community hazard data,
develop a data management
system to visual and integrate
data collected in the field as well
as government hazard data
Output – Community hazard map
Uses of Community hazard map
Demonstration drill– the hazard map will help build the
scenario for the demonstration drill, ex. where will be the movement of
people, what are areas where people will go for shelter
Phase 2: Community-based mapping of hazards, risks,
buildings and evacuation routes
Building community hazard and evacuation maps combines field validated OSM data,
community hazard data collected through mobile applications in software 3
Phase 3: Demonstration drill; Crisis Mapping; establish ICT
Infrastructure
Roles and Responsibilities
ADRC– organize evacuation
drill, check coordination
mechanism
AIT – support drill, train NCs
in mobile application, ensure
data quality, assist
government in using satellite
imagery following disaster
GeoThings – develop mobile
application for crisis mapping
and building damage
assessment, assistant the NC
in setting up the ICT
infrastructure
Output – System test report
Uses of System test report
Policy discussion– the system test report will be the guiding
document to lead policy discussions and develop recommendations to
improve the ability community resilience
Phase 3: Demonstration drill; Crisis Mapping
Phase 4: Policy Discussion; recommendations
Roles and Responsibilities
ADRC–
AIT –
RESTEC -
GeoThings –
Output – Policy Recommendations
Uses of Policy Recommendations
Improved local capacity to collect and share
reliable and timely disaster related data
using SBT and ICT
Phase 2: Community-based mapping of hazards, risks,
buildings and evacuation routes
Phase 4: Policy Discussion; recommendations

Lesson 3: Townwatching

  • 1.
    TOWNWATCHING MANUAL Developing acommunity-based hazard map driven by community observation and powered by ICT R-CDTA: Applying Space-Based Technology and Information and Communication Technology to Strengthen Disaster Resilience TA: 8884
  • 2.
    Installation/Registration of geoBingAn •Download from playstore • Register with email address and a password of your choosing • Check your email for approval • Follow email instructions
  • 3.
    Membership of geoBingAnfor townwatching • Download from playstore • Register with email address and a password of your choosing • Check your email for approval • Follow email instructions
  • 4.
    Prepare Materials • IngeoBingAn.info use the OSM basemap to create a paper map of the area extent of your townwatching activity • The paper map should highlight the following: all public buildings such as: schools, shelters, hospitals, police and fire stations All OSM buildings All roads, paths, waterways and open space
  • 5.
    Still waiting forthe create/print map function for manual input • Visualizing OSM data (public buildings) • Creating a map
  • 6.
    Creating Groups • Groupsshould be composed of a heterogeneous mix of stakeholders and not exceed more than 7 people; • Each group should have one disaster management expert
  • 7.
    Still waiting forthe administrator function so members can have tw function on their mobile phone
  • 8.
    What is townwatching? Townwatchingis a process to prepare a community- based hazard map for disaster reduction through community-based observation. A hazard map provides graphic information on potential natural hazards and evacuation matters. Community based hazard mapping has 3 key objectives: a) involve local residents in developing the hazard map for their community b) reflect the opinions of local residents in policies made by their local government, and c) foster common understanding of risks among local residents, government officials and experts
  • 9.
    Collecting Data inthe Field Once in the field each group will walk around their community and record information that will either be advantageous or disadvantageous during a disaster. This information is recorded using geoBingAn mobile application. Groups should focus on Evacuation and shelters information and previous disasters in their community. A simple list of presets available on GeoBingAn mobile application to capture this information is below. Evacuation Road Condition (Good, Poor, Dangerous) Stair condition on road slope (Good, Poor) # Sudden depression in the road (Y/N) Possible road barriers (Slope, Sudden Depression, Unstable Structures, Narrow Brid Poor quality bridge, could be damaged by earthquakes Street light (Yes/No) Dangerous electric poles/wiring on the road (Y/N) Available open space (Closed, Open) Shelter Shelter is more than one storey (Y/N) Shelter is strong enough for earthquakes (Y/N) Shelter is strong enough for cyclones (Y/N) Shelter capacity ________________ Shelter has adequate water supplies (Y/N) Shelter has sufficient toilets (Y/N) Flood The area/building was flooded before (Y/N) Flood type (Riverine, Flash, Embankment breach, local rainfall) Presence of flood early warning system (Y/N) Availability of public information board for flood (Y/N) Maximum level during recent floods (Knee, Waist, Chest, above Head) Cyclone The area/building was affected by cyclone before (Y/N) The area/building was inundated by storm surge before (Y/N) The area is open (Y/N) The area is on a higher elevation (Y/N) The area has a concentration of light material/poor quality buildings (Y/N) Availability of public board for cyclone (Y/N) Earthquake Building is strong enough for earthquakes (Y/N) The area/building was inundated by storm surge before (Y/N) The area is open (Y/N) Landslide The area/building is located in or near slope more than 30 Degree (Y/N) Slope is covered by vegetation (Y/N) Presence of landslide mitigation measures (Y/N) Availability of public information board for landslide (Y/N)
  • 10.
    Advantageous or Disadvantageous Advantageous/Capacities things that will increase community’s resilience to disaster  signage informing the public about disaster or hazards in the area  weather station  shelter Disadvantageous/Vulnerabilities  previous disaster has occurred  high water marks or the extent of a storm surge  poor quality infrastructure  areas likely to be affected by future hazards
  • 11.
    Shelter • Draw smallpolygons around shelters
  • 12.
    Evacuation route • Evacuationroute criteria: Routes should avoid hazard polygons Evacuation routes should start at an highly dense area and link people to shelters
  • 14.
    Why? • Disaster eventsare increasing in Asia • Technology and information is becoming available at zero to low cost which can help people access and create information helpful in disaster risk management
  • 15.
  • 16.
  • 17.
    1)Community-based OSM base map development; 2)Community-based mappingof hazards, risks, buildings and evacuation routes; 3)Crisis mapping; 4)Utilization of satellite-based damage assessment; 5)Data management using GIS at local governments; and 6)Utilization of data at the community level for DRR, response and recovery.
  • 18.
    Phase 1: Community-basedOSM base map development Roles and Responsibilities Nation consultants – organize mapathons and teach communities members how to use OSM and a mobile application to map their community RESTEC – help procure high resolution imagery when OSM imagery is not clear enough for mapping AIT – work with ADRC to develop the list of attributes to be field validated, train NC’s in using the mobile application for field validation GeoThings – develop mobile application to field validate OSM data
  • 19.
    Phase 1: Community-basedOSM base map development Output - OSM basemap Uses of OSM basemap Community hazard mapping– OSM basemap will be used in Phase 2 townwatching to create a community hazard map Building damage assessment – following a disaster, community can use a mobile application to perform a building damage assessment – in SW3 statistics can be generated to inform the government of economic loss in the area
  • 21.
    Status of OSMdesktop mapping in pilot area
  • 22.
    Once OSM buildingsand roads data was available attribute information was added to the data through community field validation using mobile application geoMapTool – information collect on this mobile application is then uploaded directly to OSM Platform
  • 23.
    Status of fieldvalidation in pilot area
  • 24.
    Phase 2: Community-basedmapping of hazards, risks, buildings and evacuation routes Roles and Responsibilities ADRC– integrate ICT into their tradition method of townwatching, perform Townwatching AIT – coordinate all firms to develop a methodology for townwatching and using SW2 and SW3 to develop community maps GeoThings – develop mobile application functions to record community hazard data, develop a data management system to visual and integrate data collected in the field as well as government hazard data
  • 25.
    Output – Communityhazard map Uses of Community hazard map Demonstration drill– the hazard map will help build the scenario for the demonstration drill, ex. where will be the movement of people, what are areas where people will go for shelter Phase 2: Community-based mapping of hazards, risks, buildings and evacuation routes
  • 26.
    Building community hazardand evacuation maps combines field validated OSM data, community hazard data collected through mobile applications in software 3
  • 27.
    Phase 3: Demonstrationdrill; Crisis Mapping; establish ICT Infrastructure Roles and Responsibilities ADRC– organize evacuation drill, check coordination mechanism AIT – support drill, train NCs in mobile application, ensure data quality, assist government in using satellite imagery following disaster GeoThings – develop mobile application for crisis mapping and building damage assessment, assistant the NC in setting up the ICT infrastructure
  • 28.
    Output – Systemtest report Uses of System test report Policy discussion– the system test report will be the guiding document to lead policy discussions and develop recommendations to improve the ability community resilience Phase 3: Demonstration drill; Crisis Mapping
  • 29.
    Phase 4: PolicyDiscussion; recommendations Roles and Responsibilities ADRC– AIT – RESTEC - GeoThings –
  • 30.
    Output – PolicyRecommendations Uses of Policy Recommendations Improved local capacity to collect and share reliable and timely disaster related data using SBT and ICT Phase 2: Community-based mapping of hazards, risks, buildings and evacuation routes Phase 4: Policy Discussion; recommendations