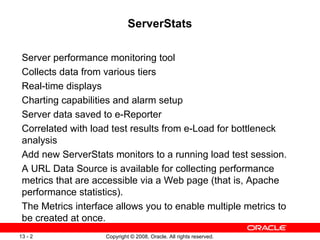
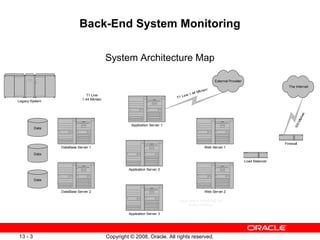
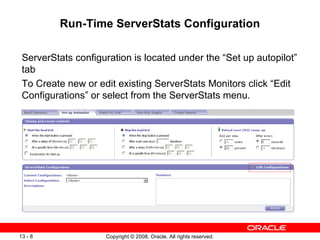
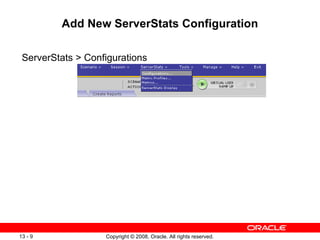
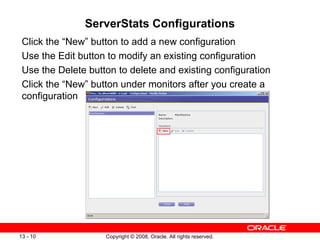
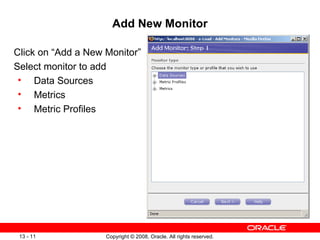
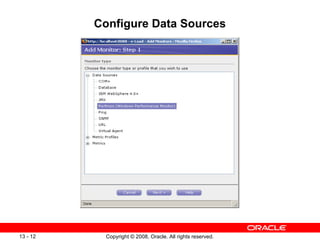
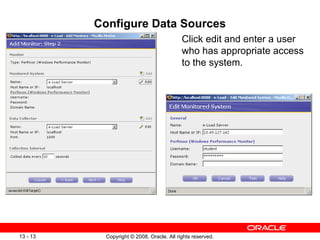
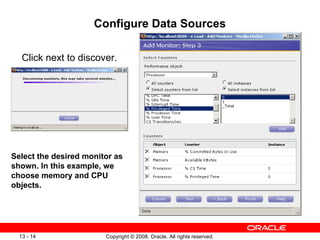
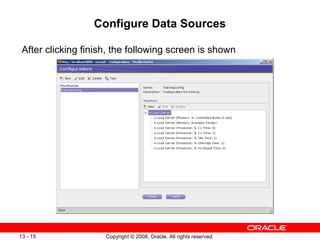
ServerStats Introduction to Oracle Application Testing Suite: e-Load
ServerStats Server performance monitoring tool Collects data from various tiers Real-time displays Charting capabilities and alarm setup Server data saved to e-Reporter  Correlated with load test results from e-Load for bottleneck analysis Add new ServerStats monitors to a running load test session.  A URL Data Source is available for collecting performance metrics that are accessible via a Web page (that is, Apache performance statistics).  The Metrics interface allows you to enable multiple metrics to be created at once.
Back-End System Monitoring System Architecture Map
What Systems to Monitor Look at a system architecture map, determine what systems are contained within the web application. Talk to developers or system architects to learn about the various pieces of the system and how they interact. Also, determine who will monitor and setup these counters. Individuals responsible for monitoring might be a system admin, DBA or QA engineer for example.
Useful Counters on Web Server CPU Usage Memory Usage Hits/pages per second Web process system utilization Current connections Disk swapping Disk utilization
Useful Counters on Application Servers CPU Usage Memory Usage Hits/pages per second Request queue Application Server process system utilization Queue wait time Disk swapping Disk utilization
Useful Counters on Database Servers CPU Usage Memory Usage Database process system utilization Table scans Query wait times Selects/inserts/deletes/updates per second SQL recompilations Table locks Index hits (%)
Run-Time ServerStats Configuration ServerStats configuration is located under the “Set up autopilot” tab To Create new or edit existing ServerStats Monitors click “Edit Configurations” or select from the ServerStats menu.
Add New ServerStats Configuration ServerStats > Configurations
ServerStats Configurations Click the “New” button to add a new configuration Use the Edit button to modify an existing configuration Use the Delete button to delete and existing configuration Click the “New” button under monitors after you create a configuration
Add New Monitor Click on “Add a New Monitor” Select monitor to add Data Sources Metrics Metric Profiles
Configure Data Sources
Configure Data Sources Click edit and enter a user who has appropriate access to the system.
Configure Data Sources Click next to discover. Select the desired monitor as shown. In this example, we choose memory and CPU objects.
Configure Data Sources After clicking finish, the following screen is shown
Metrics The process for configuring a metric (individual monitor) is the similar to that of the data source. Metric is done one by one and automatically selects an appropriate data source.
Metric Profiles Metric Profiles are used to configure several monitors in one step. Commonly used metrics are preconfigured in the profiles Data sources are automatically selected when creating metric profiles.
Select ServerStats Configuration Before starting a test, select the appropriate ServerStats configuration to use. Monitors for that configuration will be displayed in the monitors window
Exercise 3 Set up server stats to collect the following information.  If possible, set this up to monitor the web server, otherwise just setup to monitor the e-Load client machine executing the VU’s Percent CPU and Percent Memory Utilization Web Server Total Requests/Sec (if available) Application Server Queued Requests (if available) Database Server User Connections (if available) Rerun the load test that you setup in Workshop 1 but this time collect the ServerStats data
 

Less13 3 e_loadmodule_3

  • 1.
    ServerStats Introduction toOracle Application Testing Suite: e-Load
  • 2.
    ServerStats Server performancemonitoring tool Collects data from various tiers Real-time displays Charting capabilities and alarm setup Server data saved to e-Reporter Correlated with load test results from e-Load for bottleneck analysis Add new ServerStats monitors to a running load test session. A URL Data Source is available for collecting performance metrics that are accessible via a Web page (that is, Apache performance statistics). The Metrics interface allows you to enable multiple metrics to be created at once.
  • 3.
    Back-End System MonitoringSystem Architecture Map
  • 4.
    What Systems toMonitor Look at a system architecture map, determine what systems are contained within the web application. Talk to developers or system architects to learn about the various pieces of the system and how they interact. Also, determine who will monitor and setup these counters. Individuals responsible for monitoring might be a system admin, DBA or QA engineer for example.
  • 5.
    Useful Counters onWeb Server CPU Usage Memory Usage Hits/pages per second Web process system utilization Current connections Disk swapping Disk utilization
  • 6.
    Useful Counters onApplication Servers CPU Usage Memory Usage Hits/pages per second Request queue Application Server process system utilization Queue wait time Disk swapping Disk utilization
  • 7.
    Useful Counters onDatabase Servers CPU Usage Memory Usage Database process system utilization Table scans Query wait times Selects/inserts/deletes/updates per second SQL recompilations Table locks Index hits (%)
  • 8.
    Run-Time ServerStats ConfigurationServerStats configuration is located under the “Set up autopilot” tab To Create new or edit existing ServerStats Monitors click “Edit Configurations” or select from the ServerStats menu.
  • 9.
    Add New ServerStatsConfiguration ServerStats > Configurations
  • 10.
    ServerStats Configurations Clickthe “New” button to add a new configuration Use the Edit button to modify an existing configuration Use the Delete button to delete and existing configuration Click the “New” button under monitors after you create a configuration
  • 11.
    Add New MonitorClick on “Add a New Monitor” Select monitor to add Data Sources Metrics Metric Profiles
  • 12.
  • 13.
    Configure Data SourcesClick edit and enter a user who has appropriate access to the system.
  • 14.
    Configure Data SourcesClick next to discover. Select the desired monitor as shown. In this example, we choose memory and CPU objects.
  • 15.
    Configure Data SourcesAfter clicking finish, the following screen is shown
  • 16.
    Metrics The processfor configuring a metric (individual monitor) is the similar to that of the data source. Metric is done one by one and automatically selects an appropriate data source.
  • 17.
    Metric Profiles MetricProfiles are used to configure several monitors in one step. Commonly used metrics are preconfigured in the profiles Data sources are automatically selected when creating metric profiles.
  • 18.
    Select ServerStats ConfigurationBefore starting a test, select the appropriate ServerStats configuration to use. Monitors for that configuration will be displayed in the monitors window
  • 19.
    Exercise 3 Setup server stats to collect the following information. If possible, set this up to monitor the web server, otherwise just setup to monitor the e-Load client machine executing the VU’s Percent CPU and Percent Memory Utilization Web Server Total Requests/Sec (if available) Application Server Queued Requests (if available) Database Server User Connections (if available) Rerun the load test that you setup in Workshop 1 but this time collect the ServerStats data
  • 20.

Editor's Notes

  • #12 Data Sources - Select the type of object that is going to supply the data. Security information and other details are necessary to connect to the various system, components in a web application. A data source is where monitor information is coming from Metrics - Individual monitor information collected. For example CPU % Busy Time under systems gives and percent usage of the CPU. Metric Profiles - A collection of individual monitors for a given server or system type.
  • #13 Oracle Application Testing Suite: Introduction 13 - Data Sources Expand the Data Sources node as shown. For simplicity, we will use Windows perfmon as the data source. Click “Next”
  • #14 Click Edit to open the dialog for configuring permissions on the monitored system.