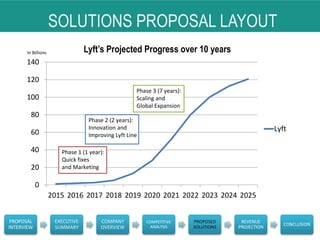
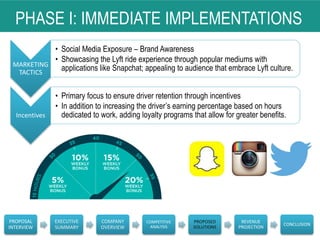
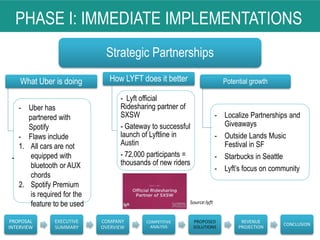
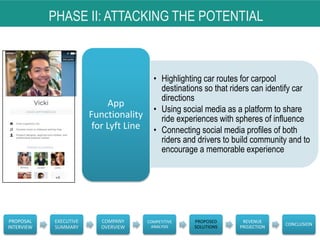
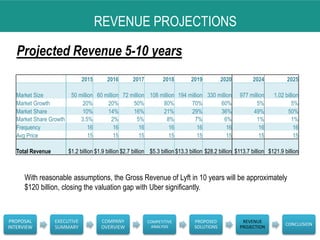
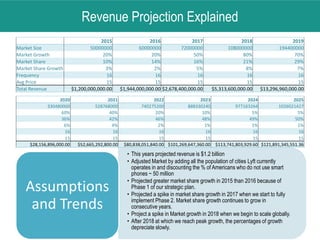
UBS Case Competition 2015
CLOSING THE VALUATION GAP
RICHARD KANG | ELBERT KIM
JAMES CAMAGONG| JOHN BREEN
PROPOSAL OVERVIEW
I • EXECUTIVE SUMMARY
II • MARKET OVERVIEW
III • COMPANY EVALUATION
IV • COMPETITIVE ANALYSIS
V • PROPOSED SOLUTIONS
VI • REVENUE PROJECTIONS
VII
• CONCLUSION
PROPOSAL
INTERVIEW
EXECUTIVE
SUMMARY
COMPANY
OVERVIEW
COMPETITIVE
ANALYSIS
PROPOSED
SOLUTIONS
REVENUE
PROJECTION
CONCLUSION
EXECUTIVE SUMMARY
LYFT will close the valuation gap with UBER by capitalizing on its carpool service, Lyft Line, which edges Uber’s
alternative, UberPool. By focusing its attention in a customer segment it can dominate, Lyft positions itself for global
scalability. Increasing our driver/customer incentives, marketing tactics, and strategic partnerships will allow Lyft to
immediately strengthen its brand and invest in Lyft Line.
•Loyalty programs that Incentivize drivers and rider
•Social Media
•Partnerships, Reduced Prime time fees, and increase distribution
channels
Quick Fixes and Marketing
•Lyft Line embodies our brand image
•LyftLine edges UberPool
•Innovate and Improve Lyft Line to provide exceptional customer
experience.
Innovation and Improvement
Focusing on Lyft Line
•Scale business by expanding to similar global metropolitan areas
•Our developed Lyft Line service will be the forerunner in this
movement
Expanding to New Markets
OVERVIEW OF LYFT
LYFT is a privately held, San Francisco-based American transportation network company that
facilitates peer-to-peer ridesharing by connecting passengers who need a ride to those that have a car.
Expected Gross Revenue 2015 $1.2 Billion
Expected Net Revenue 2015 $300 Million
Expected Net Profit $170 Million
PROPOSAL
INTERVIEW
EXECUTIVE
SUMMARY
COMPANY
OVERVIEW
COMPETITIVE
ANALYSIS
PROPOSED
SOLUTIONS
REVENUE
PROJECTION
CONCLUSION
TechCrunch
LYFT’S tagline is “your friend with a car”. This branding emphasizes social relationships and
ultimately targets the user’s personal experience with the service provided. The culture it brings is
unique and sets it apart from other ride-sharing companies.
COMPETITIVE ANALYSIS
PROPOSAL
INTERVIEW
EXECUTIVE
SUMMARY
COMPANY
OVERVIEW
COMPETITIVE
ANALYSIS
PROPOSED
SOLUTIONS
REVENUE
PROJECTION
CONCLUSION
UBER currently dominates this market and earns an estimated 12x more revenue than Lyft
(considering international efforts)
Estimated Gross Revenue: $10 billion
Estimated Net Revenue: $2 billion
Source: ubervs.lyft
No
LYFT UBER TAXI
Mobile App
Functionality
High High N/A
Diversity of
Product
3 (Line, Lyft, Plus) 7 (Pool, X, XL,
Black, SUV, LUX,
Fresh)
Normal/Luxury
Domestic/Int. Domestic Both Both
Peak Pricing Yes Yes No
Airport Access No No Yes
Technology Mobile App Mobile App/Web Phone Call/ Web
COMPETITIVE ANALYSIS
Source:slate
Uber is currently
dominating the
market by:
- increasing
revenue 10-11x
faster than Lyft
- giving rides 6-7x
faster than Lyft.
SOLUTIONS PROPOSAL LAYOUT
PROPOSAL
INTERVIEW
EXECUTIVE
SUMMARY
COMPANY
OVERVIEW
COMPETITIVE
ANALYSIS
PROPOSED
SOLUTIONS
REVENUE
PROJECTION
CONCLUSION
0
20
40
60
80
100
120
140
2015 2016 2017 2018 2019 2020 2021 2022 2023 2024 2025
Lyft’s Projected Progress over 10 years
Lyft
Phase 1 (1 year):
Quick fixes
and Marketing
Phase 2 (2 years):
Innovation and
Improving Lyft Line
Phase 3 (7 years):
Scaling and
Global Expansion
In Billions
PHASE I: IMMEDIATE IMPLEMENTATIONS
MARKETING
TACTICS
• Social Media Exposure – Brand Awareness
• Showcasing the Lyft ride experience through popular mediums with
applications like Snapchat; appealing to audience that embrace Lyft culture.
Incentives
• Primary focus to ensure driver retention through incentives
• In addition to increasing the driver’s earning percentage based on hours
dedicated to work, adding loyalty programs that allow for greater benefits.
PROPOSAL
INTERVIEW
EXECUTIVE
SUMMARY
COMPANY
OVERVIEW
COMPETITIVE
ANALYSIS
PROPOSED
SOLUTIONS
REVENUE
PROJECTION
CONCLUSION
PHASE I: IMMEDIATE IMPLEMENTATIONS
Strategic Partnerships
Potential growthHow LYFT does it better
- Lyft official
Ridesharing partner of
SXSW
- Gateway to successful
launch of Lyftline in
Austin
- 72,000 participants =
thousands of new riders
- Localize Partnerships and
Giveaways
- Outside Lands Music
Festival in SF
- Starbucks in Seattle
- Lyft’s focus on community
PROPOSAL
INTERVIEW
EXECUTIVE
SUMMARY
COMPANY
OVERVIEW
COMPETITIVE
ANALYSIS
PROPOSED
SOLUTIONS
REVENUE
PROJECTION
CONCLUSION
Source:lyft
What Uber is doing
- Uber has
partnered with
Spotify
- Flaws include
1. All cars are not
equipped with
bluetooth or AUX
chords
2. Spotify Premium
is required for the
feature to be used
-
PHASE I: IMMEDIATE IMPLEMENTATIONS
Tackling “Primetime” and “Surge” Prices
PROPOSAL
INTERVIEW
EXECUTIVE
SUMMARY
COMPANY
OVERVIEW
COMPETITIVE
ANALYSIS
PROPOSED
SOLUTIONS
REVENUE
PROJECTION
CONCLUSION
LYFT caps their PRIME TIME PRICING
- LYFT caps their PRIME TIME pricing at 400%(equivalent to 5x UberX), while Uber’s surge
pricing may end up to be 8-9x
- Uber Surge Pricing + Commision VS. Lyft Prime Time Tips
- Surge pricing and Prime Time are highest during: 7-9 am & 6-8 pm.
HOW WE CAN UTILIZE THIS UPPER HAND?
80%
20%
- 80% of drivers commute alone to and from work which corresponds to
peak hours where Prime Time and Surge Pricing is highest.
- Target these drivers to become Lyft drivers on their way to work and back
- Lowers prime time tips, less detours, easy profitability (up to $400/month
for 1 rider).
PHASE I: IMMEDIATE IMPLEMENTATIONS
Adults with
Smartphones
Adults with Non-
Smart Phones
Adults with No
Phone
~30%
6%
- We want to target 75 million adults that have phones but cannot use Lyft by offering
access to Lyft via Web and text messaging.
- Adding these distribution channels immediately expands our market size
Improving Distribution Channels
64%
160 mill
Cell Phone Activities
81% send or receive text messages
60% access to the internet
52% send or receive email
50% download apps
PROPOSAL
INTERVIEW
EXECUTIVE
SUMMARY
COMPANY
OVERVIEW
COMPETITIVE
ANALYSIS
PROPOSED
SOLUTIONS
REVENUE
PROJECTION
CONCLUSION
Total US Adult Population = 250 mill
PHASE II: ADDRESSING THE POTENTIAL
PROPOSAL
INTERVIEW
EXECUTIVE
SUMMARY
COMPANY
OVERVIEW
COMPETITIVE
ANALYSIS
PROPOSED
SOLUTIONS
REVENUE
PROJECTION
CONCLUSION
 Lyft Line and UberPool pick up
multiple riders in
the same trip and drop them of
en route to their final
destinations.
 By carpooling, riders share
the cost of the ride leading to
cheaper fare.
 This results in higher profits for
drivers and lower costs for
riders.
WHAT IS LYFT LINE AND UBERPOOL?
PHASE II: ADDRESSING THE POTENTIAL
LYFT LINE
IS ON THE RISE
- Lyft Line was released August 2014
- In the span of 6 months, Lyft Line accounts for the
majority of Lyft rides in San Francisco
- Lyft Line is a rapidly expanding customer segment
PROPOSAL
INTERVIEW
EXECUTIVE
SUMMARY
COMPANY
OVERVIEW
COMPETITIVE
ANALYSIS
PROPOSED
SOLUTIONS
REVENUE
PROJECTION
CONCLUSION
Lyft CEO Logan Greene at SXSW 2015 Conference
PHASE II: ADDRESSING THE POTENTIAL
PROPOSAL
INTERVIEW
EXECUTIVE
SUMMARY
COMPANY
OVERVIEW
COMPETITIVE
ANALYSIS
PROPOSED
SOLUTIONS
REVENUE
PROJECTION
CONCLUSION
Lyft offers a more welcoming and
community based culture that
creates a more enjoyable
carpooling
experience
Uber focuses on professionalism
and less on driver/rider interaction
Joe, our jovial driver, helped break the ice by
declaring his ride the “party bus”. Making sure
everyone stayed in good spirits was important given
three strangers were shoulder-to-shoulder on the
back seat.
-Tim Bradshaw, FT.com
LYFT’S CULTURE IS CONDUCIVE TO
CARPOOLING
Even though Lyft and Uber have been branded as ridesharing
companies for a long time, it has only been now the two companies
have competing carpooling services. Overall, Lyft Line is the clear
winner with its friendlier and upfront pricing
-Erica H.maphappy.org.
PHASE II: ADDRESING THE POTENTIAL
LYFT LINE EDGES UBERPOOL
Lyft Line currently offers set-in-stone ride prices before
the ride is requested
UberPool offers a price range that leaves the rider with a
great deal of uncertainty
LYFT UBER
Carpool 2 People 1 Person
Standard 3 or more People 2 or more People
*Number of people permitted per Car Request with a single fee
PROPOSAL
INTERVIEW
EXECUTIVE
SUMMARY
COMPANY
OVERVIEW
COMPETITIVE
ANALYSIS
PROPOSED
SOLUTIONS
REVENUE
PROJECTION
CONCLUSION
PHASE II: ADDRESSING THE POTENTIAL
CASE STUDY:
DOWNTOWN
TO SFO
PROPOSAL
INTERVIEW
EXECUTIVE
SUMMARY
COMPANY
OVERVIEW
COMPETITIVE
ANALYSIS
PROPOSED
SOLUTIONS
REVENUE
PROJECTION
CONCLUSION
TOP: COST OF LYFT LINE
BOTTOM: COST OF UBER POOL
Source:maphappy.org
PHASE II: ATTACKING THE POTENTIAL
• Highlighting car routes for carpool
destinations so that riders can identify car
directions
• Using social media as a platform to share
ride experiences with spheres of influence
• Connecting social media profiles of both
riders and drivers to build community and to
encourage a memorable experience
App
Functionality
for Lyft Line
PROPOSAL
INTERVIEW
EXECUTIVE
SUMMARY
COMPANY
OVERVIEW
COMPETITIVE
ANALYSIS
PROPOSED
SOLUTIONS
REVENUE
PROJECTION
CONCLUSION
PHASE III: EXPAND LYFT LINE
SF is a densely populated, metropolitan area
• 805,235 population
• 17,246.4 people per square mile
• Median household income $75,605, US Average $51,900
Similar cities
Boston
• 645,149 population
• 13,321 people per sq. mi.
• Median household income $53,601
Miami
• 417,650 population
• 11,135 people per sq. mi.
• Median household income $46,946
PROPOSAL
INTERVIEW
EXECUTIVE
SUMMARY
COMPANY
OVERVIEW
COMPETITIVE
ANALYSIS
PROPOSED
SOLUTIONS
REVENUE
PROJECTION
CONCLUSION
Source: US Census Bureau
REVENUE PROJECTIONS
Projected Revenue 5-10 years
With reasonable assumptions, the Gross Revenue of Lyft in 10 years will be approximately
$120 billion, closing the valuation gap with Uber significantly.
PROPOSAL
INTERVIEW
EXECUTIVE
SUMMARY
COMPANY
OVERVIEW
COMPETITIVE
ANALYSIS
PROPOSED
SOLUTIONS
REVENUE
PROJECTION
CONCLUSION
2015 2016 2017 2018 2019 2020 2024 2025
Market Size 50 million 60 million 72 million 108 million 194 million 330 million 977 million 1.02 billion
Market Growth 20% 20% 50% 80% 70% 60% 5% 5%
Market Share 10% 14% 16% 21% 29% 36% 49% 50%
Market Share Growth 3.5% 2% 5% 8% 7% 6% 1% 1%
Frequency 16 16 16 16 16 16 16 16
Avg Price 15 15 15 15 15 15 15 15
Total Revenue $1.2 billion $1.9 billion $2.7 billion $5.3 billion $13.3 billion $28.2 billion $113.7 billion $121.9 billion
POTENTIAL PROBLEMS AND SOLUTIONS
• Most current legal battles are being
won by companies in the ridesharing
industry
Increased
Regulation
• Cities with ample public transportation
like New York still use Lyft
• Public Transportation usually does not
run frequently in suburban
neighborhoods.
Increasing
Infrastructure of
Public
Transportation
SUMMARY AND RECAP
PROPOSAL
INTERVIEW
EXECUTIVE
SUMMARY
COMPANY
OVERVIEW
COMPETITIVE
ANALYSIS
PROPOSED
SOLUTIONS
REVENUE
PROJECTION
CONCLUSION
LYFT will close the valuation gap with UBER by capitalizing on its carpool service, Lyft Line, which outperforms
Uber’s alternative, UberPool. By focusing its attention in a customer segment it can dominate, Lyft positions itself
for global scalability. Increasing our driver/customer incentives, marketing tactics, and strategic partnerships will
allow Lyft to immediately strengthen its brand and invest in Lyft Line.
•Loyalty programs that Incentivize drivers and rider
•Social Media
•Partnerships, Reduced Prime time fees, and increase distribution
channels
Quick Fixes and Marketing
•Lyft Line embodies our brand image
•LyftLine edges UberPool
•Innovate and Improve Lyft Line to provide exceptional customer
experience.
Innovation and Improvement
Focusing on Lyft Line
•Scale business by expanding to similar global metropolitan areas
•Our developed Lyft Line service will be the forerunner in this
movement
Expanding to New Markets
Revenue Projection Explained
2015 2016 2017 2018 2019
Market Size 50000000 60000000 72000000 108000000 194400000
Market Growth 20% 20% 50% 80% 70%
Market Share 10% 14% 16% 21% 29%
Market Share Growth 3% 2% 5% 8% 7%
Frequency 16 16 16 16 16
Avg Price 15 15 15 15 15
Total Revenue $1,200,000,000.00 $1,944,000,000.00 $2,678,400,000.00 $5,313,600,000.00 $13,296,960,000.00
2020 2021 2022 2023 2024 2025
330480000 528768000 740275200 888330240 977163264 1026021427
60% 40% 20% 10% 5% 5%
36% 42% 46% 48% 49% 50%
6% 4% 2% 1% 1% 1%
16 16 16 16 16 16
15 15 15 15 15 15
$28,156,896,000.00 $52,665,292,800.00 $80,838,051,840.00 $101,269,647,360.00 $113,741,803,929.60 $121,891,345,551.36
• This years projected revenue is $1.2 billion
• Adjusted Market by adding all the population of cities Lyft currently
operates in and discounting the % of Americans who do not use smart
phones ~ 50 million
• Projected greater market share growth in 2015 than 2016 because of
Phase 1 of our strategic plan.
• Projected a spike in market share growth in 2017 when we start to fully
implement Phase 2. Market share growth continues to grow in
consecutive years.
• Project a spike in Market growth in 2018 when we begin to scale globally.
• After 2018 at which we reach peak growth, the percentages of growth
depreciate slowly.
Assumptions
and Trends

L.E.K. & Huron Consulting Case Competition

  • 1.
    UBS Case Competition2015 CLOSING THE VALUATION GAP RICHARD KANG | ELBERT KIM JAMES CAMAGONG| JOHN BREEN
  • 2.
    PROPOSAL OVERVIEW I •EXECUTIVE SUMMARY II • MARKET OVERVIEW III • COMPANY EVALUATION IV • COMPETITIVE ANALYSIS V • PROPOSED SOLUTIONS VI • REVENUE PROJECTIONS VII • CONCLUSION
  • 3.
    PROPOSAL INTERVIEW EXECUTIVE SUMMARY COMPANY OVERVIEW COMPETITIVE ANALYSIS PROPOSED SOLUTIONS REVENUE PROJECTION CONCLUSION EXECUTIVE SUMMARY LYFT willclose the valuation gap with UBER by capitalizing on its carpool service, Lyft Line, which edges Uber’s alternative, UberPool. By focusing its attention in a customer segment it can dominate, Lyft positions itself for global scalability. Increasing our driver/customer incentives, marketing tactics, and strategic partnerships will allow Lyft to immediately strengthen its brand and invest in Lyft Line. •Loyalty programs that Incentivize drivers and rider •Social Media •Partnerships, Reduced Prime time fees, and increase distribution channels Quick Fixes and Marketing •Lyft Line embodies our brand image •LyftLine edges UberPool •Innovate and Improve Lyft Line to provide exceptional customer experience. Innovation and Improvement Focusing on Lyft Line •Scale business by expanding to similar global metropolitan areas •Our developed Lyft Line service will be the forerunner in this movement Expanding to New Markets
  • 4.
    OVERVIEW OF LYFT LYFTis a privately held, San Francisco-based American transportation network company that facilitates peer-to-peer ridesharing by connecting passengers who need a ride to those that have a car. Expected Gross Revenue 2015 $1.2 Billion Expected Net Revenue 2015 $300 Million Expected Net Profit $170 Million PROPOSAL INTERVIEW EXECUTIVE SUMMARY COMPANY OVERVIEW COMPETITIVE ANALYSIS PROPOSED SOLUTIONS REVENUE PROJECTION CONCLUSION TechCrunch LYFT’S tagline is “your friend with a car”. This branding emphasizes social relationships and ultimately targets the user’s personal experience with the service provided. The culture it brings is unique and sets it apart from other ride-sharing companies.
  • 5.
    COMPETITIVE ANALYSIS PROPOSAL INTERVIEW EXECUTIVE SUMMARY COMPANY OVERVIEW COMPETITIVE ANALYSIS PROPOSED SOLUTIONS REVENUE PROJECTION CONCLUSION UBER currentlydominates this market and earns an estimated 12x more revenue than Lyft (considering international efforts) Estimated Gross Revenue: $10 billion Estimated Net Revenue: $2 billion Source: ubervs.lyft No LYFT UBER TAXI Mobile App Functionality High High N/A Diversity of Product 3 (Line, Lyft, Plus) 7 (Pool, X, XL, Black, SUV, LUX, Fresh) Normal/Luxury Domestic/Int. Domestic Both Both Peak Pricing Yes Yes No Airport Access No No Yes Technology Mobile App Mobile App/Web Phone Call/ Web
  • 6.
    COMPETITIVE ANALYSIS Source:slate Uber iscurrently dominating the market by: - increasing revenue 10-11x faster than Lyft - giving rides 6-7x faster than Lyft.
  • 7.
    SOLUTIONS PROPOSAL LAYOUT PROPOSAL INTERVIEW EXECUTIVE SUMMARY COMPANY OVERVIEW COMPETITIVE ANALYSIS PROPOSED SOLUTIONS REVENUE PROJECTION CONCLUSION 0 20 40 60 80 100 120 140 20152016 2017 2018 2019 2020 2021 2022 2023 2024 2025 Lyft’s Projected Progress over 10 years Lyft Phase 1 (1 year): Quick fixes and Marketing Phase 2 (2 years): Innovation and Improving Lyft Line Phase 3 (7 years): Scaling and Global Expansion In Billions
  • 8.
    PHASE I: IMMEDIATEIMPLEMENTATIONS MARKETING TACTICS • Social Media Exposure – Brand Awareness • Showcasing the Lyft ride experience through popular mediums with applications like Snapchat; appealing to audience that embrace Lyft culture. Incentives • Primary focus to ensure driver retention through incentives • In addition to increasing the driver’s earning percentage based on hours dedicated to work, adding loyalty programs that allow for greater benefits. PROPOSAL INTERVIEW EXECUTIVE SUMMARY COMPANY OVERVIEW COMPETITIVE ANALYSIS PROPOSED SOLUTIONS REVENUE PROJECTION CONCLUSION
  • 9.
    PHASE I: IMMEDIATEIMPLEMENTATIONS Strategic Partnerships Potential growthHow LYFT does it better - Lyft official Ridesharing partner of SXSW - Gateway to successful launch of Lyftline in Austin - 72,000 participants = thousands of new riders - Localize Partnerships and Giveaways - Outside Lands Music Festival in SF - Starbucks in Seattle - Lyft’s focus on community PROPOSAL INTERVIEW EXECUTIVE SUMMARY COMPANY OVERVIEW COMPETITIVE ANALYSIS PROPOSED SOLUTIONS REVENUE PROJECTION CONCLUSION Source:lyft What Uber is doing - Uber has partnered with Spotify - Flaws include 1. All cars are not equipped with bluetooth or AUX chords 2. Spotify Premium is required for the feature to be used -
  • 10.
    PHASE I: IMMEDIATEIMPLEMENTATIONS Tackling “Primetime” and “Surge” Prices PROPOSAL INTERVIEW EXECUTIVE SUMMARY COMPANY OVERVIEW COMPETITIVE ANALYSIS PROPOSED SOLUTIONS REVENUE PROJECTION CONCLUSION LYFT caps their PRIME TIME PRICING - LYFT caps their PRIME TIME pricing at 400%(equivalent to 5x UberX), while Uber’s surge pricing may end up to be 8-9x - Uber Surge Pricing + Commision VS. Lyft Prime Time Tips - Surge pricing and Prime Time are highest during: 7-9 am & 6-8 pm. HOW WE CAN UTILIZE THIS UPPER HAND? 80% 20% - 80% of drivers commute alone to and from work which corresponds to peak hours where Prime Time and Surge Pricing is highest. - Target these drivers to become Lyft drivers on their way to work and back - Lowers prime time tips, less detours, easy profitability (up to $400/month for 1 rider).
  • 11.
    PHASE I: IMMEDIATEIMPLEMENTATIONS Adults with Smartphones Adults with Non- Smart Phones Adults with No Phone ~30% 6% - We want to target 75 million adults that have phones but cannot use Lyft by offering access to Lyft via Web and text messaging. - Adding these distribution channels immediately expands our market size Improving Distribution Channels 64% 160 mill Cell Phone Activities 81% send or receive text messages 60% access to the internet 52% send or receive email 50% download apps PROPOSAL INTERVIEW EXECUTIVE SUMMARY COMPANY OVERVIEW COMPETITIVE ANALYSIS PROPOSED SOLUTIONS REVENUE PROJECTION CONCLUSION Total US Adult Population = 250 mill
  • 12.
    PHASE II: ADDRESSINGTHE POTENTIAL PROPOSAL INTERVIEW EXECUTIVE SUMMARY COMPANY OVERVIEW COMPETITIVE ANALYSIS PROPOSED SOLUTIONS REVENUE PROJECTION CONCLUSION  Lyft Line and UberPool pick up multiple riders in the same trip and drop them of en route to their final destinations.  By carpooling, riders share the cost of the ride leading to cheaper fare.  This results in higher profits for drivers and lower costs for riders. WHAT IS LYFT LINE AND UBERPOOL?
  • 13.
    PHASE II: ADDRESSINGTHE POTENTIAL LYFT LINE IS ON THE RISE - Lyft Line was released August 2014 - In the span of 6 months, Lyft Line accounts for the majority of Lyft rides in San Francisco - Lyft Line is a rapidly expanding customer segment PROPOSAL INTERVIEW EXECUTIVE SUMMARY COMPANY OVERVIEW COMPETITIVE ANALYSIS PROPOSED SOLUTIONS REVENUE PROJECTION CONCLUSION Lyft CEO Logan Greene at SXSW 2015 Conference
  • 14.
    PHASE II: ADDRESSINGTHE POTENTIAL PROPOSAL INTERVIEW EXECUTIVE SUMMARY COMPANY OVERVIEW COMPETITIVE ANALYSIS PROPOSED SOLUTIONS REVENUE PROJECTION CONCLUSION Lyft offers a more welcoming and community based culture that creates a more enjoyable carpooling experience Uber focuses on professionalism and less on driver/rider interaction Joe, our jovial driver, helped break the ice by declaring his ride the “party bus”. Making sure everyone stayed in good spirits was important given three strangers were shoulder-to-shoulder on the back seat. -Tim Bradshaw, FT.com LYFT’S CULTURE IS CONDUCIVE TO CARPOOLING Even though Lyft and Uber have been branded as ridesharing companies for a long time, it has only been now the two companies have competing carpooling services. Overall, Lyft Line is the clear winner with its friendlier and upfront pricing -Erica H.maphappy.org.
  • 15.
    PHASE II: ADDRESINGTHE POTENTIAL LYFT LINE EDGES UBERPOOL Lyft Line currently offers set-in-stone ride prices before the ride is requested UberPool offers a price range that leaves the rider with a great deal of uncertainty LYFT UBER Carpool 2 People 1 Person Standard 3 or more People 2 or more People *Number of people permitted per Car Request with a single fee PROPOSAL INTERVIEW EXECUTIVE SUMMARY COMPANY OVERVIEW COMPETITIVE ANALYSIS PROPOSED SOLUTIONS REVENUE PROJECTION CONCLUSION
  • 16.
    PHASE II: ADDRESSINGTHE POTENTIAL CASE STUDY: DOWNTOWN TO SFO PROPOSAL INTERVIEW EXECUTIVE SUMMARY COMPANY OVERVIEW COMPETITIVE ANALYSIS PROPOSED SOLUTIONS REVENUE PROJECTION CONCLUSION TOP: COST OF LYFT LINE BOTTOM: COST OF UBER POOL Source:maphappy.org
  • 17.
    PHASE II: ATTACKINGTHE POTENTIAL • Highlighting car routes for carpool destinations so that riders can identify car directions • Using social media as a platform to share ride experiences with spheres of influence • Connecting social media profiles of both riders and drivers to build community and to encourage a memorable experience App Functionality for Lyft Line PROPOSAL INTERVIEW EXECUTIVE SUMMARY COMPANY OVERVIEW COMPETITIVE ANALYSIS PROPOSED SOLUTIONS REVENUE PROJECTION CONCLUSION
  • 18.
    PHASE III: EXPANDLYFT LINE SF is a densely populated, metropolitan area • 805,235 population • 17,246.4 people per square mile • Median household income $75,605, US Average $51,900 Similar cities Boston • 645,149 population • 13,321 people per sq. mi. • Median household income $53,601 Miami • 417,650 population • 11,135 people per sq. mi. • Median household income $46,946 PROPOSAL INTERVIEW EXECUTIVE SUMMARY COMPANY OVERVIEW COMPETITIVE ANALYSIS PROPOSED SOLUTIONS REVENUE PROJECTION CONCLUSION Source: US Census Bureau
  • 19.
    REVENUE PROJECTIONS Projected Revenue5-10 years With reasonable assumptions, the Gross Revenue of Lyft in 10 years will be approximately $120 billion, closing the valuation gap with Uber significantly. PROPOSAL INTERVIEW EXECUTIVE SUMMARY COMPANY OVERVIEW COMPETITIVE ANALYSIS PROPOSED SOLUTIONS REVENUE PROJECTION CONCLUSION 2015 2016 2017 2018 2019 2020 2024 2025 Market Size 50 million 60 million 72 million 108 million 194 million 330 million 977 million 1.02 billion Market Growth 20% 20% 50% 80% 70% 60% 5% 5% Market Share 10% 14% 16% 21% 29% 36% 49% 50% Market Share Growth 3.5% 2% 5% 8% 7% 6% 1% 1% Frequency 16 16 16 16 16 16 16 16 Avg Price 15 15 15 15 15 15 15 15 Total Revenue $1.2 billion $1.9 billion $2.7 billion $5.3 billion $13.3 billion $28.2 billion $113.7 billion $121.9 billion
  • 20.
    POTENTIAL PROBLEMS ANDSOLUTIONS • Most current legal battles are being won by companies in the ridesharing industry Increased Regulation • Cities with ample public transportation like New York still use Lyft • Public Transportation usually does not run frequently in suburban neighborhoods. Increasing Infrastructure of Public Transportation
  • 21.
    SUMMARY AND RECAP PROPOSAL INTERVIEW EXECUTIVE SUMMARY COMPANY OVERVIEW COMPETITIVE ANALYSIS PROPOSED SOLUTIONS REVENUE PROJECTION CONCLUSION LYFTwill close the valuation gap with UBER by capitalizing on its carpool service, Lyft Line, which outperforms Uber’s alternative, UberPool. By focusing its attention in a customer segment it can dominate, Lyft positions itself for global scalability. Increasing our driver/customer incentives, marketing tactics, and strategic partnerships will allow Lyft to immediately strengthen its brand and invest in Lyft Line. •Loyalty programs that Incentivize drivers and rider •Social Media •Partnerships, Reduced Prime time fees, and increase distribution channels Quick Fixes and Marketing •Lyft Line embodies our brand image •LyftLine edges UberPool •Innovate and Improve Lyft Line to provide exceptional customer experience. Innovation and Improvement Focusing on Lyft Line •Scale business by expanding to similar global metropolitan areas •Our developed Lyft Line service will be the forerunner in this movement Expanding to New Markets
  • 22.
    Revenue Projection Explained 20152016 2017 2018 2019 Market Size 50000000 60000000 72000000 108000000 194400000 Market Growth 20% 20% 50% 80% 70% Market Share 10% 14% 16% 21% 29% Market Share Growth 3% 2% 5% 8% 7% Frequency 16 16 16 16 16 Avg Price 15 15 15 15 15 Total Revenue $1,200,000,000.00 $1,944,000,000.00 $2,678,400,000.00 $5,313,600,000.00 $13,296,960,000.00 2020 2021 2022 2023 2024 2025 330480000 528768000 740275200 888330240 977163264 1026021427 60% 40% 20% 10% 5% 5% 36% 42% 46% 48% 49% 50% 6% 4% 2% 1% 1% 1% 16 16 16 16 16 16 15 15 15 15 15 15 $28,156,896,000.00 $52,665,292,800.00 $80,838,051,840.00 $101,269,647,360.00 $113,741,803,929.60 $121,891,345,551.36 • This years projected revenue is $1.2 billion • Adjusted Market by adding all the population of cities Lyft currently operates in and discounting the % of Americans who do not use smart phones ~ 50 million • Projected greater market share growth in 2015 than 2016 because of Phase 1 of our strategic plan. • Projected a spike in market share growth in 2017 when we start to fully implement Phase 2. Market share growth continues to grow in consecutive years. • Project a spike in Market growth in 2018 when we begin to scale globally. • After 2018 at which we reach peak growth, the percentages of growth depreciate slowly. Assumptions and Trends