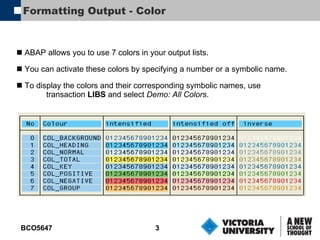
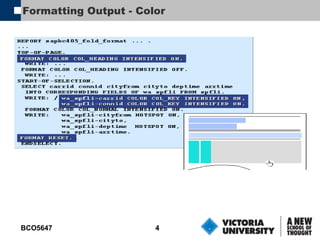
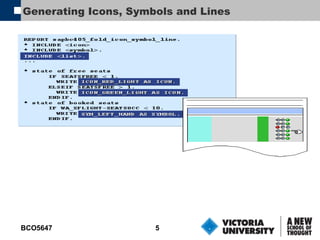
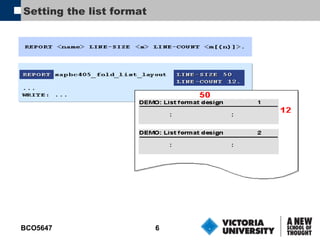
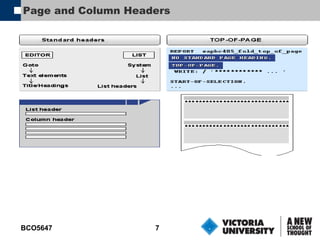
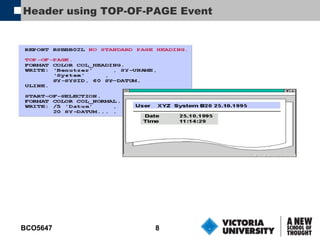
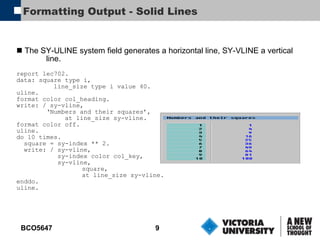
This document discusses formatting options for output in ABAP report programs. It introduces color output options, icon/symbol/line options, page and column headers. Specific topics covered include using 7 predefined colors, generating horizontal and vertical lines, setting list formats, and creating headers using the TOP-OF-PAGE event.
Encodable: Configurable Grammar for Visualization ComponentsKrist Wongsuphasawat
There are so many libraries of visualization components nowadays with their APIs often different from one another. Could these components be more similar, both in terms of the APIs and common functionalities? For someone who is developing a new visualization component, how should the API look like? This work drew inspiration from visualization grammar, decoupled the grammar from its rendering engine and adapted it into a configurable grammar for individual components called Encodable. Encodable helps component authors define grammar for their components, and parse encoding specifications from users into utility functions for the implementation.
Presented in this short document is a description of what is called the (classic) “Pooling Optimization Problem” and was first described in Haverly (1978) where he modeled a small distillate blending problem with three component materials (A, B, C), one pool for mixing or blending of only two components, two products (P1, P2) and one property (sulfur, S) as well as only one time-period. The GAMS file of this exact same problem is found in Appendix A which describes all of the sets, lists, parameters, variables and constraints required to represent this problem. Related types of NLP sub-models can also be found in Kelly and Zyngier (2015) where they formulate other sub-types of continuous-processes such as blenders, splitters, separators, reactors, fractionators and black-boxes for adhoc or custom sub-models.
This presentation shows how to use Microsoft Excel to analyze data. It covers basics, formulas, ranges, formatting, functions, charts, and pivots.
Examples are provided for more than 200 concepts introduced to users of MS Excel to enable them in analyzing and visualizing their data using this powerful and widely available tool.
Examples are also available in an MS Excel spreadsheet.
Please reach out to the author for a copy.
Week 2 iLab TCO 2 — Given a simple problem, design a solutio.docxmelbruce90096
Week 2 iLab
TCO 2 — Given a simple problem, design a solution algorithm that uses arithmetic expressions and built-in functions.
Scenario
Your goal is to solve the following simple programming exercise. You have been contracted by a local antique store to design an algorithm determining the total purchases and sales tax. According to the store owner, the user will need to see the subtotal, the sales tax amount, and the total purchase amount. A customer is purchasing four items from the antique store. Design an algorithm where the user will enter the price of each of the four items. The algorithm will determine the subtotal, the sales tax, and the total purchase amount. Assume the sales tax is 7%.
Be sure to think about the logic and design first (input-process-output (IPO) chart, flowchart, and pseudocode). Display all output using currency formatting.
Advanced (optional): Use a constant for the 7% sales tax.
Rubric
Point distribution for this activity:
iLab Activity
Document
Points possible
Points received
Variable list
10
IPO chart
10
Flowchart
10
Pseudocode/C# code
10
Desk-check
10
Total Points
50
Name:_________________
(1) Variable List With Data Type
List all the variables you will use (use valid variable names). Indicate whether the data type is string, integer, or double, and so on.
(2) IPO Model
List the inputs, any processes, calculations, and outputs. Use the same valid variable names you used in Step 1.
Inputs
Process (calculations)
Outputs
(3) Flowchart
Use MS Visio to create a flowchart. Paste the flowchart here, or attach as separate document. Use the same valid variable names you used in Step 1.
(4) Pseudocode or C# Code
Describe your solution using pseudocode or actual C# code. Use the same valid variable names you selected in Step 1.
(5) Desk-Check
Desk-check your solution by selecting appropriate test data.
Test data: List the values for your test data.
Expected output: What is the expected output of your program?
Step
Variables (write variable names in first line below)
Output
Enter step numbers
1
2
3
Week 2 Activity—Game Seating Charges
TCO 2—Given a simple problem, design a solution algorithm that uses arithmetic expressions and built-in functions.
Assignment
Your goal is to solve the following simple programming exercise. You have been contracted by a local stadium to design an algorithm determining the total seating charges for any game held at the stadium. Lower-level seats cost $25 per seat, mid-level seats cost $15 per seat, and upper-level seats cost $10 per seat. The algorithm should ask the user for the number of seats being purchased in each seating level. Then, the algorithm will determine the total for each level and a grand total for the enti.
Software Delivery At the Speed of AI: Inflectra Invests In AI-Powered QualityInflectra
In this insightful webinar, Inflectra explores how artificial intelligence (AI) is transforming software development and testing. Discover how AI-powered tools are revolutionizing every stage of the software development lifecycle (SDLC), from design and prototyping to testing, deployment, and monitoring.
Learn about:
• The Future of Testing: How AI is shifting testing towards verification, analysis, and higher-level skills, while reducing repetitive tasks.
• Test Automation: How AI-powered test case generation, optimization, and self-healing tests are making testing more efficient and effective.
• Visual Testing: Explore the emerging capabilities of AI in visual testing and how it's set to revolutionize UI verification.
• Inflectra's AI Solutions: See demonstrations of Inflectra's cutting-edge AI tools like the ChatGPT plugin and Azure Open AI platform, designed to streamline your testing process.
Whether you're a developer, tester, or QA professional, this webinar will give you valuable insights into how AI is shaping the future of software delivery.
Smart TV Buyer Insights Survey 2024 by 91mobiles.pdf91mobiles
91mobiles recently conducted a Smart TV Buyer Insights Survey in which we asked over 3,000 respondents about the TV they own, aspects they look at on a new TV, and their TV buying preferences.
JMeter webinar - integration with InfluxDB and GrafanaRTTS
Watch this recorded webinar about real-time monitoring of application performance. See how to integrate Apache JMeter, the open-source leader in performance testing, with InfluxDB, the open-source time-series database, and Grafana, the open-source analytics and visualization application.
In this webinar, we will review the benefits of leveraging InfluxDB and Grafana when executing load tests and demonstrate how these tools are used to visualize performance metrics.
Length: 30 minutes
Session Overview
-------------------------------------------
During this webinar, we will cover the following topics while demonstrating the integrations of JMeter, InfluxDB and Grafana:
- What out-of-the-box solutions are available for real-time monitoring JMeter tests?
- What are the benefits of integrating InfluxDB and Grafana into the load testing stack?
- Which features are provided by Grafana?
- Demonstration of InfluxDB and Grafana using a practice web application
To view the webinar recording, go to:
https://www.rttsweb.com/jmeter-integration-webinar
Slack (or Teams) Automation for Bonterra Impact Management (fka Social Soluti...Jeffrey Haguewood
Sidekick Solutions uses Bonterra Impact Management (fka Social Solutions Apricot) and automation solutions to integrate data for business workflows.
We believe integration and automation are essential to user experience and the promise of efficient work through technology. Automation is the critical ingredient to realizing that full vision. We develop integration products and services for Bonterra Case Management software to support the deployment of automations for a variety of use cases.
This video focuses on the notifications, alerts, and approval requests using Slack for Bonterra Impact Management. The solutions covered in this webinar can also be deployed for Microsoft Teams.
Interested in deploying notification automations for Bonterra Impact Management? Contact us at sales@sidekicksolutionsllc.com to discuss next steps.
Kubernetes & AI - Beauty and the Beast !?! @KCD Istanbul 2024Tobias Schneck
As AI technology is pushing into IT I was wondering myself, as an “infrastructure container kubernetes guy”, how get this fancy AI technology get managed from an infrastructure operational view? Is it possible to apply our lovely cloud native principals as well? What benefit’s both technologies could bring to each other?
Let me take this questions and provide you a short journey through existing deployment models and use cases for AI software. On practical examples, we discuss what cloud/on-premise strategy we may need for applying it to our own infrastructure to get it to work from an enterprise perspective. I want to give an overview about infrastructure requirements and technologies, what could be beneficial or limiting your AI use cases in an enterprise environment. An interactive Demo will give you some insides, what approaches I got already working for real.
DevOps and Testing slides at DASA ConnectKari Kakkonen
My and Rik Marselis slides at 30.5.2024 DASA Connect conference. We discuss about what is testing, then what is agile testing and finally what is Testing in DevOps. Finally we had lovely workshop with the participants trying to find out different ways to think about quality and testing in different parts of the DevOps infinity loop.
Transcript: Selling digital books in 2024: Insights from industry leaders - T...BookNet Canada
The publishing industry has been selling digital audiobooks and ebooks for over a decade and has found its groove. What’s changed? What has stayed the same? Where do we go from here? Join a group of leading sales peers from across the industry for a conversation about the lessons learned since the popularization of digital books, best practices, digital book supply chain management, and more.
Link to video recording: https://bnctechforum.ca/sessions/selling-digital-books-in-2024-insights-from-industry-leaders/
Presented by BookNet Canada on May 28, 2024, with support from the Department of Canadian Heritage.
You can use any of the following FORMAT options: COLOR <n> [ON|OFF] Colors the line background INTENSIFIED[ON|OFF] Intensify colors YES|NO INVERSE [ON|OFF] Inverse: Background/text color HOTSPOT [ON|OFF] Display mouse pointer as hand and single click with mouse button (used with AT LINE-SELECTION ) RESET Resets all formats to their default values The formats set with FORMAT take effect with the next WRITE statement. You can use all FORMAT options with the WRITE statement, but the options will affect only the one field in which they appear. FORMAT options in a WRITE statement change the global formatting instructions (set with a FORMAT statement) for the field.
You can use the AS SYMBOL option of the WRITE statement to include symbols in lists. The symbolic names of these characters are defined in include program <symbol> . You can also insert icons into the list with WRITE <f> AS ICON . To do this, you have to link the include program <icon> in your program. You can link the include program <list> to use both symbols and icons in the list. You can find an overview of available symbols and icons in the online documentation or in the statement examples for WRITE . To generate a horizontal line, use the ULINE statement, system field sy-uline in a WRITE statement. To generate a vertical line, use system field sy-vline in a WRITE statement
Use the additions LINE-SIZE <s> and LINE-COUNT <m> with the REPORT statement to create global definitions for column and line length for all list levels. The different list levels are created during interactive reporting. Within a list level, you can use NEW-PAGE LINE-COUNT <s> to change the number of lines on a page - this value overrides the definition in the REPORT statement. The width of a list can only be changed by creating a new list level. If you want to use the default values, then set <s> and/or <m> to zero. You cannot use variables for <s> or <m>. An optional addition in the REPORT statement, n, reserves a line for the footer. To create a footer, you have to program the END-OF-PAGE event.
You can maintain a list header (page header) and up to four column headers for a list. If you have not maintained a list title, the system uses the program name as a default (system field SY-TITLE ). The addition NO STANDARD PAGE HEADING in the REPORT statement suppresses the output of list/column headers. Alternatively the TOP-OF-PAGE event can be used to generate page headers. TOP-OF-PAGE is especially useful when you want to output variables in the headers. TOP-OF-PAGE is triggered whenever a new page is created ( WRITE , ULINE , and so on). If you do not suppress the standard list headers, they appear above the lines generated by TOP-OF-PAGE . Lines generated by TOP-OF-PAGE remain in the window during vertical scrolling.
Note the use of the START-OF-SELECTION event to separate the TOP-OF-PAGE event. START-OF-SELECTION is the default event if your program does not have an event entry.
Formatting Output - Solid Lines SY-ULINE & SY-VLINE allow you to frame a list, and separate headings by horizontal lines and columns by vertical lines. Explain how program works in reference to producing the output below: