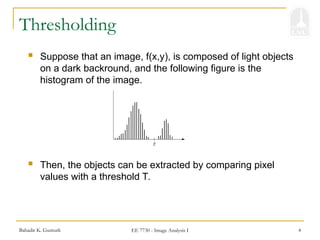
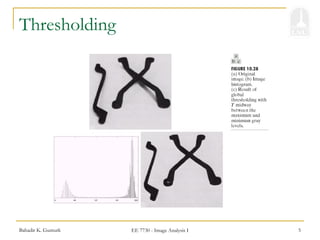
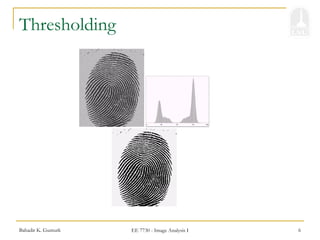
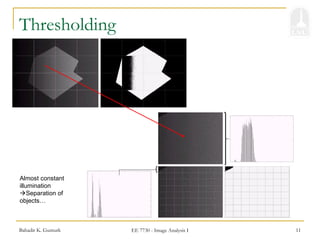
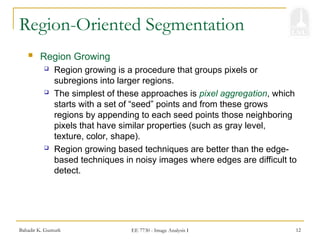
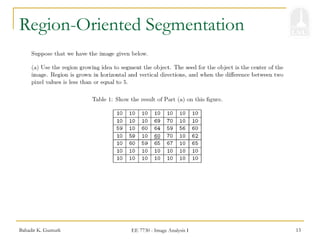
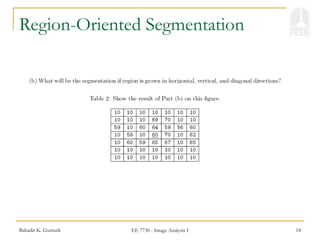
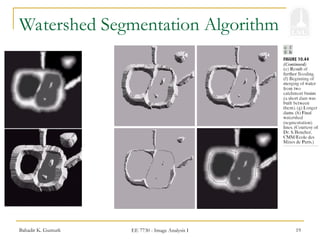
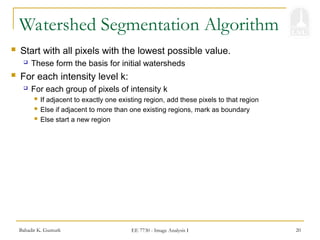
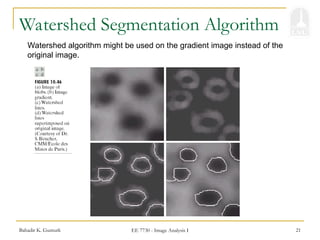
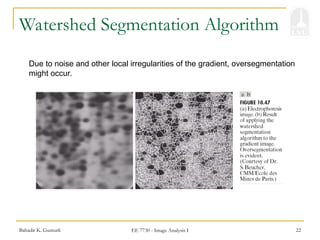
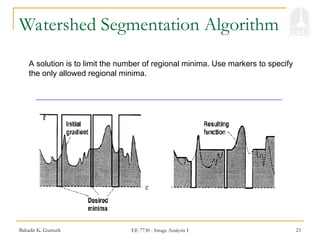
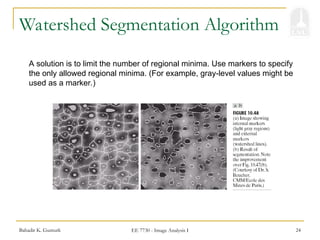
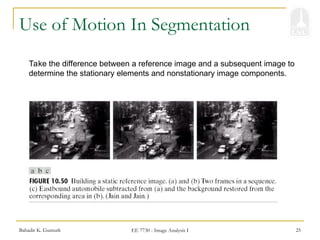
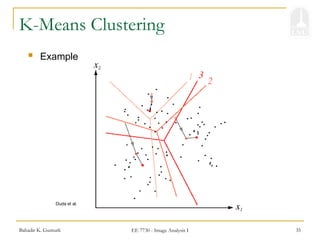
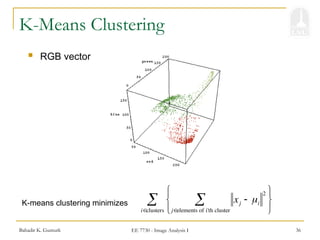
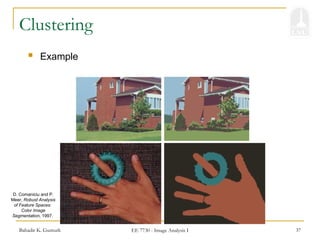
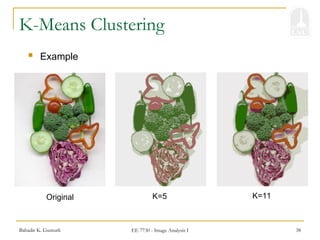
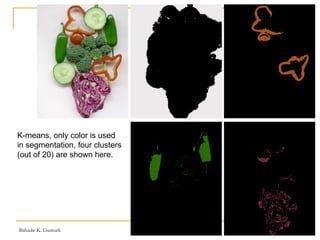
EE 7730
Image Segmentation
Bahadir K. Gunturk EE 7730 - Image Analysis I 2
Image Segmentation
 Group similar components (such as, pixels in an
image, image frames in a video) to obtain a compact
representation.
 Applications: Finding tumors, veins, etc. in medical
images, finding targets in satellite/aerial images,
finding people in surveillance images, summarizing
video, etc.
 Methods: Thresholding, K-means clustering, etc.
Bahadir K. Gunturk EE 7730 - Image Analysis I 3
Image Segmentation
 Segmentation algorithms for monochrome images
generally are based on one of two basic properties of gray-
scale values:
 Discontinuity
 The approach is to partition an image based on abrupt changes
in gray-scale levels.
 The principal areas of interest within this category are detection
of isolated points, lines, and edges in an image.
 Similarity
 The principal approaches in this category are based on
thresholding, region growing, and region splitting/merging.
Bahadir K. Gunturk EE 7730 - Image Analysis I 4
Thresholding
 Suppose that an image, f(x,y), is composed of light objects
on a dark backround, and the following figure is the
histogram of the image.
 Then, the objects can be extracted by comparing pixel
values with a threshold T.
Bahadir K. Gunturk EE 7730 - Image Analysis I 5
Thresholding
Bahadir K. Gunturk EE 7730 - Image Analysis I 6
Thresholding
Bahadir K. Gunturk EE 7730 - Image Analysis I 7
Thresholding
 It is also possible to extract objects that have a specific
intensity range using multiple thresholds.
Extension to color images is straightforward: There are three color
channels, in each one specify the intensity range of the object… Even if
objects are not separated in a single channel, they might be with all the
channels… Application example: Detecting/Tracking faces based on skin
color…
Bahadir K. Gunturk EE 7730 - Image Analysis I 8
Thresholding
 Non-uniform illumination may change the histogram in a
way that it becomes impossible to segment the image
using a single global threshold.
 Choosing local threshold values may help.
Bahadir K. Gunturk EE 7730 - Image Analysis I 9
Thresholding
Bahadir K. Gunturk EE 7730 - Image Analysis I 10
Thresholding
 Adaptive thresholding
Bahadir K. Gunturk EE 7730 - Image Analysis I 11
Thresholding
Almost constant
illumination
Separation of
objects…
Bahadir K. Gunturk EE 7730 - Image Analysis I 12
Region-Oriented Segmentation
 Region Growing
 Region growing is a procedure that groups pixels or
subregions into larger regions.
 The simplest of these approaches is pixel aggregation, which
starts with a set of “seed” points and from these grows
regions by appending to each seed points those neighboring
pixels that have similar properties (such as gray level,
texture, color, shape).
 Region growing based techniques are better than the edge-
based techniques in noisy images where edges are difficult to
detect.
Bahadir K. Gunturk EE 7730 - Image Analysis I 13
Region-Oriented Segmentation
Bahadir K. Gunturk EE 7730 - Image Analysis I 14
Region-Oriented Segmentation
Bahadir K. Gunturk EE 7730 - Image Analysis I 15
Region-Oriented Segmentation
 Region Splitting
 Region growing starts from a set of seed points.
 An alternative is to start with the whole image as a single
region and subdivide the regions that do not satisfy a
condition of homogeneity.
 Region Merging
 Region merging is the opposite of region splitting.
 Start with small regions (e.g. 2x2 or 4x4 regions) and merge
the regions that have similar characteristics (such as gray
level, variance).
 Typically, splitting and merging approaches are used
iteratively.
Bahadir K. Gunturk EE 7730 - Image Analysis I 16
Region-Oriented Segmentation
Bahadir K. Gunturk EE 7730 - Image Analysis I 17
Watershed Segmentation Algorithm
 Visualize an image in 3D: spatial coordinates and gray levels.
 In such a topographic interpretation, there are 3 types of points:
 Points belonging to a regional minimum
 Points at which a drop of water would fall to a single minimum.
(The catchment basin or watershed of that minimum.)
 Points at which a drop of water would be equally likely to fall to more
than one minimum. (The divide lines or watershed lines.)
Watershed lines
Bahadir K. Gunturk EE 7730 - Image Analysis I 18
Watershed Segmentation Algorithm
 The objective is to find watershed lines.
 The idea is simple:
 Suppose that a hole is punched in each regional minimum and that the entire
topography is flooded from below by letting water rise through the holes at a
uniform rate.
 When rising water in distinct catchment basins is about the merge, a dam is
built to prevent merging. These dam boundaries correspond to the watershed
lines.
Bahadir K. Gunturk EE 7730 - Image Analysis I 19
Watershed Segmentation Algorithm
Bahadir K. Gunturk EE 7730 - Image Analysis I 20
 Start with all pixels with the lowest possible value.
 These form the basis for initial watersheds
 For each intensity level k:
 For each group of pixels of intensity k
 If adjacent to exactly one existing region, add these pixels to that region
 Else if adjacent to more than one existing regions, mark as boundary
 Else start a new region
Watershed Segmentation Algorithm
Bahadir K. Gunturk EE 7730 - Image Analysis I 21
Watershed Segmentation Algorithm
Watershed algorithm might be used on the gradient image instead of the
original image.
Bahadir K. Gunturk EE 7730 - Image Analysis I 22
Watershed Segmentation Algorithm
Due to noise and other local irregularities of the gradient, oversegmentation
might occur.
Bahadir K. Gunturk EE 7730 - Image Analysis I 23
Watershed Segmentation Algorithm
A solution is to limit the number of regional minima. Use markers to specify
the only allowed regional minima.
Bahadir K. Gunturk EE 7730 - Image Analysis I 24
Watershed Segmentation Algorithm
A solution is to limit the number of regional minima. Use markers to specify
the only allowed regional minima. (For example, gray-level values might be
used as a marker.)
Bahadir K. Gunturk EE 7730 - Image Analysis I 25
Use of Motion In Segmentation
Take the difference between a reference image and a subsequent image to
determine the stationary elements and nonstationary image components.
Bahadir K. Gunturk EE 7730 - Image Analysis I 26
K-Means Clustering
1. Partition the data points into K clusters randomly. Find the
centroids of each cluster.
2. For each data point:
 Calculate the distance from the data point to each cluster.
 Assign the data point to the closest cluster.
3. Recompute the centroid of each cluster.
4. Repeat steps 2 and 3 until there is no further change in
the assignment of data points (or in the centroids).
Bahadir K. Gunturk EE 7730 - Image Analysis I 27
K-Means Clustering
Bahadir K. Gunturk EE 7730 - Image Analysis I 28
K-Means Clustering
Bahadir K. Gunturk EE 7730 - Image Analysis I 29
K-Means Clustering
Bahadir K. Gunturk EE 7730 - Image Analysis I 30
K-Means Clustering
Bahadir K. Gunturk EE 7730 - Image Analysis I 31
K-Means Clustering
Bahadir K. Gunturk EE 7730 - Image Analysis I 32
K-Means Clustering
Bahadir K. Gunturk EE 7730 - Image Analysis I 33
K-Means Clustering
Bahadir K. Gunturk EE 7730 - Image Analysis I 34
K-Means Clustering
Bahadir K. Gunturk EE 7730 - Image Analysis I 35
K-Means Clustering
 Example
Duda et al.
Bahadir K. Gunturk EE 7730 - Image Analysis I 36
K-Means Clustering
 RGB vector
xj  i
2
jelements of i'th cluster







iclusters

K-means clustering minimizes
Bahadir K. Gunturk EE 7730 - Image Analysis I 37
Clustering
 Example
D. Comaniciu and P.
Meer, Robust Analysis
of Feature Spaces:
Color Image
Segmentation, 1997.
Bahadir K. Gunturk EE 7730 - Image Analysis I 38
K-Means Clustering
 Example
Original K=5 K=11
Bahadir K. Gunturk EE 7730 - Image Analysis I 39
K-means, only color is used
in segmentation, four clusters
(out of 20) are shown here.
Bahadir K. Gunturk EE 7730 - Image Analysis I 40
K-means, color and position
is used in segmentation, four
clusters (out of 20) are shown
here.
Each vector is (R,G,B,x,y).
Bahadir K. Gunturk EE 7730 - Image Analysis I 41
K-Means Clustering: Axis Scaling
 Features of different types may have different scales.
 For example, pixel coordinates on a 100x100 image vs. RGB
color values in the range [0,1].
 Problem: Features with larger scales dominate
clustering.
 Solution: Scale the features.

Lecture on digital image processing _ unit I.ppt

  • 1.
  • 2.
    Bahadir K. GunturkEE 7730 - Image Analysis I 2 Image Segmentation  Group similar components (such as, pixels in an image, image frames in a video) to obtain a compact representation.  Applications: Finding tumors, veins, etc. in medical images, finding targets in satellite/aerial images, finding people in surveillance images, summarizing video, etc.  Methods: Thresholding, K-means clustering, etc.
  • 3.
    Bahadir K. GunturkEE 7730 - Image Analysis I 3 Image Segmentation  Segmentation algorithms for monochrome images generally are based on one of two basic properties of gray- scale values:  Discontinuity  The approach is to partition an image based on abrupt changes in gray-scale levels.  The principal areas of interest within this category are detection of isolated points, lines, and edges in an image.  Similarity  The principal approaches in this category are based on thresholding, region growing, and region splitting/merging.
  • 4.
    Bahadir K. GunturkEE 7730 - Image Analysis I 4 Thresholding  Suppose that an image, f(x,y), is composed of light objects on a dark backround, and the following figure is the histogram of the image.  Then, the objects can be extracted by comparing pixel values with a threshold T.
  • 5.
    Bahadir K. GunturkEE 7730 - Image Analysis I 5 Thresholding
  • 6.
    Bahadir K. GunturkEE 7730 - Image Analysis I 6 Thresholding
  • 7.
    Bahadir K. GunturkEE 7730 - Image Analysis I 7 Thresholding  It is also possible to extract objects that have a specific intensity range using multiple thresholds. Extension to color images is straightforward: There are three color channels, in each one specify the intensity range of the object… Even if objects are not separated in a single channel, they might be with all the channels… Application example: Detecting/Tracking faces based on skin color…
  • 8.
    Bahadir K. GunturkEE 7730 - Image Analysis I 8 Thresholding  Non-uniform illumination may change the histogram in a way that it becomes impossible to segment the image using a single global threshold.  Choosing local threshold values may help.
  • 9.
    Bahadir K. GunturkEE 7730 - Image Analysis I 9 Thresholding
  • 10.
    Bahadir K. GunturkEE 7730 - Image Analysis I 10 Thresholding  Adaptive thresholding
  • 11.
    Bahadir K. GunturkEE 7730 - Image Analysis I 11 Thresholding Almost constant illumination Separation of objects…
  • 12.
    Bahadir K. GunturkEE 7730 - Image Analysis I 12 Region-Oriented Segmentation  Region Growing  Region growing is a procedure that groups pixels or subregions into larger regions.  The simplest of these approaches is pixel aggregation, which starts with a set of “seed” points and from these grows regions by appending to each seed points those neighboring pixels that have similar properties (such as gray level, texture, color, shape).  Region growing based techniques are better than the edge- based techniques in noisy images where edges are difficult to detect.
  • 13.
    Bahadir K. GunturkEE 7730 - Image Analysis I 13 Region-Oriented Segmentation
  • 14.
    Bahadir K. GunturkEE 7730 - Image Analysis I 14 Region-Oriented Segmentation
  • 15.
    Bahadir K. GunturkEE 7730 - Image Analysis I 15 Region-Oriented Segmentation  Region Splitting  Region growing starts from a set of seed points.  An alternative is to start with the whole image as a single region and subdivide the regions that do not satisfy a condition of homogeneity.  Region Merging  Region merging is the opposite of region splitting.  Start with small regions (e.g. 2x2 or 4x4 regions) and merge the regions that have similar characteristics (such as gray level, variance).  Typically, splitting and merging approaches are used iteratively.
  • 16.
    Bahadir K. GunturkEE 7730 - Image Analysis I 16 Region-Oriented Segmentation
  • 17.
    Bahadir K. GunturkEE 7730 - Image Analysis I 17 Watershed Segmentation Algorithm  Visualize an image in 3D: spatial coordinates and gray levels.  In such a topographic interpretation, there are 3 types of points:  Points belonging to a regional minimum  Points at which a drop of water would fall to a single minimum. (The catchment basin or watershed of that minimum.)  Points at which a drop of water would be equally likely to fall to more than one minimum. (The divide lines or watershed lines.) Watershed lines
  • 18.
    Bahadir K. GunturkEE 7730 - Image Analysis I 18 Watershed Segmentation Algorithm  The objective is to find watershed lines.  The idea is simple:  Suppose that a hole is punched in each regional minimum and that the entire topography is flooded from below by letting water rise through the holes at a uniform rate.  When rising water in distinct catchment basins is about the merge, a dam is built to prevent merging. These dam boundaries correspond to the watershed lines.
  • 19.
    Bahadir K. GunturkEE 7730 - Image Analysis I 19 Watershed Segmentation Algorithm
  • 20.
    Bahadir K. GunturkEE 7730 - Image Analysis I 20  Start with all pixels with the lowest possible value.  These form the basis for initial watersheds  For each intensity level k:  For each group of pixels of intensity k  If adjacent to exactly one existing region, add these pixels to that region  Else if adjacent to more than one existing regions, mark as boundary  Else start a new region Watershed Segmentation Algorithm
  • 21.
    Bahadir K. GunturkEE 7730 - Image Analysis I 21 Watershed Segmentation Algorithm Watershed algorithm might be used on the gradient image instead of the original image.
  • 22.
    Bahadir K. GunturkEE 7730 - Image Analysis I 22 Watershed Segmentation Algorithm Due to noise and other local irregularities of the gradient, oversegmentation might occur.
  • 23.
    Bahadir K. GunturkEE 7730 - Image Analysis I 23 Watershed Segmentation Algorithm A solution is to limit the number of regional minima. Use markers to specify the only allowed regional minima.
  • 24.
    Bahadir K. GunturkEE 7730 - Image Analysis I 24 Watershed Segmentation Algorithm A solution is to limit the number of regional minima. Use markers to specify the only allowed regional minima. (For example, gray-level values might be used as a marker.)
  • 25.
    Bahadir K. GunturkEE 7730 - Image Analysis I 25 Use of Motion In Segmentation Take the difference between a reference image and a subsequent image to determine the stationary elements and nonstationary image components.
  • 26.
    Bahadir K. GunturkEE 7730 - Image Analysis I 26 K-Means Clustering 1. Partition the data points into K clusters randomly. Find the centroids of each cluster. 2. For each data point:  Calculate the distance from the data point to each cluster.  Assign the data point to the closest cluster. 3. Recompute the centroid of each cluster. 4. Repeat steps 2 and 3 until there is no further change in the assignment of data points (or in the centroids).
  • 27.
    Bahadir K. GunturkEE 7730 - Image Analysis I 27 K-Means Clustering
  • 28.
    Bahadir K. GunturkEE 7730 - Image Analysis I 28 K-Means Clustering
  • 29.
    Bahadir K. GunturkEE 7730 - Image Analysis I 29 K-Means Clustering
  • 30.
    Bahadir K. GunturkEE 7730 - Image Analysis I 30 K-Means Clustering
  • 31.
    Bahadir K. GunturkEE 7730 - Image Analysis I 31 K-Means Clustering
  • 32.
    Bahadir K. GunturkEE 7730 - Image Analysis I 32 K-Means Clustering
  • 33.
    Bahadir K. GunturkEE 7730 - Image Analysis I 33 K-Means Clustering
  • 34.
    Bahadir K. GunturkEE 7730 - Image Analysis I 34 K-Means Clustering
  • 35.
    Bahadir K. GunturkEE 7730 - Image Analysis I 35 K-Means Clustering  Example Duda et al.
  • 36.
    Bahadir K. GunturkEE 7730 - Image Analysis I 36 K-Means Clustering  RGB vector xj  i 2 jelements of i'th cluster        iclusters  K-means clustering minimizes
  • 37.
    Bahadir K. GunturkEE 7730 - Image Analysis I 37 Clustering  Example D. Comaniciu and P. Meer, Robust Analysis of Feature Spaces: Color Image Segmentation, 1997.
  • 38.
    Bahadir K. GunturkEE 7730 - Image Analysis I 38 K-Means Clustering  Example Original K=5 K=11
  • 39.
    Bahadir K. GunturkEE 7730 - Image Analysis I 39 K-means, only color is used in segmentation, four clusters (out of 20) are shown here.
  • 40.
    Bahadir K. GunturkEE 7730 - Image Analysis I 40 K-means, color and position is used in segmentation, four clusters (out of 20) are shown here. Each vector is (R,G,B,x,y).
  • 41.
    Bahadir K. GunturkEE 7730 - Image Analysis I 41 K-Means Clustering: Axis Scaling  Features of different types may have different scales.  For example, pixel coordinates on a 100x100 image vs. RGB color values in the range [0,1].  Problem: Features with larger scales dominate clustering.  Solution: Scale the features.