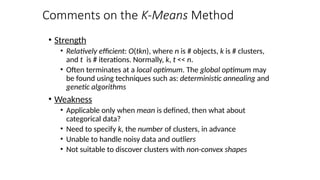
Clustering
- Dr. Sifat Momen (SfM1)
9
11/30/2024 Slides by Dr. Sifat Momen 2
Learning goals
• After this presentation, you should be able to
• Understand what clustering is
• Understand the different types of clustering
• Apply Kmeans clustering algorithm
• Understand the notion of silhouette clustering
• Organizing data into classes such that there is
• high intra-class similarity
• low inter-class similarity
• Finding the class labels and the number of classes directly
from the data (in contrast to classification).
• More informally, finding natural groupings among objects.
What is Clustering?
Also called unsupervised learning, sometimes called
classification by statisticians and sorting by
psychologists and segmentation by people in marketing
What is a natural grouping among these objects?
School Employees
Simpson's Family Males
Females
Clustering is subjective
What is a natural grouping among these objects?
What is Similarity?
The quality or state of being similar; likeness; resemblance; as, a similarity of features.
Similarity is hard
to define, but…
“We know it when
we see it”
The real meaning
of similarity is a
philosophical
question. We will
take a more
pragmatic
approach.
Webster's Dictionary
Two Types of Clustering
Hierarchical
• Partitional algorithms: Construct various partitions and then
evaluate them by some criterion (we will see an example called BIRCH)
• Hierarchical algorithms: Create a hierarchical decomposition of
the set of objects using some criterion
Partitional
Partitional Clustering
• Nonhierarchical, each instance is placed in
exactly one of K nonoverlapping clusters.
• Since only one set of clusters is output, the user
normally has to input the desired number of
clusters K.
Unlabeled Dataset
After clustering (Decision Boundaries)
[Also called Voronoi diagram or Voronoi
tesselation]
Squared Error
10
1 2 3 4 5 6 7 8 9 10
1
2
3
4
5
6
7
8
9
Objective Function
Algorithm k-means
1. Decide on a value for k.
2. Initialize the k cluster centers (randomly, if
necessary).
3. Decide the class memberships of the N objects by
assigning them to the nearest cluster center.
4. Re-estimate the k cluster centers, by assuming the
memberships found above are correct.
5. If none of the N objects changed membership in
the last iteration, exit. Otherwise goto 3.
0
1
2
3
4
5
0 1 2 3 4 5
K-means Clustering: Step 1
Algorithm: k-means, Distance Metric: Euclidean Distance
k1
k2
k3
0
1
2
3
4
5
0 1 2 3 4 5
K-means Clustering: Step 2
Algorithm: k-means, Distance Metric: Euclidean Distance
k1
k2
k3
0
1
2
3
4
5
0 1 2 3 4 5
K-means Clustering: Step 3
Algorithm: k-means, Distance Metric: Euclidean Distance
k1
k2
k3
0
1
2
3
4
5
0 1 2 3 4 5
K-means Clustering: Step 4
Algorithm: k-means, Distance Metric: Euclidean Distance
k1
k2
k3
0
1
2
3
4
5
0 1 2 3 4 5
expression in condition 1
expression
in
condition
2
K-means Clustering: Step 5
Algorithm: k-means, Distance Metric: Euclidean Distance
k1
k2
k3
Comments on the K-Means Method
• Strength
• Relatively efficient: O(tkn), where n is # objects, k is # clusters,
and t is # iterations. Normally, k, t << n.
• Often terminates at a local optimum. The global optimum may
be found using techniques such as: deterministic annealing and
genetic algorithms
• Weakness
• Applicable only when mean is defined, then what about
categorical data?
• Need to specify k, the number of clusters, in advance
• Unable to handle noisy data and outliers
• Not suitable to discover clusters with non-convex shapes
10
1 2 3 4 5 6 7 8 9 10
1
2
3
4
5
6
7
8
9
How can we tell the right number of clusters?
In general, this is a unsolved problem. However there are many approximate methods. In the
next few slides we will see an example.
For our example, we will use the
familiar katydid/grasshopper
dataset.
However, in this case we are
imagining that we do NOT
know the class labels. We are
only clustering on the X and Y
axis values.
1 2 3 4 5 6 7 8 9 10
When k = 1, the objective function is 873.0
1 2 3 4 5 6 7 8 9 10
When k = 2, the objective function is 173.1
1 2 3 4 5 6 7 8 9 10
When k = 3, the objective function is 133.6
0.00E+00
1.00E+02
2.00E+02
3.00E+02
4.00E+02
5.00E+02
6.00E+02
7.00E+02
8.00E+02
9.00E+02
1.00E+03
1 2 3 4 5 6
We can plot the objective function values for k equals 1 to 6…
The abrupt change at k = 2, is highly suggestive of two clusters
in the data. This technique for determining the number of
clusters is known as “knee finding” or “elbow finding”.
Note that the results are not always as clear cut as in this toy example
k
Objective
Function
Lecture 9 -Clustering(ML algorithms: Clustering, KNN, DBScan).pptx

Lecture 9 -Clustering(ML algorithms: Clustering, KNN, DBScan).pptx

  • 1.
    Clustering - Dr. SifatMomen (SfM1) 9
  • 2.
    11/30/2024 Slides byDr. Sifat Momen 2 Learning goals • After this presentation, you should be able to • Understand what clustering is • Understand the different types of clustering • Apply Kmeans clustering algorithm • Understand the notion of silhouette clustering
  • 3.
    • Organizing datainto classes such that there is • high intra-class similarity • low inter-class similarity • Finding the class labels and the number of classes directly from the data (in contrast to classification). • More informally, finding natural groupings among objects. What is Clustering? Also called unsupervised learning, sometimes called classification by statisticians and sorting by psychologists and segmentation by people in marketing
  • 4.
    What is anatural grouping among these objects?
  • 5.
    School Employees Simpson's FamilyMales Females Clustering is subjective What is a natural grouping among these objects?
  • 6.
    What is Similarity? Thequality or state of being similar; likeness; resemblance; as, a similarity of features. Similarity is hard to define, but… “We know it when we see it” The real meaning of similarity is a philosophical question. We will take a more pragmatic approach. Webster's Dictionary
  • 7.
    Two Types ofClustering Hierarchical • Partitional algorithms: Construct various partitions and then evaluate them by some criterion (we will see an example called BIRCH) • Hierarchical algorithms: Create a hierarchical decomposition of the set of objects using some criterion Partitional
  • 8.
    Partitional Clustering • Nonhierarchical,each instance is placed in exactly one of K nonoverlapping clusters. • Since only one set of clusters is output, the user normally has to input the desired number of clusters K.
  • 9.
  • 10.
    After clustering (DecisionBoundaries) [Also called Voronoi diagram or Voronoi tesselation]
  • 11.
    Squared Error 10 1 23 4 5 6 7 8 9 10 1 2 3 4 5 6 7 8 9 Objective Function
  • 12.
    Algorithm k-means 1. Decideon a value for k. 2. Initialize the k cluster centers (randomly, if necessary). 3. Decide the class memberships of the N objects by assigning them to the nearest cluster center. 4. Re-estimate the k cluster centers, by assuming the memberships found above are correct. 5. If none of the N objects changed membership in the last iteration, exit. Otherwise goto 3.
  • 13.
    0 1 2 3 4 5 0 1 23 4 5 K-means Clustering: Step 1 Algorithm: k-means, Distance Metric: Euclidean Distance k1 k2 k3
  • 14.
    0 1 2 3 4 5 0 1 23 4 5 K-means Clustering: Step 2 Algorithm: k-means, Distance Metric: Euclidean Distance k1 k2 k3
  • 15.
    0 1 2 3 4 5 0 1 23 4 5 K-means Clustering: Step 3 Algorithm: k-means, Distance Metric: Euclidean Distance k1 k2 k3
  • 16.
    0 1 2 3 4 5 0 1 23 4 5 K-means Clustering: Step 4 Algorithm: k-means, Distance Metric: Euclidean Distance k1 k2 k3
  • 17.
    0 1 2 3 4 5 0 1 23 4 5 expression in condition 1 expression in condition 2 K-means Clustering: Step 5 Algorithm: k-means, Distance Metric: Euclidean Distance k1 k2 k3
  • 18.
    Comments on theK-Means Method • Strength • Relatively efficient: O(tkn), where n is # objects, k is # clusters, and t is # iterations. Normally, k, t << n. • Often terminates at a local optimum. The global optimum may be found using techniques such as: deterministic annealing and genetic algorithms • Weakness • Applicable only when mean is defined, then what about categorical data? • Need to specify k, the number of clusters, in advance • Unable to handle noisy data and outliers • Not suitable to discover clusters with non-convex shapes
  • 19.
    10 1 2 34 5 6 7 8 9 10 1 2 3 4 5 6 7 8 9 How can we tell the right number of clusters? In general, this is a unsolved problem. However there are many approximate methods. In the next few slides we will see an example. For our example, we will use the familiar katydid/grasshopper dataset. However, in this case we are imagining that we do NOT know the class labels. We are only clustering on the X and Y axis values.
  • 20.
    1 2 34 5 6 7 8 9 10 When k = 1, the objective function is 873.0
  • 21.
    1 2 34 5 6 7 8 9 10 When k = 2, the objective function is 173.1
  • 22.
    1 2 34 5 6 7 8 9 10 When k = 3, the objective function is 133.6
  • 23.
    0.00E+00 1.00E+02 2.00E+02 3.00E+02 4.00E+02 5.00E+02 6.00E+02 7.00E+02 8.00E+02 9.00E+02 1.00E+03 1 2 34 5 6 We can plot the objective function values for k equals 1 to 6… The abrupt change at k = 2, is highly suggestive of two clusters in the data. This technique for determining the number of clusters is known as “knee finding” or “elbow finding”. Note that the results are not always as clear cut as in this toy example k Objective Function