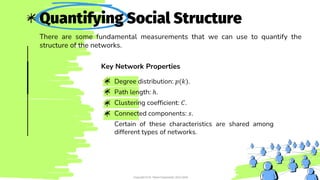
The document discusses key concepts for quantifying and modeling social networks. It covers the following network properties:
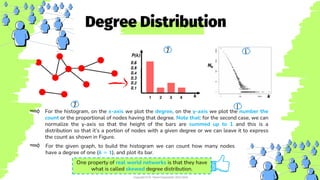
1. Degree distribution - The distribution of the number of connections for each node. Real-world networks often have skewed degree distributions.
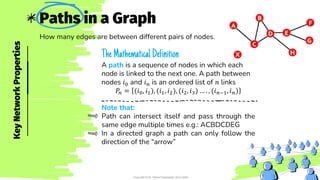
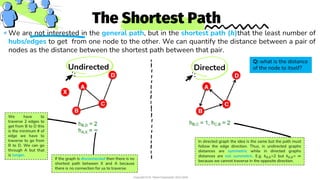
2. Path length and diameter - The shortest and longest distances between node pairs, averaged over all pairs. Real-world networks tend to have small path lengths.
3. Clustering coefficient - The likelihood that two neighbors of a node are also neighbors, quantifying local clustering. Social networks exhibit high clustering.
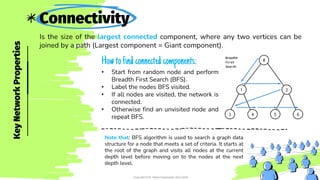
4. Connected components - The size of the largest subset of nodes that are all reachable from each other by paths. Real-world networks often have


![Clustering coefficient: C
This quantity a real application of social networks analysis. The way we define
this quantity is to ask do edges cluster in the network. what do we mean by
clustering is do edges appear more densely in certain part of the network or are
there social communities exist in the network?.
The way we can quantity this mathematically is to say
what proportion of one’s neighbors are connected
among themselves. For a node 𝑖 with degree 𝑘𝑖 the
local clustering coefficient is defined as:
𝐶𝑖 =
2 𝑒𝑖
𝑘𝑖(𝑘𝑖 − 1)
TheMathematicalDefinition
Key
Network
Properties
Copyright © Dr. Reem Essameldin 2023-2024
𝑒𝑖represents the number of links between the 𝑘𝑖 neighbors of
node 𝑖. 𝐶𝑖= 0 if none of the neighbors of node 𝑖 link to each
other. 𝐶𝑖= 1 if the neighbors of node 𝑖 form a complete graph
(i.e., they all link to each other).
𝐶𝑖 ∈ [0, 1]](https://image.slidesharecdn.com/lecture5-qunatifyinganetwork-231212202559-c2c52098/85/Lecture-5-Qunatifying-a-Network-pdf-13-320.jpg)