Download to read offline
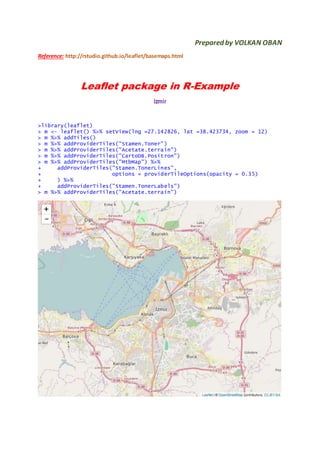

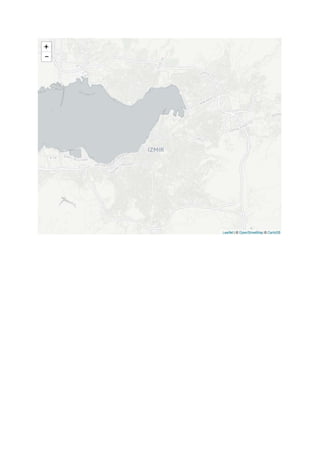
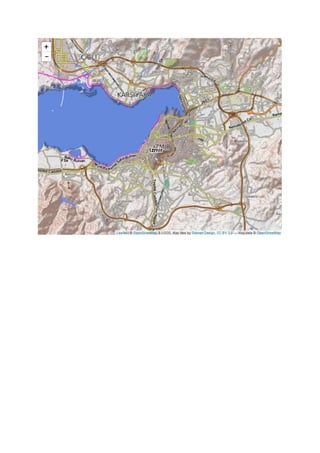

This document demonstrates how to add different basemap tile providers to a Leaflet map created with the leaflet package in R. It loads the leaflet package, sets the initial view of the map to Izmir, Turkey, then sequentially adds different basemap tile providers including Stamen Toner, CartoDB Positron, and Acetate terrain to the map. It also shows how to adjust the opacity of overlaying tile layers.


![Some R Examples[R table and Graphics] -Advanced Data Visualization in R (Some...](https://cdn.slidesharecdn.com/ss_thumbnails/exampless-160922204223-thumbnail.jpg?width=640&height=640&fit=bounds)


![ict_presentation_final_final_final[1].pptx](https://cdn.slidesharecdn.com/ss_thumbnails/ictpresentationfinalfinalfinal1-251230145259-2b4839bd-thumbnail.jpg?width=640&height=640&fit=bounds)

