Downloaded 14 times
![> tmin <- getData("worldclim", var = "tmin", res = 10) # this will downloa
d
> # global data on minimum temperature at 10' resolution
> tmin1 <- raster(paste(getwd(), "/wc10/tmin1.bil", sep = "")) # Tmin for
January
> fromDisk(tmin1)
[1] TRUE
> tmin1 <- tmin1/10 # Worldclim temperature data come in decimal degrees
> tmin1
class : RasterLayer
dimensions : 900, 2160, 1944000 (nrow, ncol, ncell)
resolution : 0.1666667, 0.1666667 (x, y)
extent : -180, 180, -60, 90 (xmin, xmax, ymin, ymax)
coord. ref. : +proj=longlat +ellps=WGS84 +towgs84=0,0,0,0,0,0,0 +no_defs
data source : in memory
names : tmin1
values : -54.7, 26.6 (min, max)
> plot(tmin1)](https://image.slidesharecdn.com/spatialdatainr-160920190758/85/R-Data-Visualization-Spatial-data-and-Maps-in-R-Using-R-as-a-GIS-8-320.jpg)
![> library(gtools)
> file.remove(paste(getwd(), "/wc10/", "tmin_10m_bil.zip", sep = ""))
[1] FALSE
> list.ras <- mixedsort(list.files(paste(getwd(), "/wc10/", sep = ""), full
.names = T,
+ pattern = ".bil"))
> list.ras # I have just collected a list of the files containing monthly
temperature values
list.ras <- mixedsort(list.files(paste(getwd(), "/wc10/", sep = ""), full.names =
T, pattern = ".bil")) list.ras # I have just collected a list of the files
containing monthly temperature values
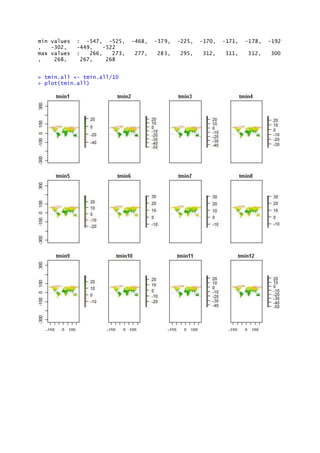
>tmin.all <- stack(list.ras)
> tmin.all
class : RasterStack
dimensions : 900, 2160, 1944000, 12 (nrow, ncol, ncell, nlayers)
resolution : 0.1666667, 0.1666667 (x, y)
extent : -180, 180, -60, 90 (xmin, xmax, ymin, ymax)
coord. ref. : +proj=longlat +ellps=WGS84 +towgs84=0,0,0,0,0,0,0 +no_defs
names : tmin1, tmin2, tmin3, tmin4, tmin5, tmin6, tmin7, tmin8, tmin9
, tmin10, tmin11, tmin12](https://image.slidesharecdn.com/spatialdatainr-160920190758/85/R-Data-Visualization-Spatial-data-and-Maps-in-R-Using-R-as-a-GIS-9-320.jpg)
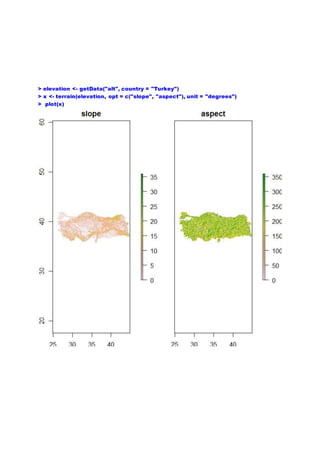
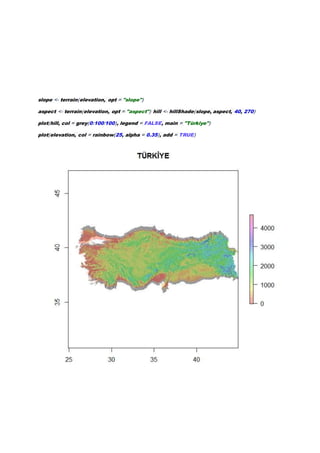
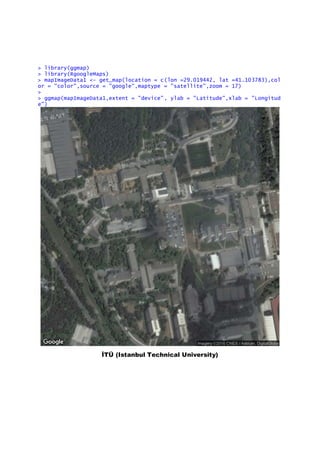

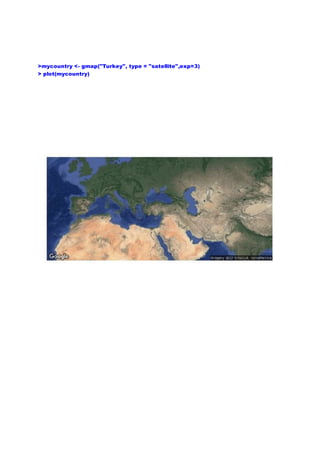
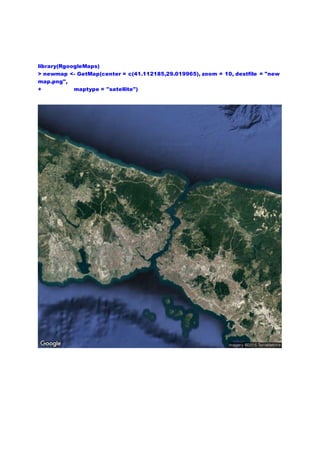
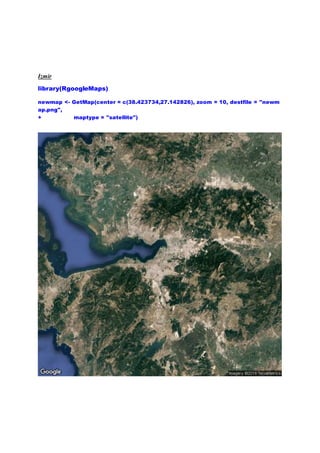
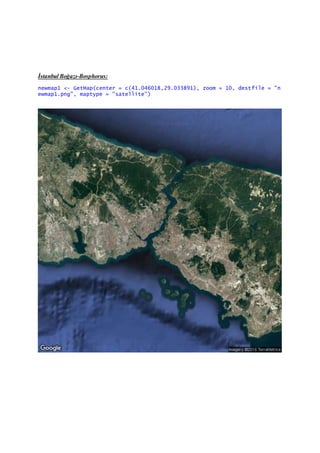
The document provides a tutorial on using R for spatial data analysis and GIS applications, focusing on library functions for handling spatial data, raster visualization, and Google Maps integration. It includes specific examples of loading temperature and elevation data for Turkey, creating maps, and visualizing terrain attributes like slope and aspect. Additionally, it demonstrates procedures for working with temperature data from WorldClim and visualizing results using ggmap.


![Spatial_Data_Analysis_with_open_source_softwares[1]](https://cdn.slidesharecdn.com/ss_thumbnails/8db4d971-8e8c-4fd8-8682-b20e5d6cd65f-161221072847-thumbnail.jpg?width=640&height=640&fit=bounds)


![Hacking-Uncovered-How-People-Get-Hacked-and-How-to-Stay-Safe[1].pptx](https://cdn.slidesharecdn.com/ss_thumbnails/hacking-uncovered-how-people-get-hacked-and-how-to-stay-safe1-260130170011-4883a9c7-thumbnail.jpg?width=640&height=640&fit=bounds)


