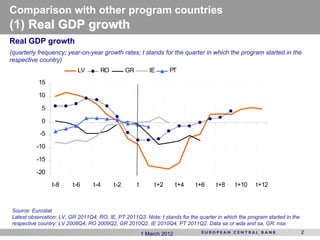
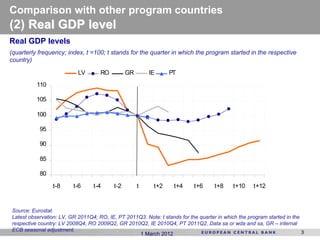
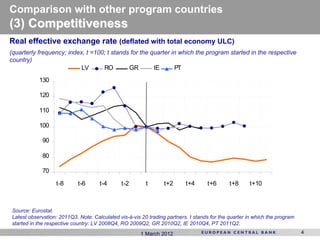
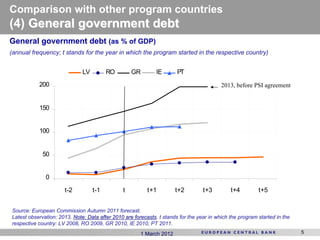
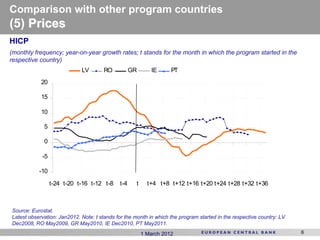
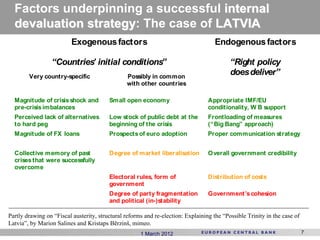
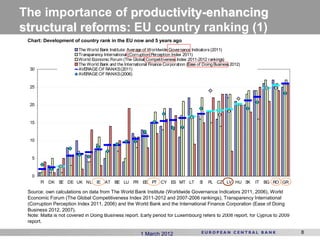
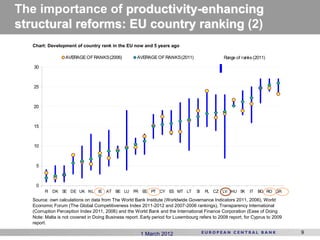
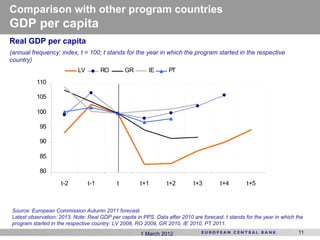
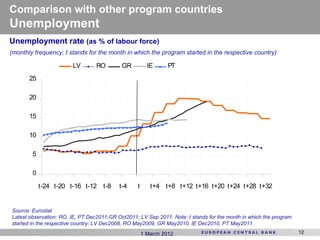
Joint Commission - Bank of Latvia Seminar
“EU balance-of-payments assistance for Latvia: Foundations of success”
        Roundtable “Lessons from Latvia, and the way forward”


 Latvia’s internal devaluation
in a cross-country perspective

                by Ettore Dorrucci,
              European Central Bank


                        1st March 2012

                             1 March 2012
Comparison with other program countries
(1) Real GDP growth
Real GDP growth
(quarterly frequency; year-on-year growth rates; t stands for the quarter in which the program started in the
respective country)
                           LV       RO          GR          IE      PT
           15

           10

            5

            0

           -5

          -10

          -15

          -20

                t-8      t-6     t-4      t-2        t        t+2       t+4   t+6    t+8     t+10    t+12


Source: Eurostat.
Latest observation: LV, GR 2011Q4; RO, IE, PT 2011Q3. Note: t stands for the quarter in which the program started in the
respective country: LV 2008Q4, RO 2009Q2, GR 2010Q2, IE 2010Q4, PT 2011Q2. Data sa or wda and sa, GR: nsa.
                                                         1 March 2012                                                      2
Comparison with other program countries
(2) Real GDP level
Real GDP levels
(quarterly frequency; index, t =100; t stands for the quarter in which the program started in the respective
country)

                           LV       RO          GR       IE      PT
          110

          105

          100

           95

           90

           85

           80

                 t-8     t-6      t-4     t-2        t     t+2     t+4      t+6     t+8     t+10    t+12


Source: Eurostat.
Latest observation: LV, GR 2011Q4; RO, IE, PT 2011Q3. Note: t stands for the quarter in which the program started in the
respective country: LV 2008Q4, RO 2009Q2, GR 2010Q2, IE 2010Q4, PT 2011Q2. Data sa or wda and sa, GR – internal
ECB seasonal adjustment.                                                                                                 3
                                                  1 March 2012
Comparison with other program countries
(3) Competitiveness
Real effective exchange rate (deflated with total economy ULC)
(quarterly frequency; index, t =100; t stands for the quarter in which the program started in the respective
country)
                           LV      RO        GR        IE      PT
           130

           120

           110

           100

             90

             80

             70

                  t-8       t-6      t-4      t-2        t       t+2      t+4      t+6       t+8     t+10


Source: Eurostat.
Latest observation: 2011Q3. Note: Calculated vis-à-vis 20 trading partners. t stands for the quarter in which the program
started in the respective country: LV 2008Q4, RO 2009Q2, GR 2010Q2, IE 2010Q4, PT 2011Q2.
                                                       1 March 2012                                                         4
Comparison with other program countries
(4) General government debt
General government debt (as % of GDP)
(annual frequency; t stands for the year in which the program started in the respective country)


                              LV         RO         GR        IE       PT
           200                                                                            2013, before PSI agreement


           150


           100


             50


              0

                      t-2          t-1          t         t+1         t+2         t+3         t+4         t+5


Source: European Commission Autumn 2011 forecast.
Latest observation: 2013. Note: Data after 2010 are forecasts. t stands for the year in which the program started in the
                                                    forecasts
respective country: LV 2008, RO 2009, GR 2010, IE 2010, PT 2011.
                                                       1 March 2012                                                        5
Comparison with other program countries
(5) Prices
HICP
(monthly frequency; year-on-year growth rates; t stands for the month in which the program started in the
respective country)
                             LV        RO          GR      IE      PT
            20

            15

            10

             5

             0

            -5

           -10

                 t-24 t-20 t-16 t-12 t-8     t-4    t     t+4 t+8 t+12 t+16 t+20 t+24 t+28 t+32 t+36


Source: Eurostat.
Latest observation: Jan2012. Note: t stands for the month in which the program started in the respective country: LV
Dec2008, RO May2009, GR May2010, IE Dec2010, PT May2011.
                                                        1 March 2012                                                   6
Factors underpinning a successful internal
  devaluation strategy: The case of LATVIA
              strategy
                          Exogenous factors                                          Endogenous factors

                 “Countries’ initial conditions”                                           “Right policy
        Very country-specific                   Possibly in common
                                                                                           does deliver”
                                                with other countries

  Magnitude of crisis shock and          Small open economy                       Appropriate IMF/EU
  pre-crisis imbalances                                                           conditionality, W B support
  Perceived lack of alternatives         Low stock of public debt at the          Frontloading of measures
  to hard peg                            beginning of the crisis                  (“Big Bang” approach)
  Magnitude of FX loans                  Prospects of euro adoption               Proper communication strategy


  Collective memory of past              Degree of market liberalisation          Overall government credibility
  crises that were successfully
  overcome
                                         Electoral rules, form of                 Distribution of costs
                                         government
                                         Degree of party fragmentation            Government’s cohesion
                                         and political (in-)stability

Partly drawing on “Fiscal austerity, structural reforms and re-election: Explaining the “Possible Trinity in the case of
Latvia”, by Marion Salines and Kristaps Bērzinš, mimeo.
                                                      1 March 2012                                                         7
The importance of productivity-enhancing
structural reforms: EU country ranking (1)
 Chart: Development of country rank in the EU now and 5 years ago
                        The World Bank Institute: Average of Worldwide Governance Indicators (2011)
                        Transparency International (Corruption Perception Index 2011)
                        World Economic Forum (The Global Competitiveness Index 2011-2012 rankings)
                        The World Bank and the International Finance Corporation (Ease of Doing Business 2012)
  30                    AVERAGE OF RANKS (2011)
                        AVERAGE OF RANKS (2006)

  25


  20


  15


  10


   5


   0
       FI   DK S DE UK NL
                E                IE AT BE LU FR EE PT CY ES MT LT                       SI   PL CZ LV HU SK      IT   BG RO GR

 Source: own calculations on data from The World Bank Institute (Worldwide Governance Indicators 2011, 2006), World
 Economic Forum (The Global Competitiveness Index 2011-2012 and 2007-2006 rankings), Transparency International
 (Corruption Perception Index 2011, 2006) and the World Bank and the International Finance Corporation (Ease of Doing
 Business 2012, 2007).
 Note: Malta is not covered in Doing Business report. Early period for Luxembourg refers to 2008 report, for Cyprus to 2009
 report.

                                                         1 March 2012                                                            8
The importance of productivity-enhancing
structural reforms: EU country ranking (2)
   Chart: Development of country rank in the EU now and 5 years ago

                   AVERAGE OF RANKS (2006)            AVERAGE OF RANKS (2011)                   Range of ranks (2011)

   30


   25


   20


   15


   10


    5


    0
        FI   DK S DE UK NL
                 E                 IE AT BE LU FR EE PT CY ES MT LT                SI   PL CZ LV HU SK       IT   BG RO GR

   Source: own calculations on data from The World Bank Institute (Worldwide Governance Indicators 2011, 2006), World
   Economic Forum (The Global Competitiveness Index 2011-2012 and 2007-2006 rankings), Transparency International
   (Corruption Perception Index 2011, 2006) and the World Bank and the International Finance Corporation (Ease of Doing
   Note: Malta is not covered in Doing Business report. Early period for Luxembourg refers to 2008 report, for Cyprus to 2009
   report.

                                                       1 March 2012                                                             9
Background slides


                1 March 2012   10
Comparison with other program countries
GDP per capita
Real GDP per capita
(annual frequency; index, t = 100; t stands for the year in which the program started in the respective
country)
                            LV         RO       GR        IE      PT
          110

          105

          100

           95

           90

           85

           80
                    t-2          t-1        t         t+1        t+2         t+3        t+4         t+5


Source: European Commission Autumn 2011 forecast.
Latest observation: 2013. Note: Real GDP per capita in PPS. Data after 2010 are forecast. t stands for the year in which the
program started in the respective country: LV 2008, RO 2009, GR 2010, IE 2010, PT 2011.
                                                      1 March 2012                                                        11
Comparison with other program countries
Unemployment
Unemployment rate (as % of labour force)
(monthly frequency; t stands for the month in which the program started in the respective country)

                        LV        RO        GR          IE      PT
       25

       20

       15

       10

        5

        0

            t-24 t-20 t-16 t-12     t-8    t-4    t      t+4 t+8 t+12 t+16 t+20 t+24 t+28 t+32


Source: Eurostat.
Latest observation: RO, IE, PT Dec2011;GR Oct2011; LV Sep 2011. Note: t stands for the month in which the program
started in the respective country: LV Dec2008, RO May2009, GR May2010, IE Dec2010, PT May2011.
                                                      1 March 2012                                                  12
Comparison with other program countries
Current account balance
Current account as % of GDP
(quarterly frequency; 4 quarter moving averages; t stands for the quarter in which the program started in the
respective country)
                             LV        RO           GR        IE         PT
             20

             10

              0

            -10

            -20

            -30

            -40

                   t-8      t-6      t-4      t-2         t        t+2        t+4   t+6    t+8     t+10


Source: Eurostat.
Latest observation: 2011Q3. Note: t stands for the quarter in which the program started in the respective country: LV
2008Q4, RO 2009Q2, GR 2010Q2, IE 2010Q4, PT 2011Q2.
                                                         1 March 2012                                                   13

Latvia's internal devaluation in a cross-country perspective

  • 1.
    Joint Commission -Bank of Latvia Seminar “EU balance-of-payments assistance for Latvia: Foundations of success” Roundtable “Lessons from Latvia, and the way forward” Latvia’s internal devaluation in a cross-country perspective by Ettore Dorrucci, European Central Bank 1st March 2012 1 March 2012
  • 2.
    Comparison with otherprogram countries (1) Real GDP growth Real GDP growth (quarterly frequency; year-on-year growth rates; t stands for the quarter in which the program started in the respective country) LV RO GR IE PT 15 10 5 0 -5 -10 -15 -20 t-8 t-6 t-4 t-2 t t+2 t+4 t+6 t+8 t+10 t+12 Source: Eurostat. Latest observation: LV, GR 2011Q4; RO, IE, PT 2011Q3. Note: t stands for the quarter in which the program started in the respective country: LV 2008Q4, RO 2009Q2, GR 2010Q2, IE 2010Q4, PT 2011Q2. Data sa or wda and sa, GR: nsa. 1 March 2012 2
  • 3.
    Comparison with otherprogram countries (2) Real GDP level Real GDP levels (quarterly frequency; index, t =100; t stands for the quarter in which the program started in the respective country) LV RO GR IE PT 110 105 100 95 90 85 80 t-8 t-6 t-4 t-2 t t+2 t+4 t+6 t+8 t+10 t+12 Source: Eurostat. Latest observation: LV, GR 2011Q4; RO, IE, PT 2011Q3. Note: t stands for the quarter in which the program started in the respective country: LV 2008Q4, RO 2009Q2, GR 2010Q2, IE 2010Q4, PT 2011Q2. Data sa or wda and sa, GR – internal ECB seasonal adjustment. 3 1 March 2012
  • 4.
    Comparison with otherprogram countries (3) Competitiveness Real effective exchange rate (deflated with total economy ULC) (quarterly frequency; index, t =100; t stands for the quarter in which the program started in the respective country) LV RO GR IE PT 130 120 110 100 90 80 70 t-8 t-6 t-4 t-2 t t+2 t+4 t+6 t+8 t+10 Source: Eurostat. Latest observation: 2011Q3. Note: Calculated vis-à-vis 20 trading partners. t stands for the quarter in which the program started in the respective country: LV 2008Q4, RO 2009Q2, GR 2010Q2, IE 2010Q4, PT 2011Q2. 1 March 2012 4
  • 5.
    Comparison with otherprogram countries (4) General government debt General government debt (as % of GDP) (annual frequency; t stands for the year in which the program started in the respective country) LV RO GR IE PT 200 2013, before PSI agreement 150 100 50 0 t-2 t-1 t t+1 t+2 t+3 t+4 t+5 Source: European Commission Autumn 2011 forecast. Latest observation: 2013. Note: Data after 2010 are forecasts. t stands for the year in which the program started in the forecasts respective country: LV 2008, RO 2009, GR 2010, IE 2010, PT 2011. 1 March 2012 5
  • 6.
    Comparison with otherprogram countries (5) Prices HICP (monthly frequency; year-on-year growth rates; t stands for the month in which the program started in the respective country) LV RO GR IE PT 20 15 10 5 0 -5 -10 t-24 t-20 t-16 t-12 t-8 t-4 t t+4 t+8 t+12 t+16 t+20 t+24 t+28 t+32 t+36 Source: Eurostat. Latest observation: Jan2012. Note: t stands for the month in which the program started in the respective country: LV Dec2008, RO May2009, GR May2010, IE Dec2010, PT May2011. 1 March 2012 6
  • 7.
    Factors underpinning asuccessful internal devaluation strategy: The case of LATVIA strategy Exogenous factors Endogenous factors “Countries’ initial conditions” “Right policy Very country-specific Possibly in common does deliver” with other countries Magnitude of crisis shock and Small open economy Appropriate IMF/EU pre-crisis imbalances conditionality, W B support Perceived lack of alternatives Low stock of public debt at the Frontloading of measures to hard peg beginning of the crisis (“Big Bang” approach) Magnitude of FX loans Prospects of euro adoption Proper communication strategy Collective memory of past Degree of market liberalisation Overall government credibility crises that were successfully overcome Electoral rules, form of Distribution of costs government Degree of party fragmentation Government’s cohesion and political (in-)stability Partly drawing on “Fiscal austerity, structural reforms and re-election: Explaining the “Possible Trinity in the case of Latvia”, by Marion Salines and Kristaps Bērzinš, mimeo. 1 March 2012 7
  • 8.
    The importance ofproductivity-enhancing structural reforms: EU country ranking (1) Chart: Development of country rank in the EU now and 5 years ago The World Bank Institute: Average of Worldwide Governance Indicators (2011) Transparency International (Corruption Perception Index 2011) World Economic Forum (The Global Competitiveness Index 2011-2012 rankings) The World Bank and the International Finance Corporation (Ease of Doing Business 2012) 30 AVERAGE OF RANKS (2011) AVERAGE OF RANKS (2006) 25 20 15 10 5 0 FI DK S DE UK NL E IE AT BE LU FR EE PT CY ES MT LT SI PL CZ LV HU SK IT BG RO GR Source: own calculations on data from The World Bank Institute (Worldwide Governance Indicators 2011, 2006), World Economic Forum (The Global Competitiveness Index 2011-2012 and 2007-2006 rankings), Transparency International (Corruption Perception Index 2011, 2006) and the World Bank and the International Finance Corporation (Ease of Doing Business 2012, 2007). Note: Malta is not covered in Doing Business report. Early period for Luxembourg refers to 2008 report, for Cyprus to 2009 report. 1 March 2012 8
  • 9.
    The importance ofproductivity-enhancing structural reforms: EU country ranking (2) Chart: Development of country rank in the EU now and 5 years ago AVERAGE OF RANKS (2006) AVERAGE OF RANKS (2011) Range of ranks (2011) 30 25 20 15 10 5 0 FI DK S DE UK NL E IE AT BE LU FR EE PT CY ES MT LT SI PL CZ LV HU SK IT BG RO GR Source: own calculations on data from The World Bank Institute (Worldwide Governance Indicators 2011, 2006), World Economic Forum (The Global Competitiveness Index 2011-2012 and 2007-2006 rankings), Transparency International (Corruption Perception Index 2011, 2006) and the World Bank and the International Finance Corporation (Ease of Doing Note: Malta is not covered in Doing Business report. Early period for Luxembourg refers to 2008 report, for Cyprus to 2009 report. 1 March 2012 9
  • 10.
    Background slides 1 March 2012 10
  • 11.
    Comparison with otherprogram countries GDP per capita Real GDP per capita (annual frequency; index, t = 100; t stands for the year in which the program started in the respective country) LV RO GR IE PT 110 105 100 95 90 85 80 t-2 t-1 t t+1 t+2 t+3 t+4 t+5 Source: European Commission Autumn 2011 forecast. Latest observation: 2013. Note: Real GDP per capita in PPS. Data after 2010 are forecast. t stands for the year in which the program started in the respective country: LV 2008, RO 2009, GR 2010, IE 2010, PT 2011. 1 March 2012 11
  • 12.
    Comparison with otherprogram countries Unemployment Unemployment rate (as % of labour force) (monthly frequency; t stands for the month in which the program started in the respective country) LV RO GR IE PT 25 20 15 10 5 0 t-24 t-20 t-16 t-12 t-8 t-4 t t+4 t+8 t+12 t+16 t+20 t+24 t+28 t+32 Source: Eurostat. Latest observation: RO, IE, PT Dec2011;GR Oct2011; LV Sep 2011. Note: t stands for the month in which the program started in the respective country: LV Dec2008, RO May2009, GR May2010, IE Dec2010, PT May2011. 1 March 2012 12
  • 13.
    Comparison with otherprogram countries Current account balance Current account as % of GDP (quarterly frequency; 4 quarter moving averages; t stands for the quarter in which the program started in the respective country) LV RO GR IE PT 20 10 0 -10 -20 -30 -40 t-8 t-6 t-4 t-2 t t+2 t+4 t+6 t+8 t+10 Source: Eurostat. Latest observation: 2011Q3. Note: t stands for the quarter in which the program started in the respective country: LV 2008Q4, RO 2009Q2, GR 2010Q2, IE 2010Q4, PT 2011Q2. 1 March 2012 13