Download to read offline

![Disclaimer
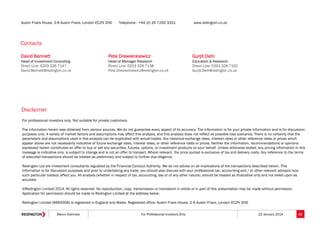
The views and opinions contained herein are those of Neil Williams, director, chief economist & strategist, and may not necessarily represent views expressed or reflected in other Hermes communications,
strategies or products. The information herein is believed to be reliable but Hermes Funds Managers does not warrant its completeness or accuracy. No responsibility can be accepted for errors of fact or
opinion. This material is not intended to provide and should not be relied on for accounting, legal or tax advice, or investment recommendations.
This document has no regard to the specific investment objectives, financial situation or particular needs of any specific recipient. This document is published solely for informational purposes and is not to be
construed as a solicitation or an offer to buy or sell any securities or related financial instruments.
This communication is directed only at recipients who are eligible counterparties or professional clients, as defined in the Glossary to the Financial Conduct Authority’s Handbook of Rules and Guidance. This
communication is issued and approved only for the purposes of section 21 of the Financial Services and Markets Act 2000 by Hermes Investment Management Limited. (“HIML”). Hermes Investment
Management Limited has its registered office at Lloyds Chambers, 1 Portsoken Street, London E1 8HZ. Hermes is a multi-boutique asset manager, independent of any broader financial services organisation.
Each Hermes operating company is either a subsidiary of, or is otherwise affiliated to, Hermes Fund Managers Limited. [CM100322 UK 11/10]
Figures, unless otherwise indicated, are sourced from Hermes.
Hermes Fund Managers Ltd I Global Economic Outlook I
Page 56](https://image.slidesharecdn.com/macrooverview-140123085027-phpapp02/85/Macro-Overview-56-320.jpg)
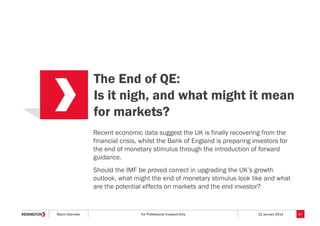


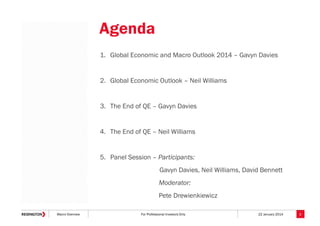
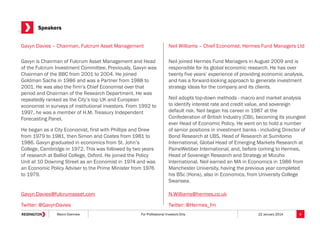
This document provides an overview and agenda for a macroeconomic conference on January 22nd, 2014. It introduces the two main speakers, Gavyn Davies and Neil Williams, and gives brief biographies of each. The agenda includes presentations by Davies on the global economic outlook for 2014 and the end of quantitative easing programs. Williams will also present on the global economic outlook and end of quantitative easing. There will be a panel session at the end with both speakers and a moderator. The document provides context for the conference and introduces the expert presenters.


