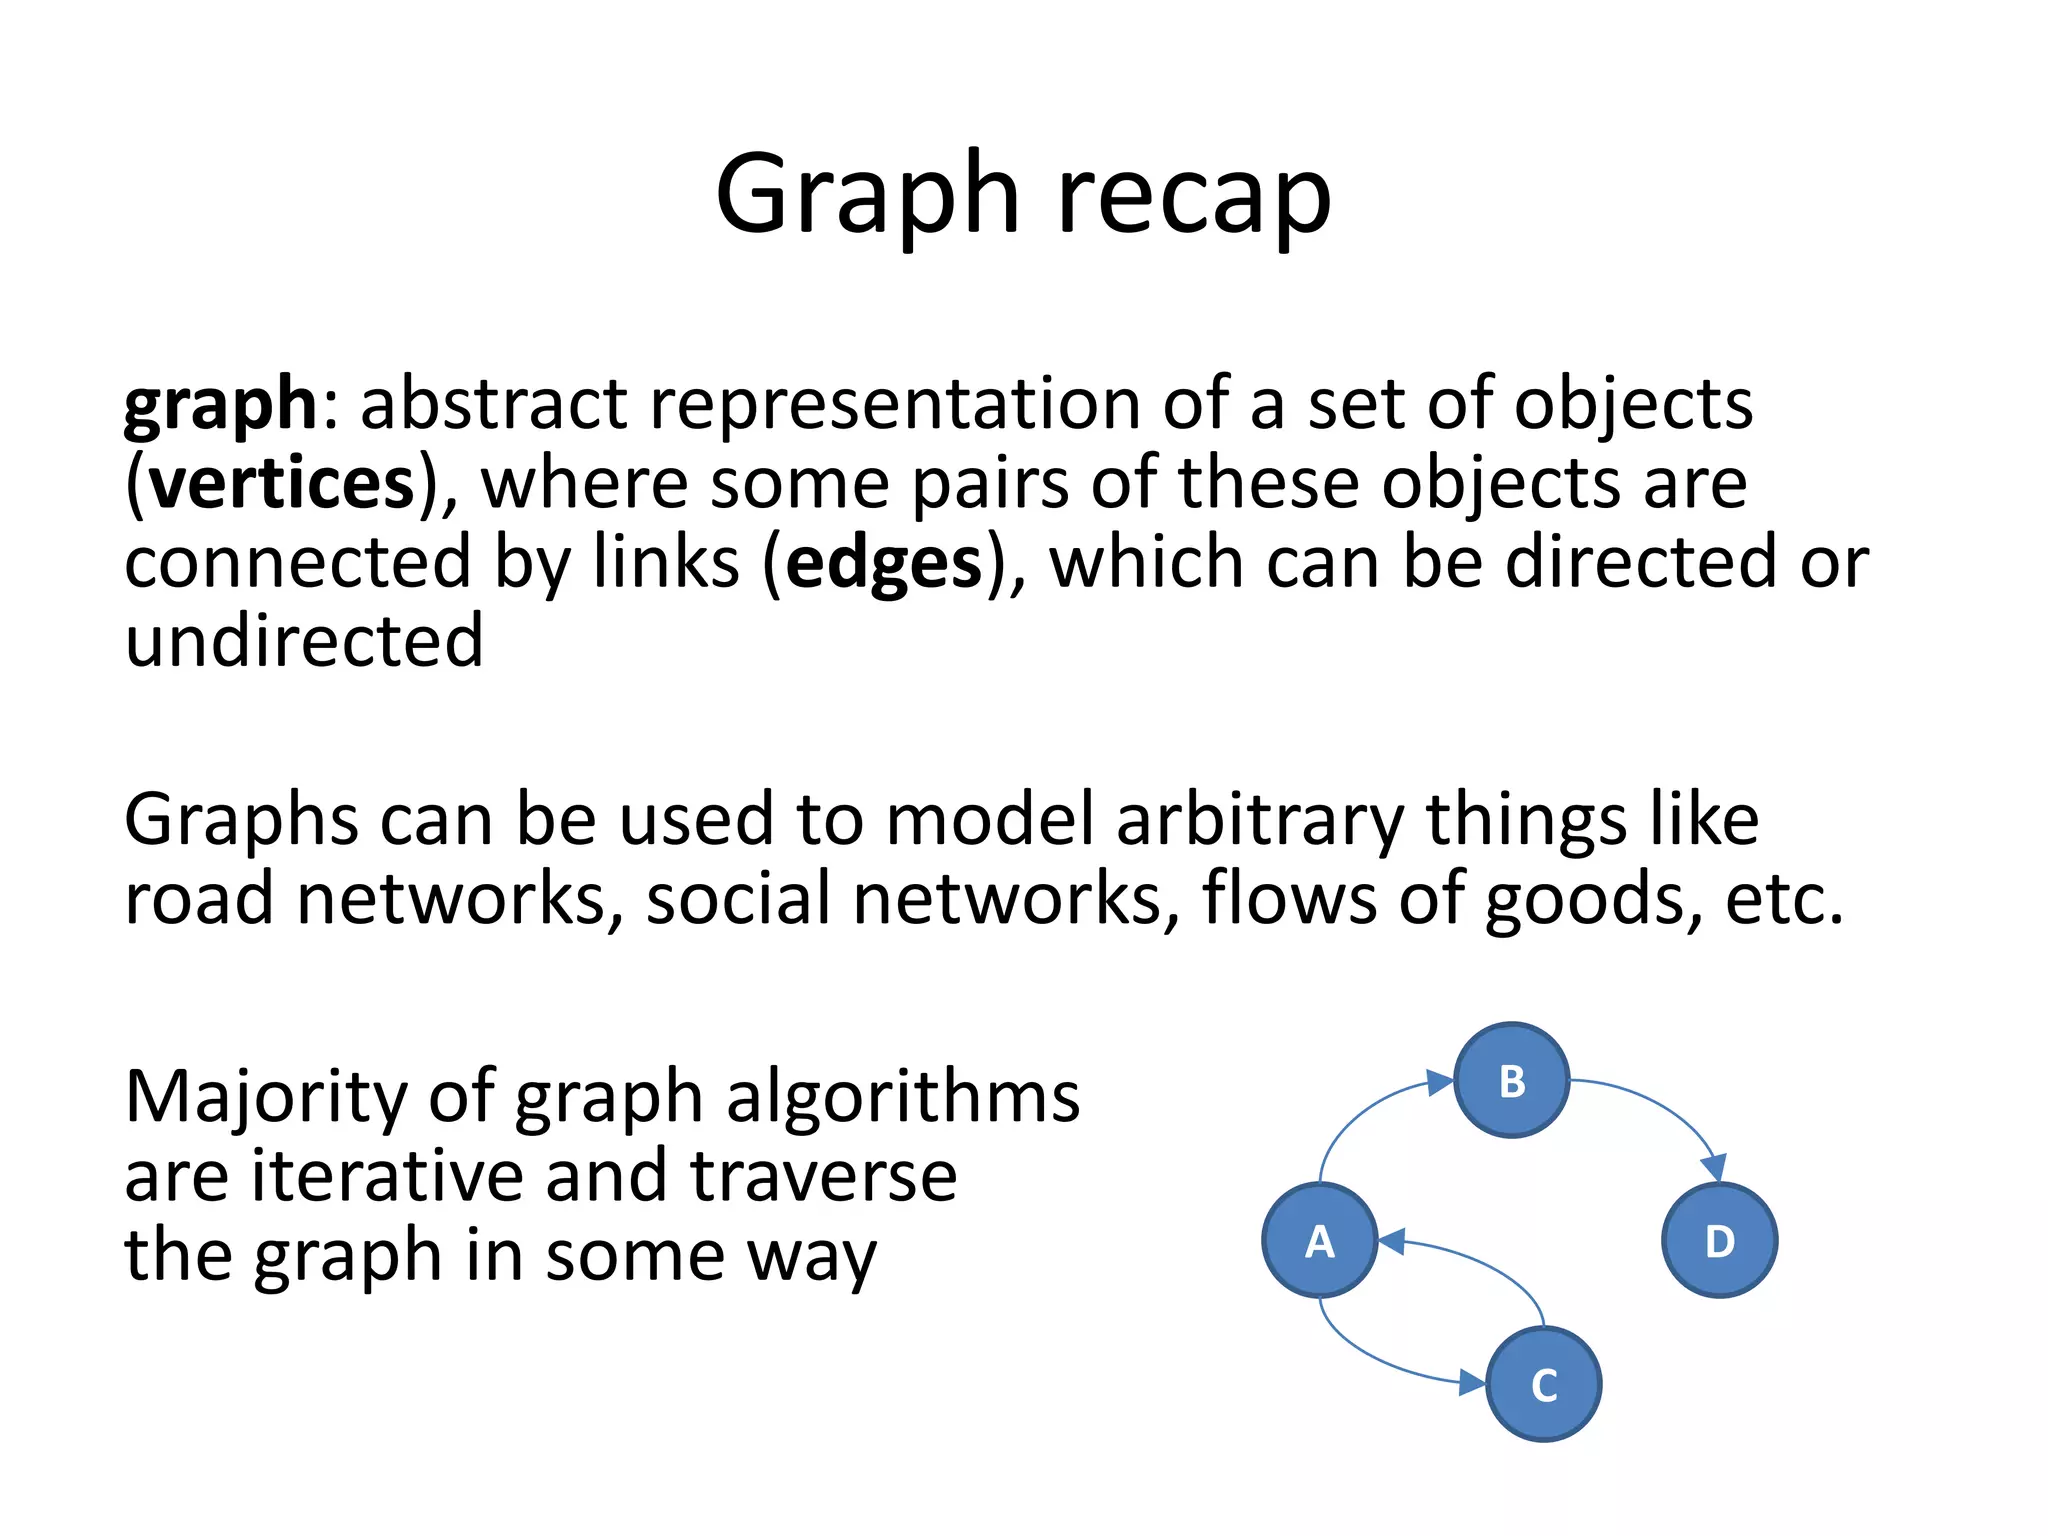
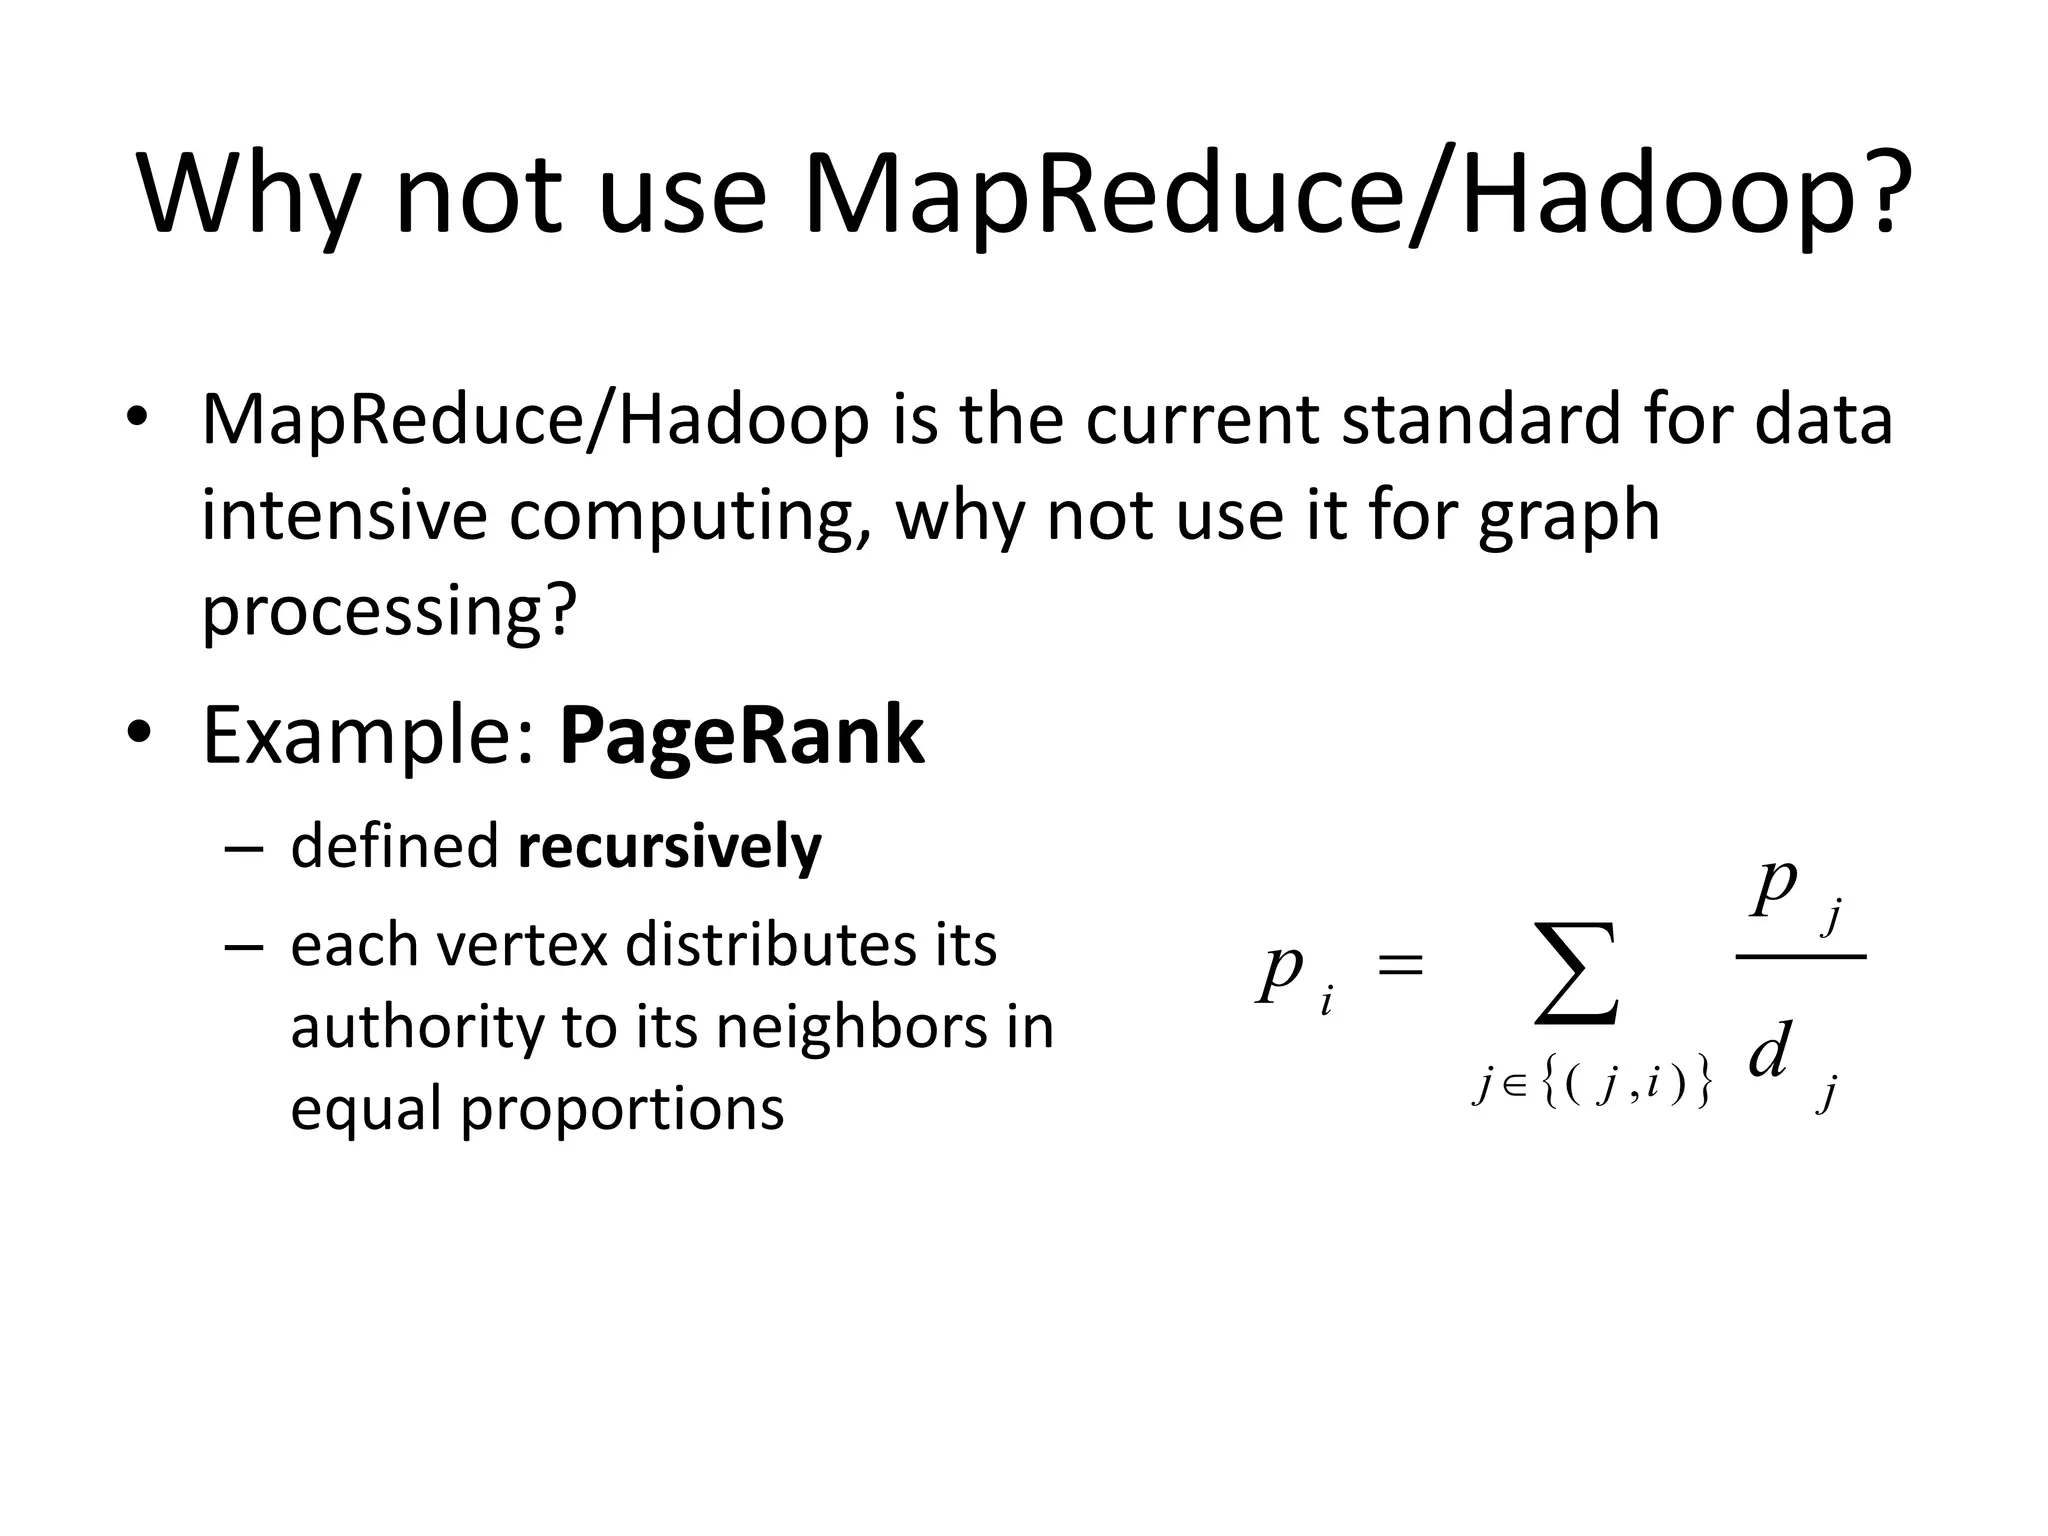
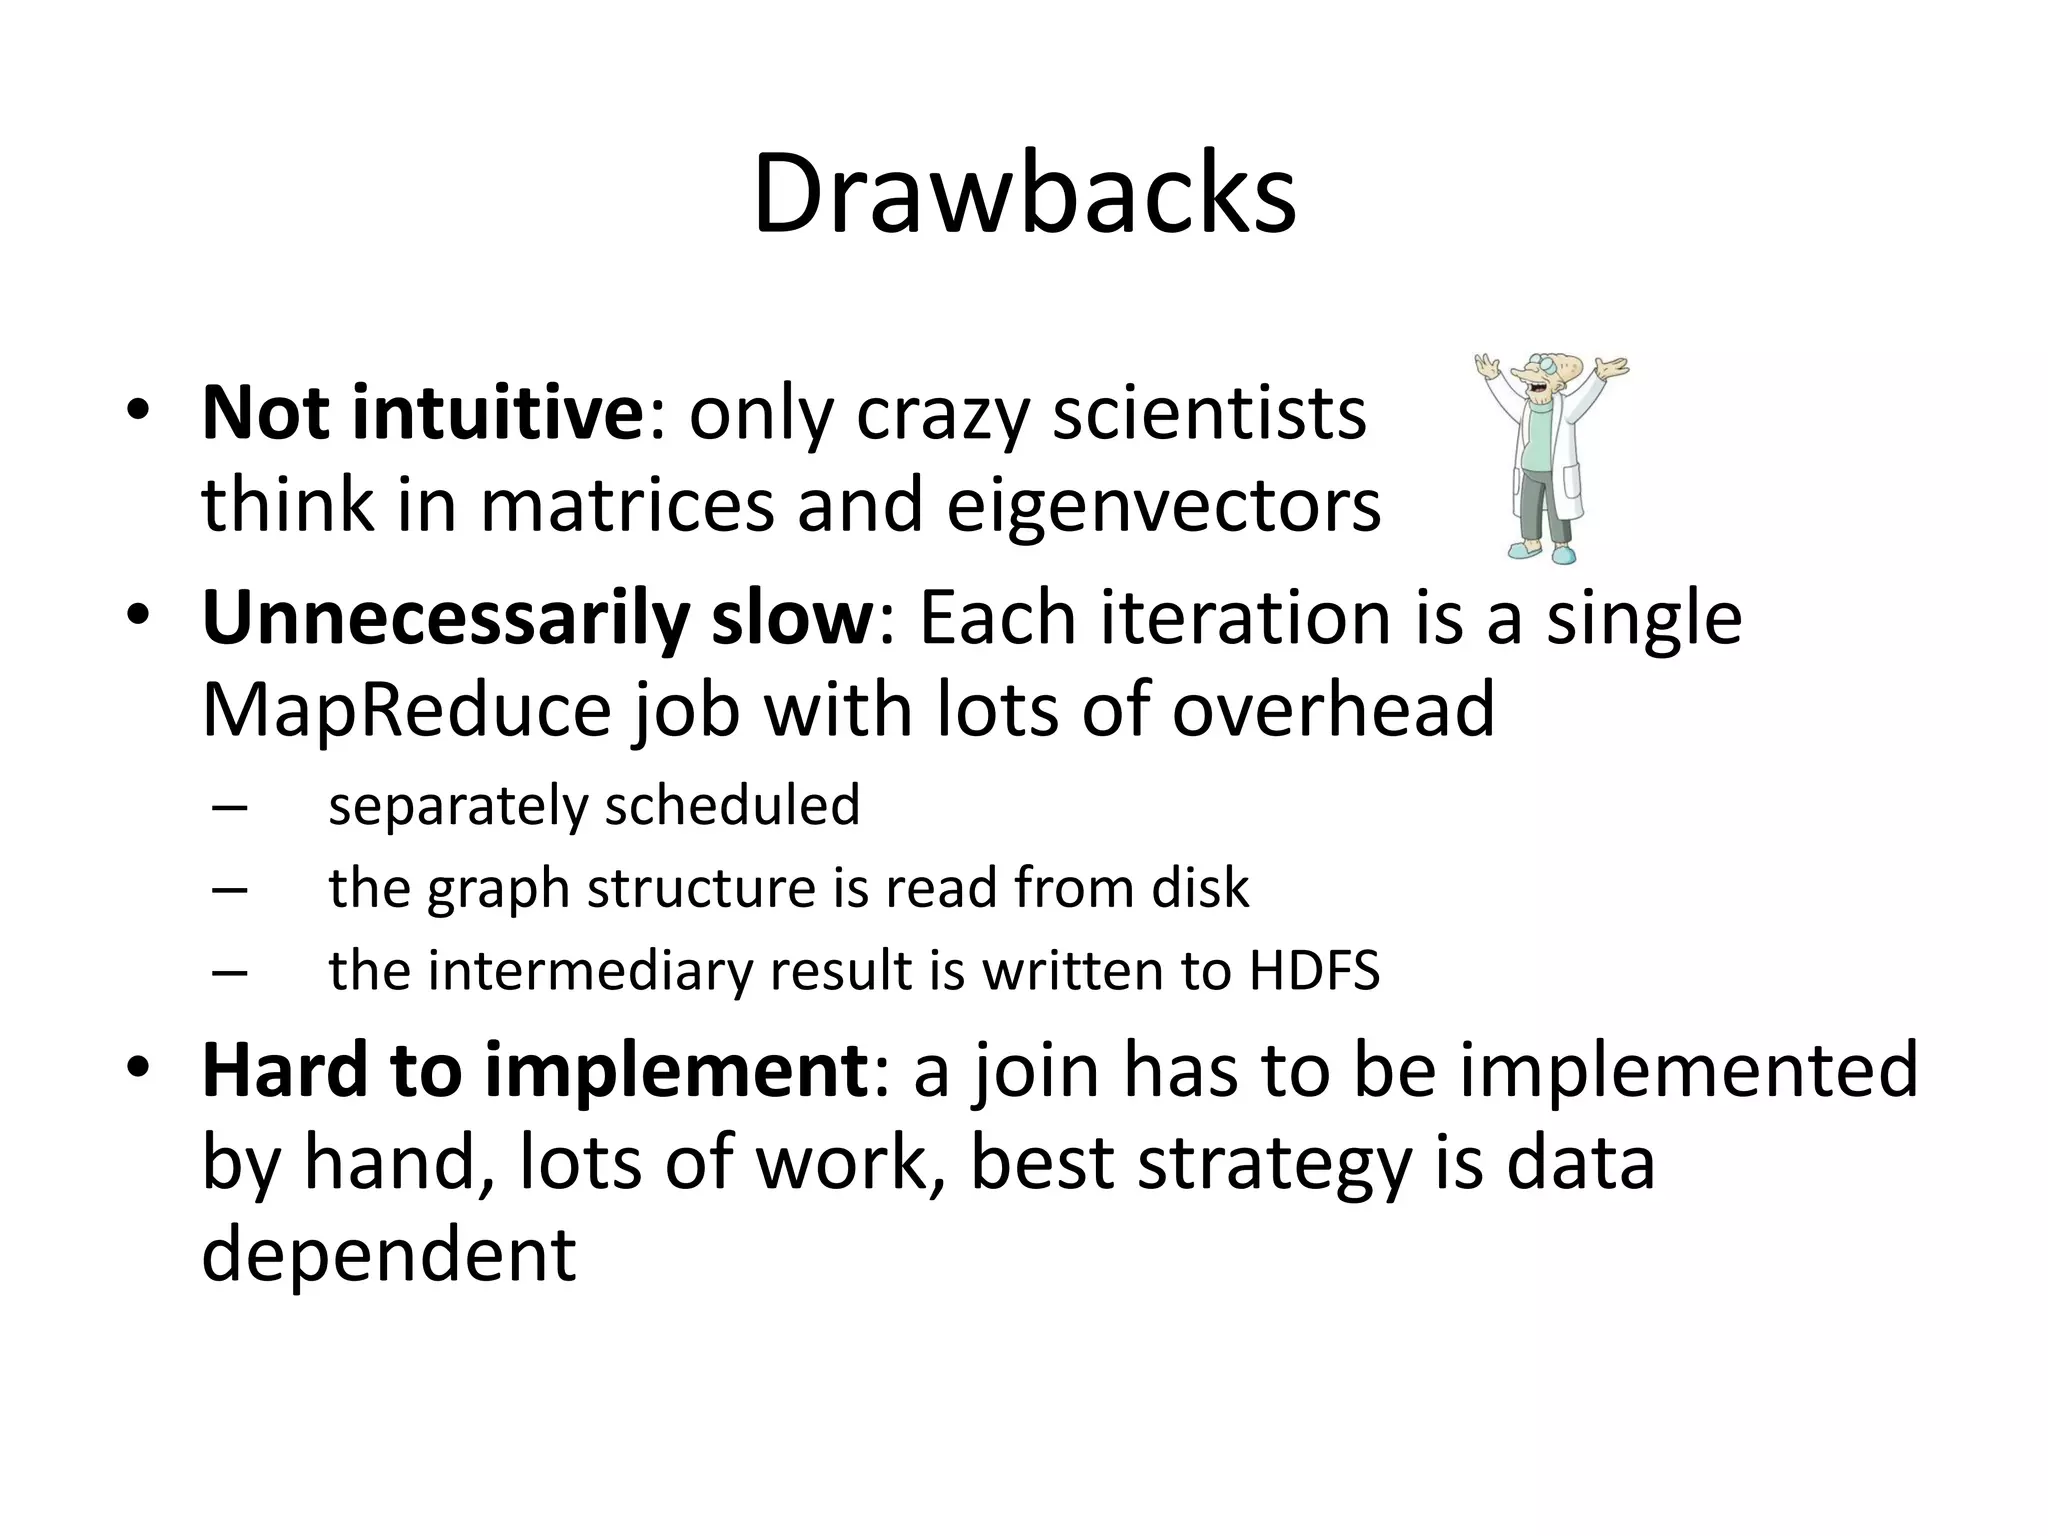
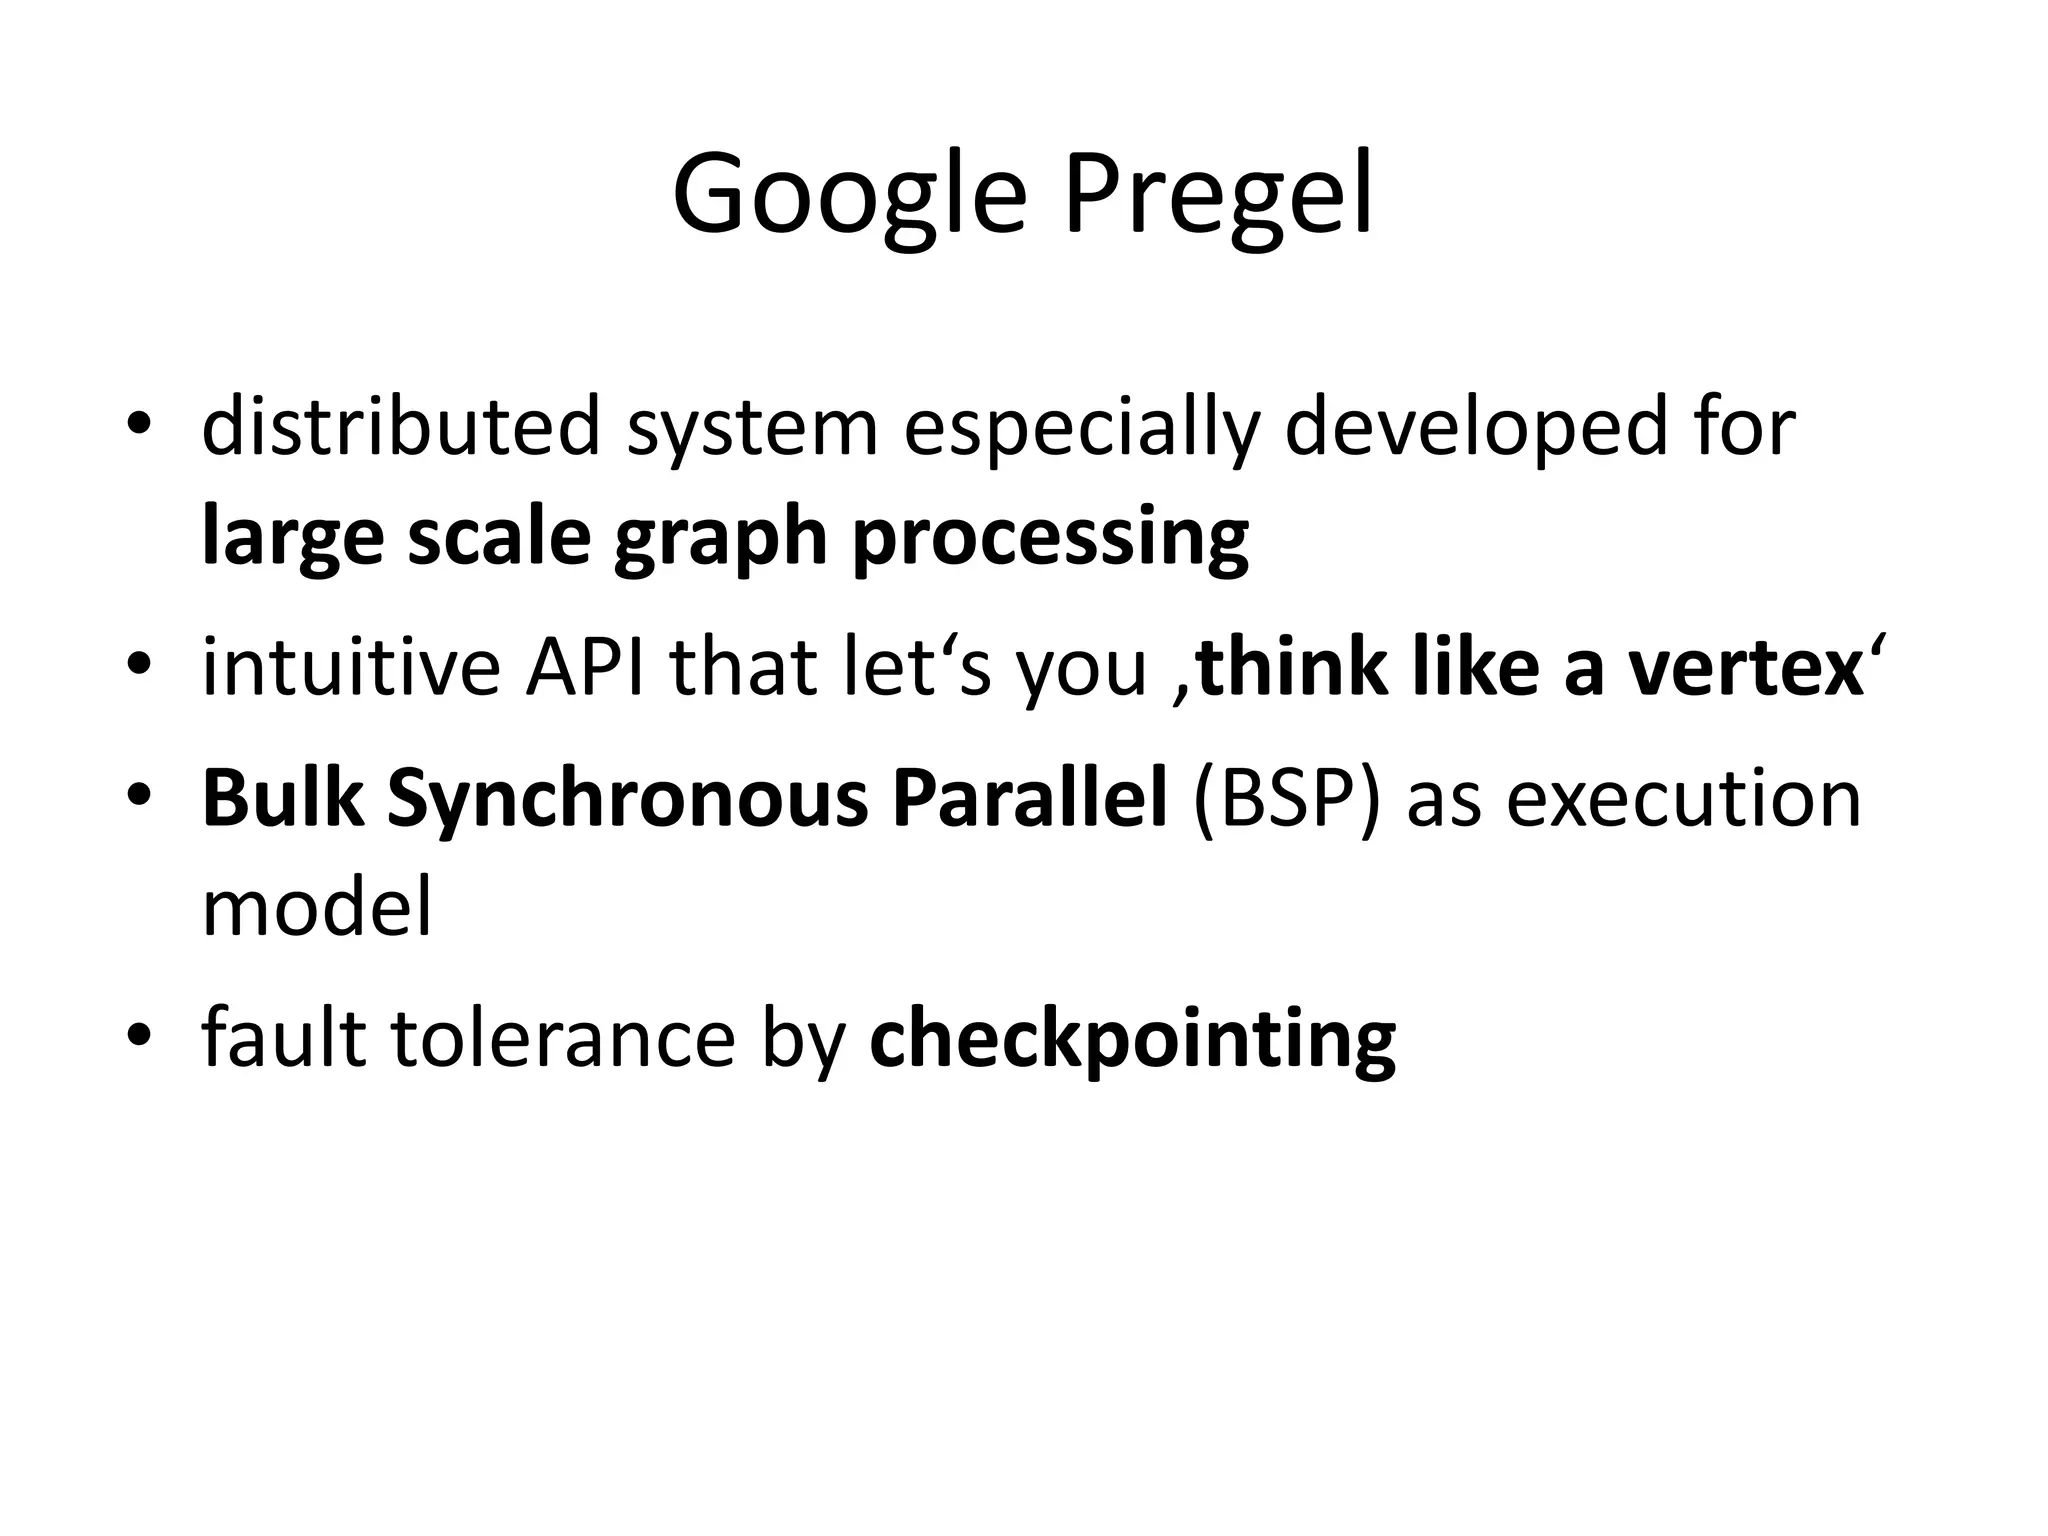
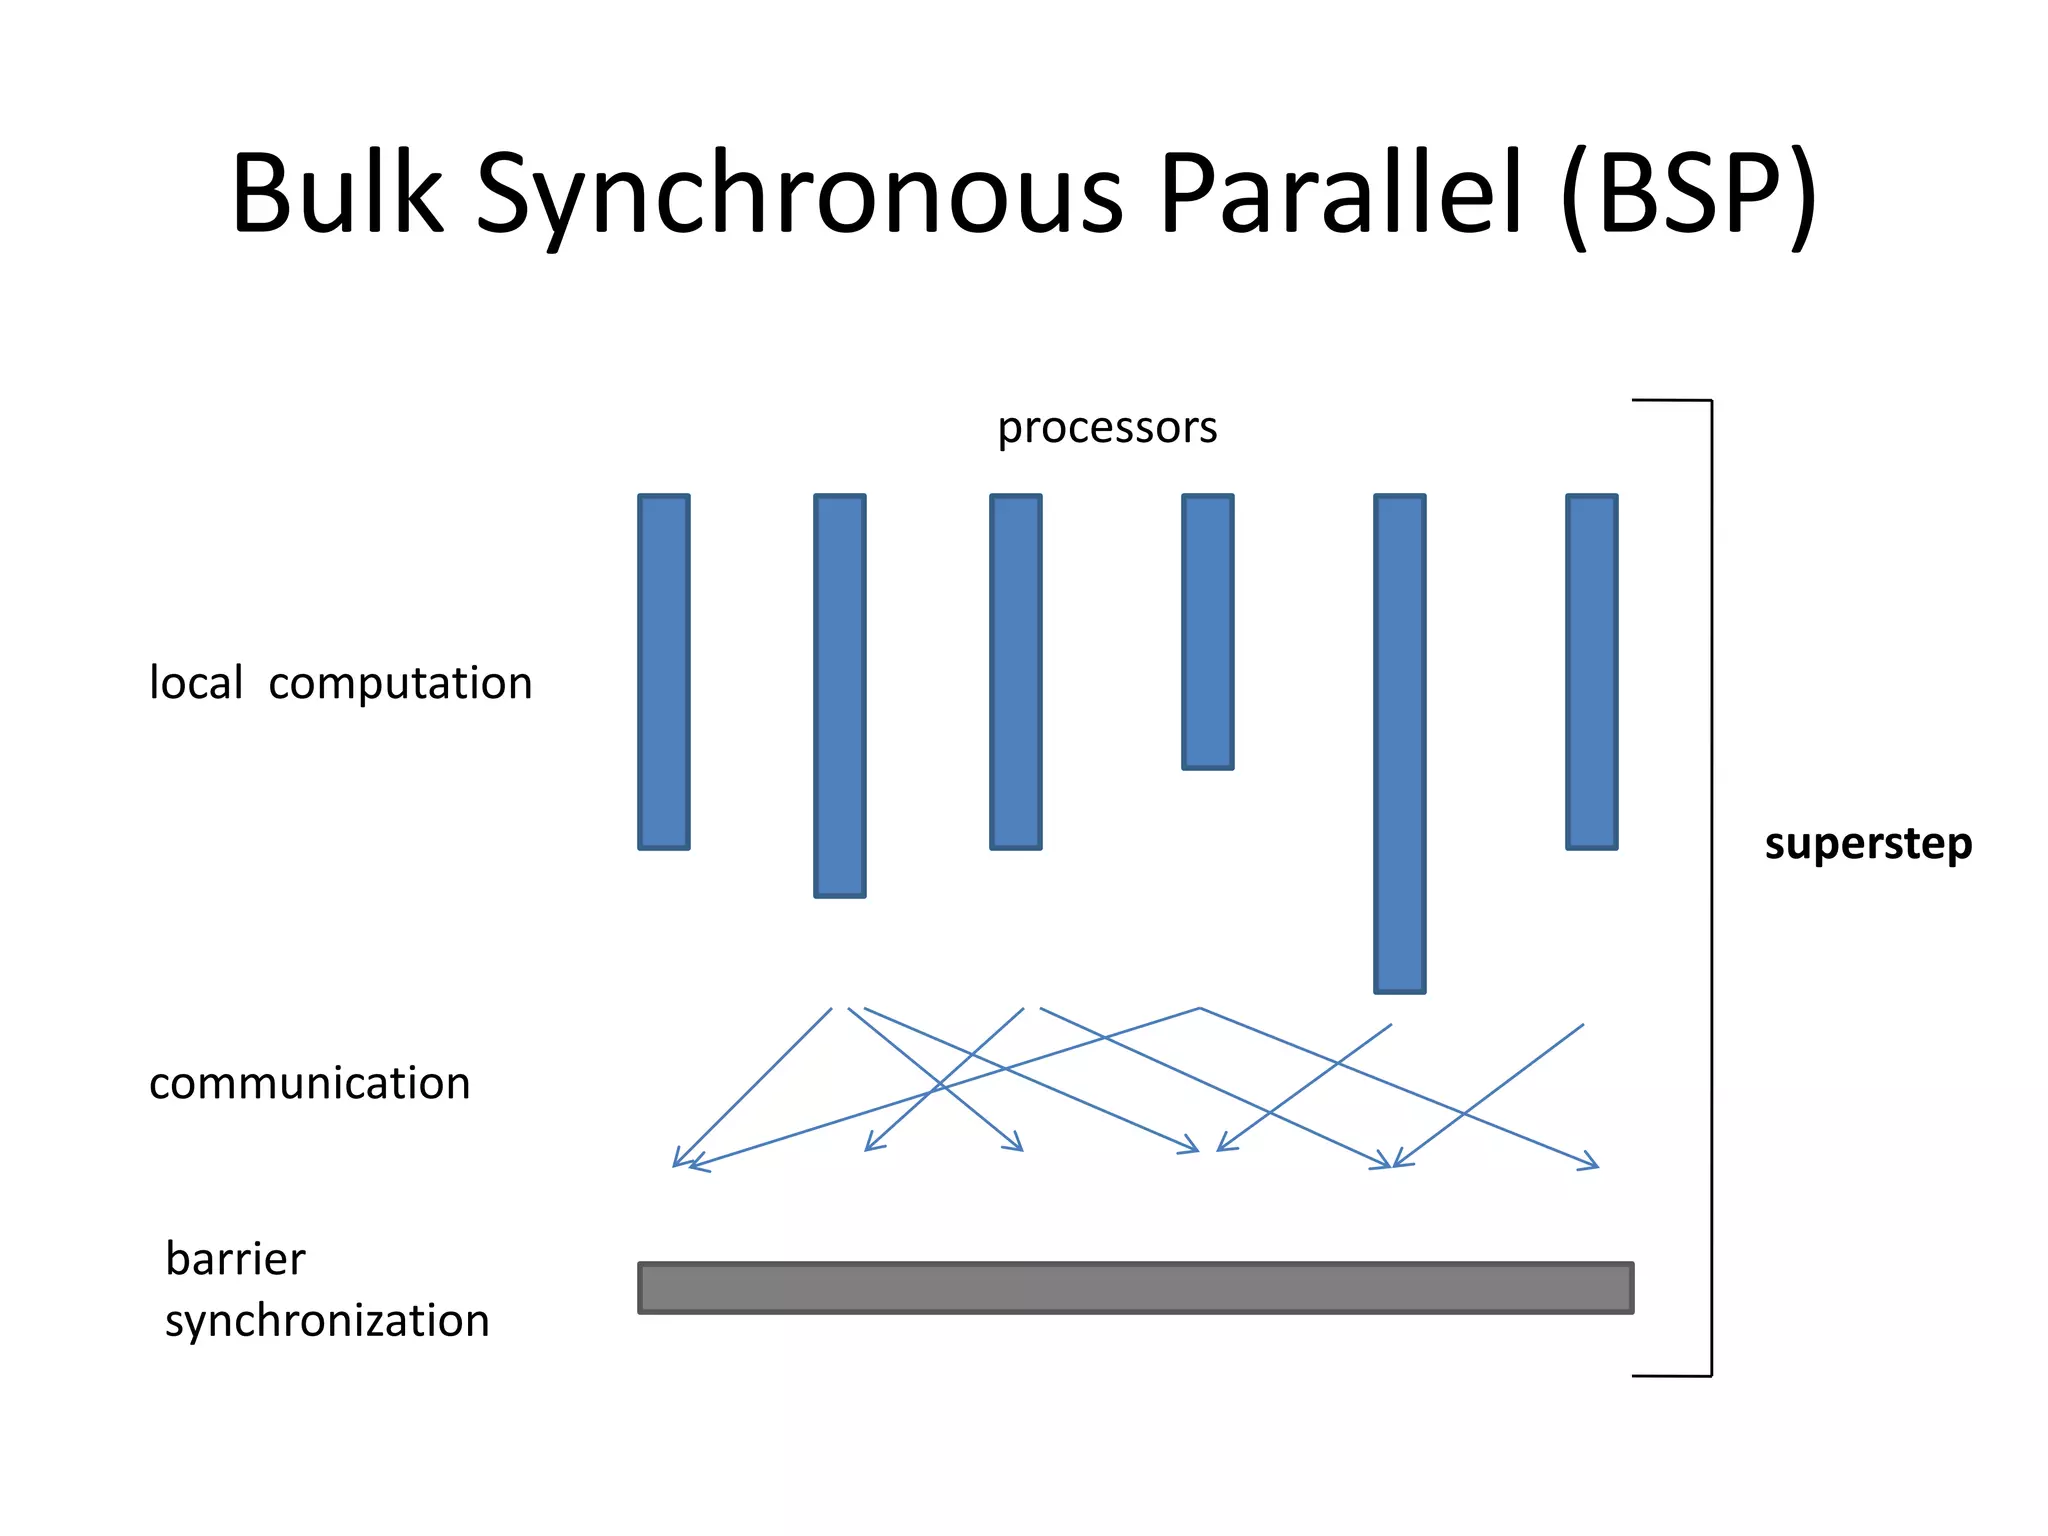
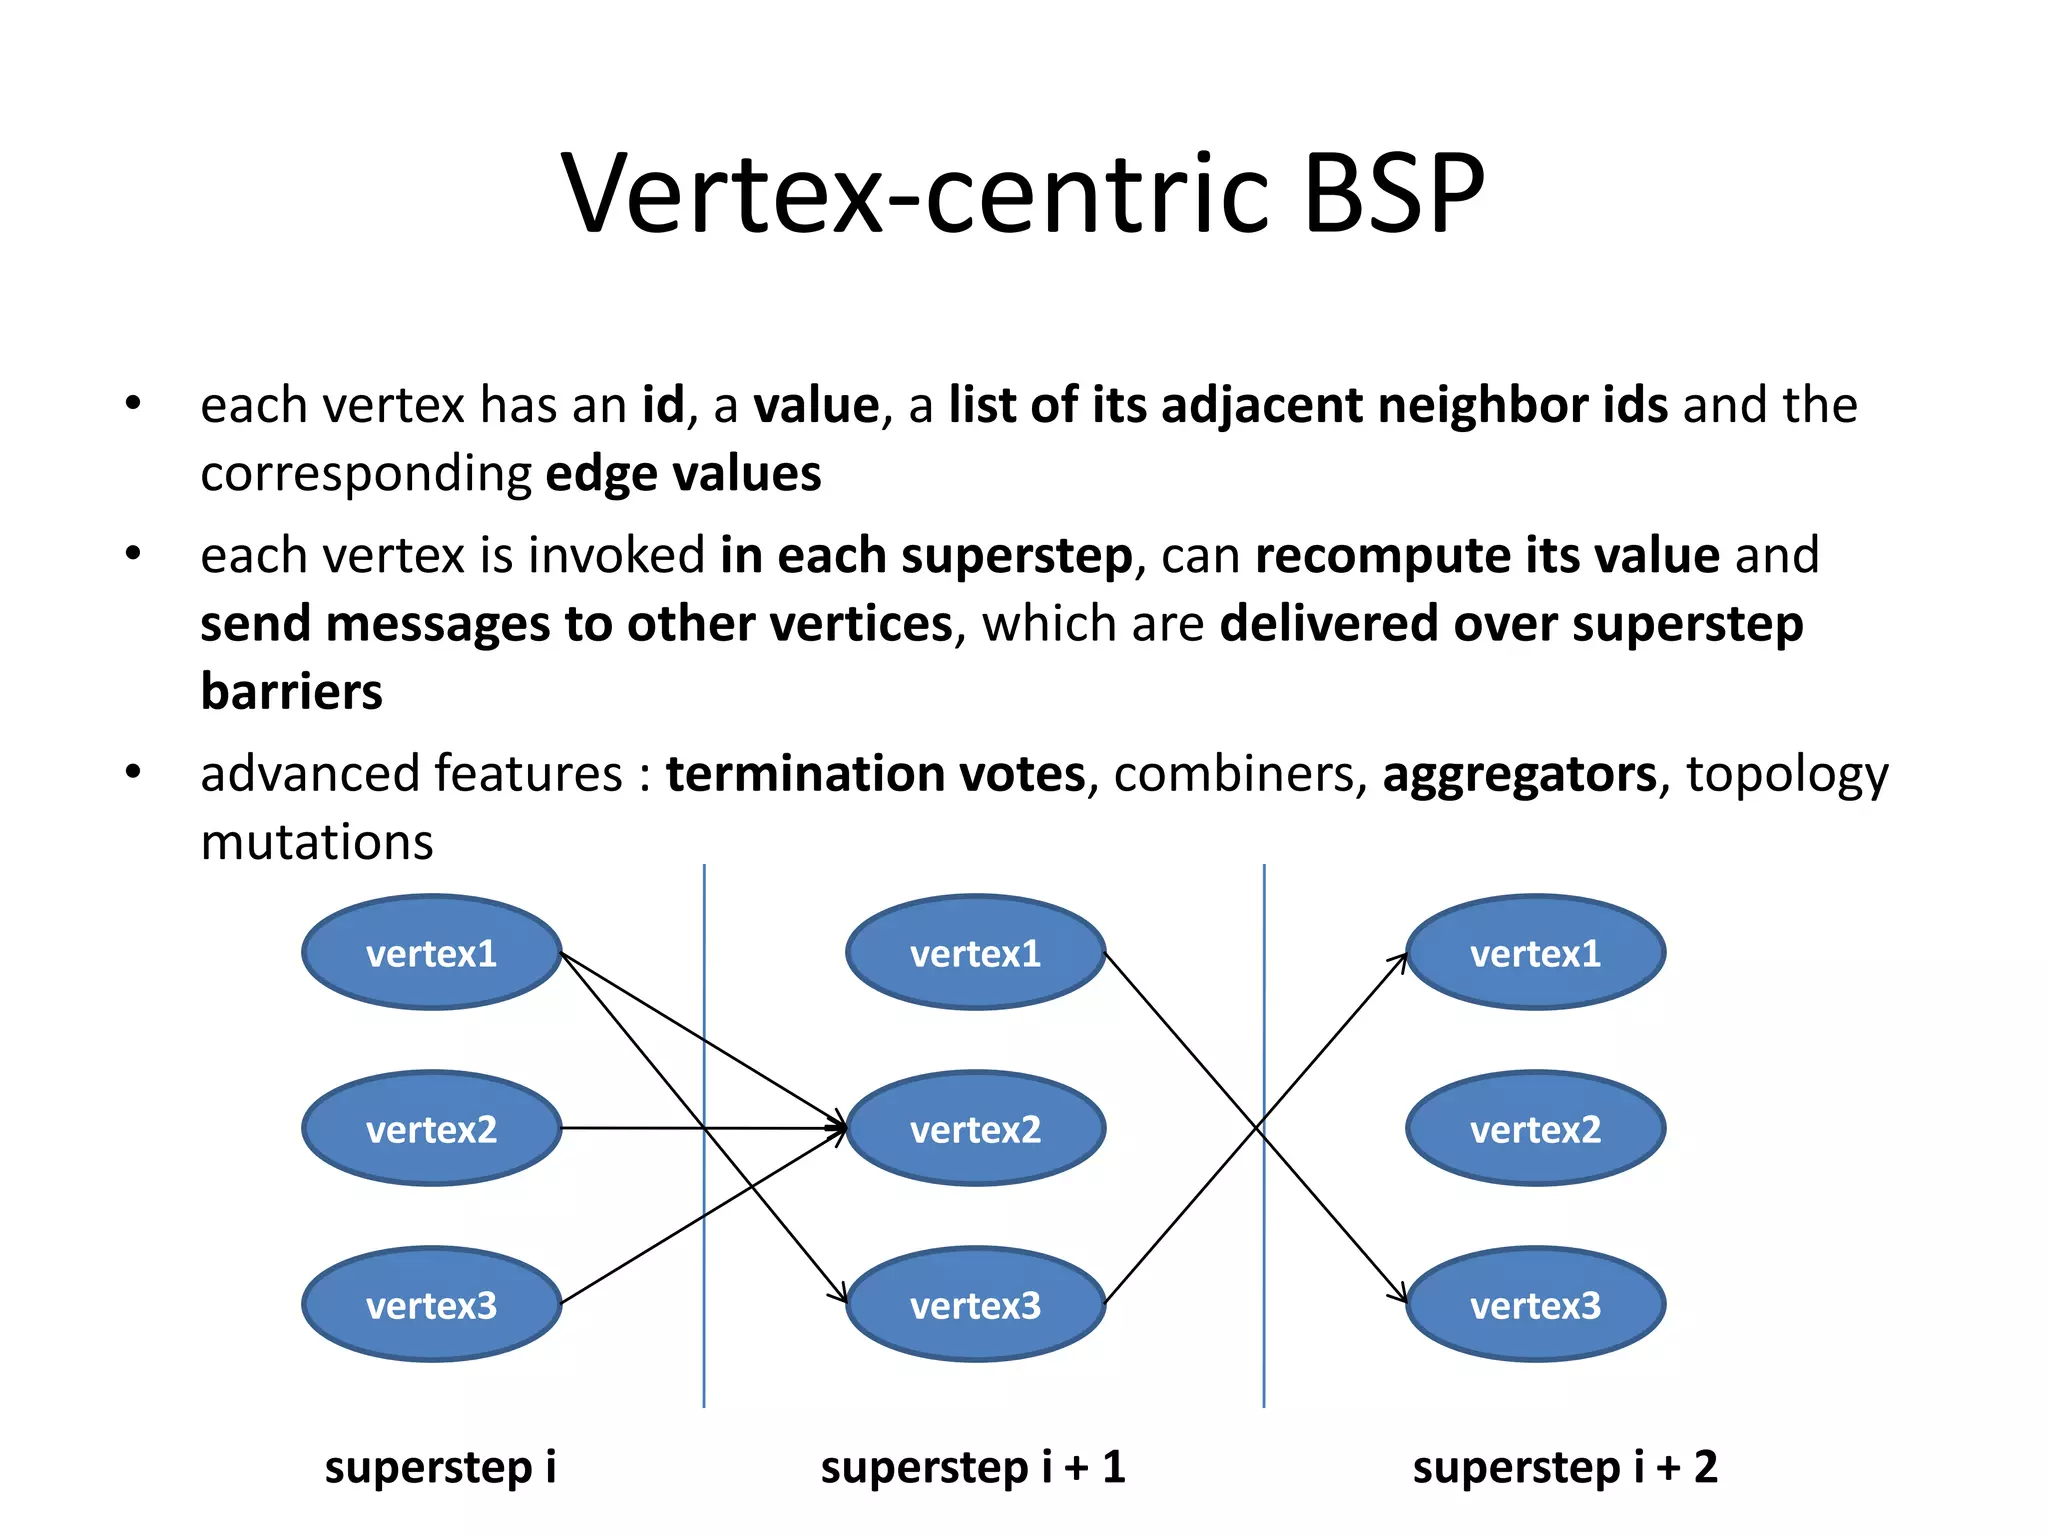
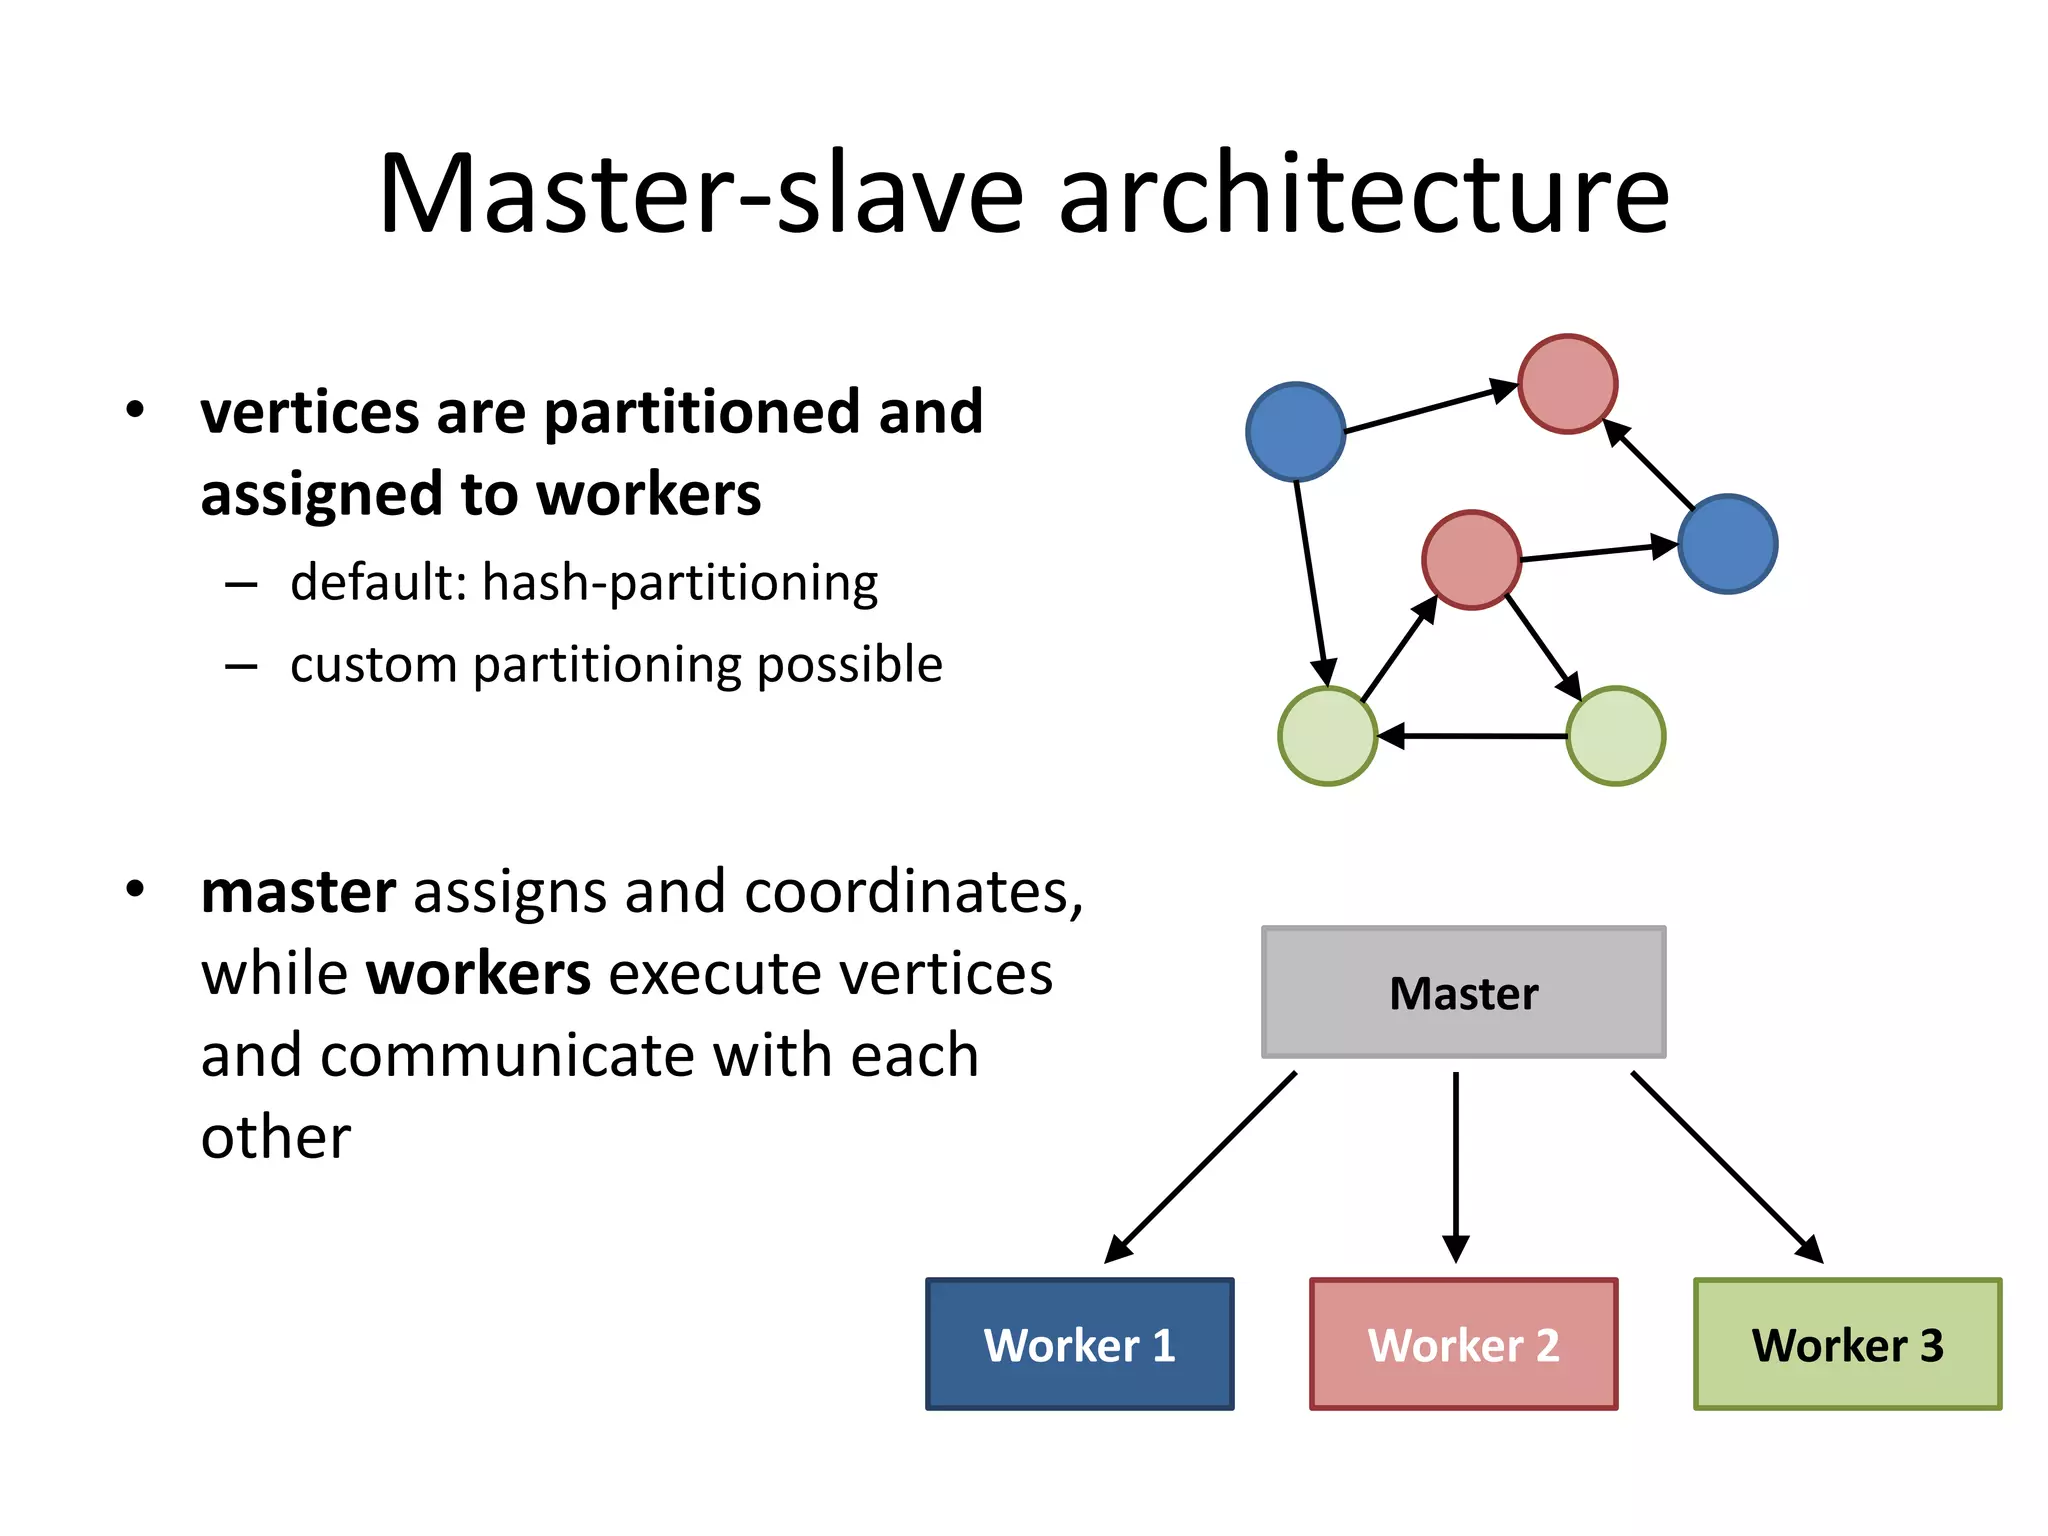
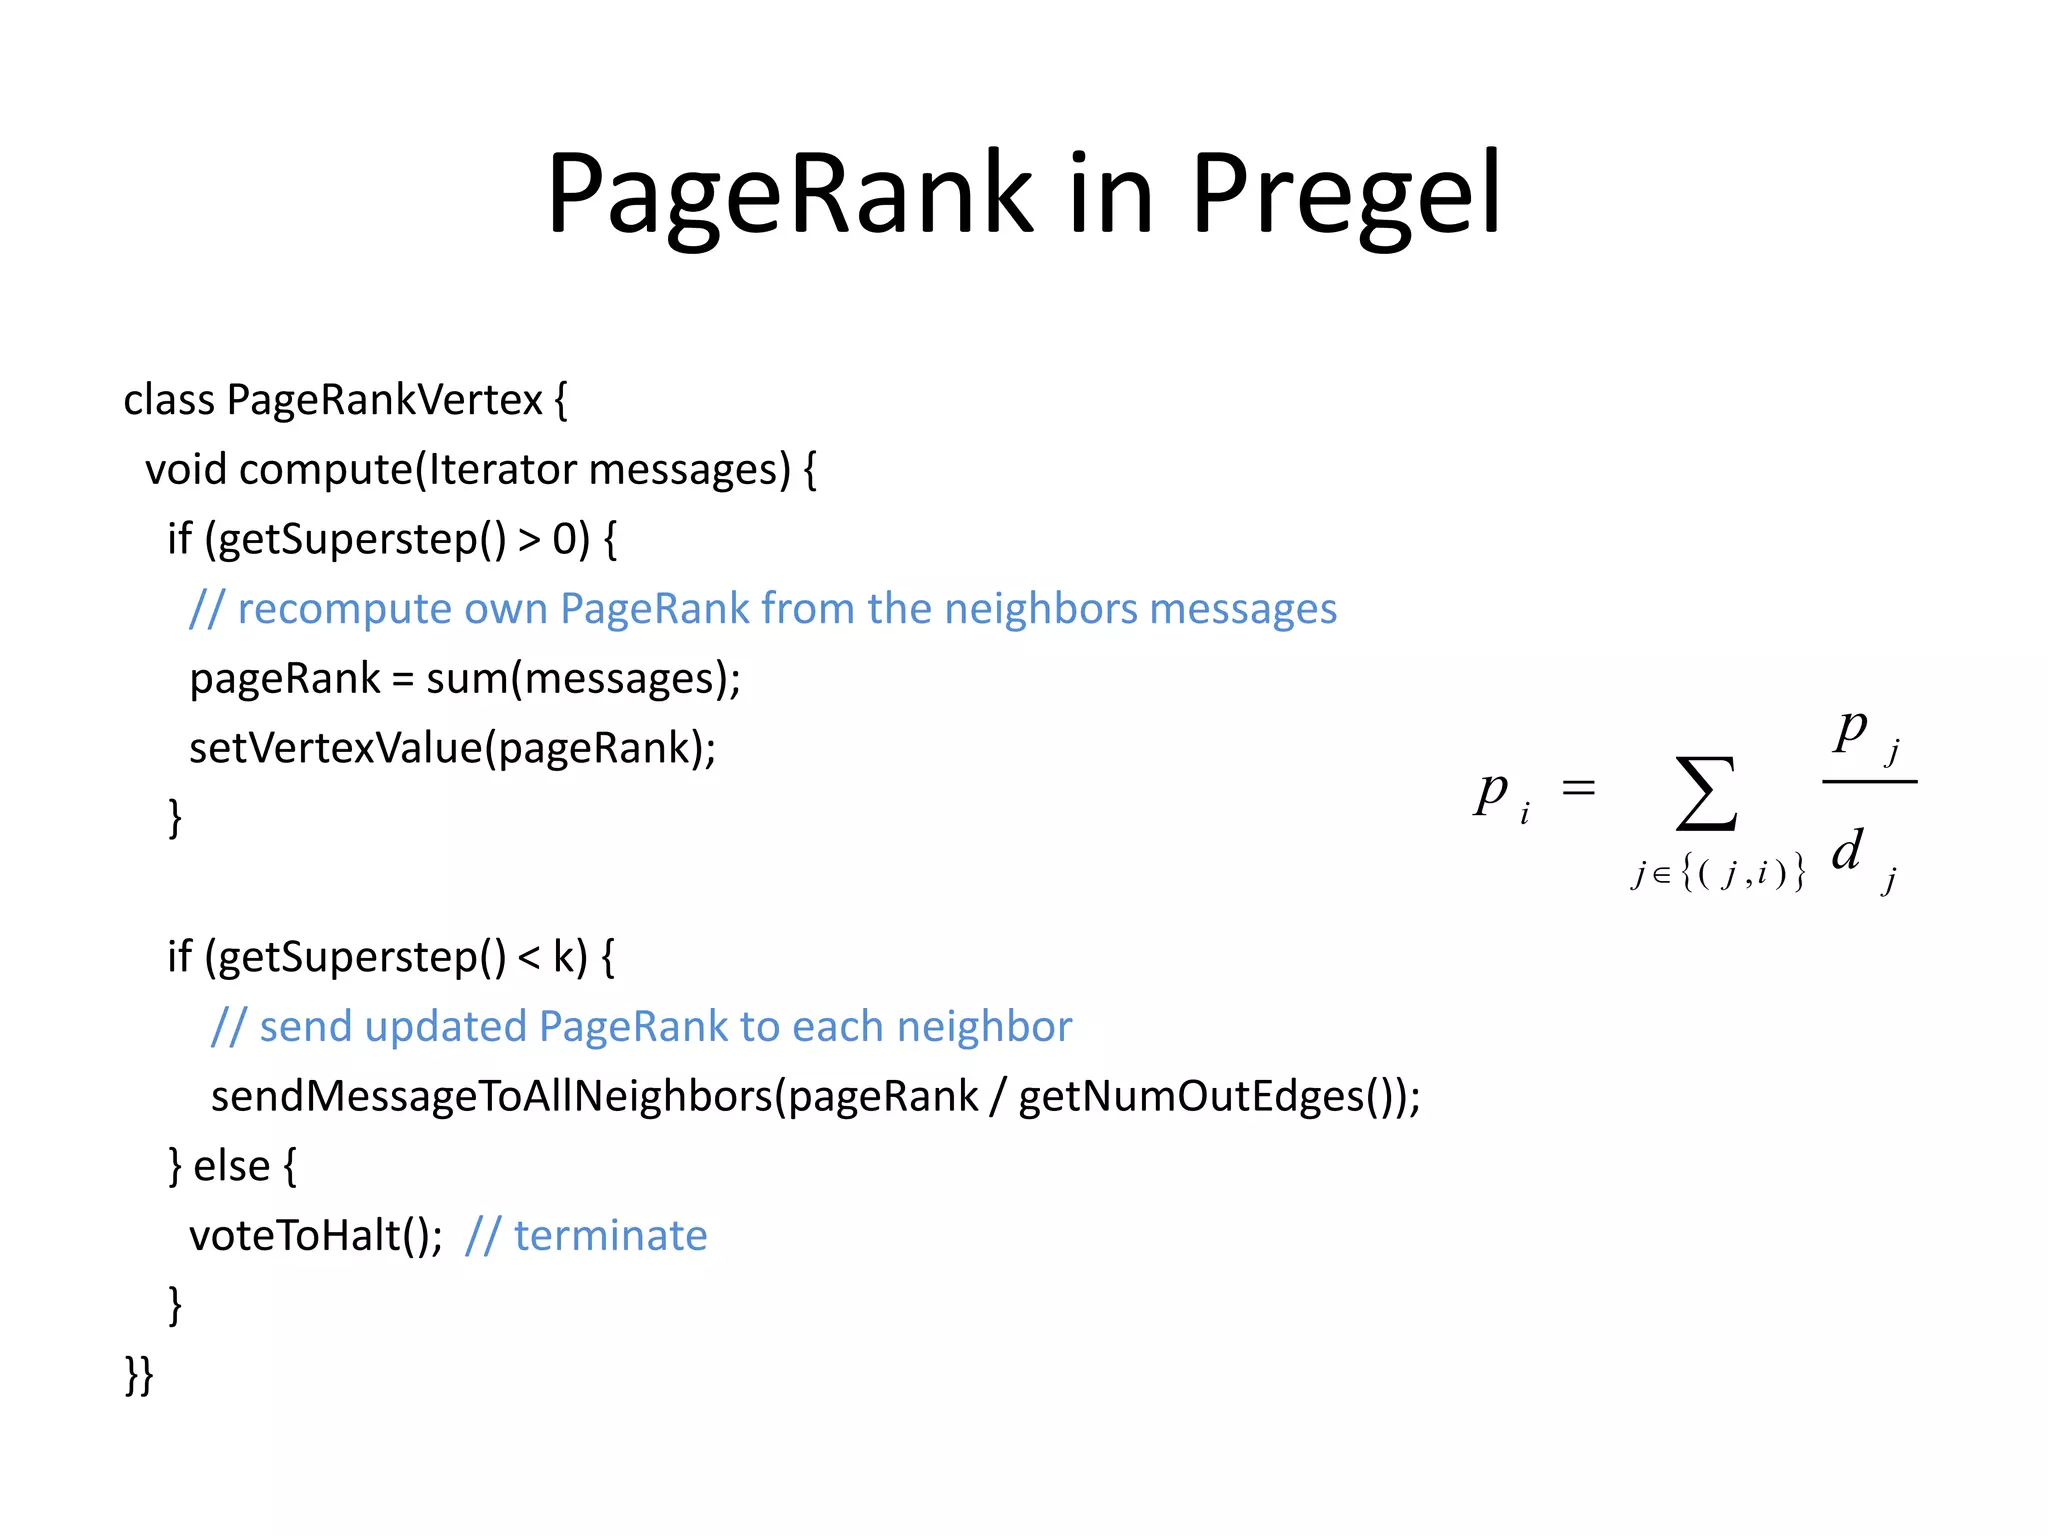
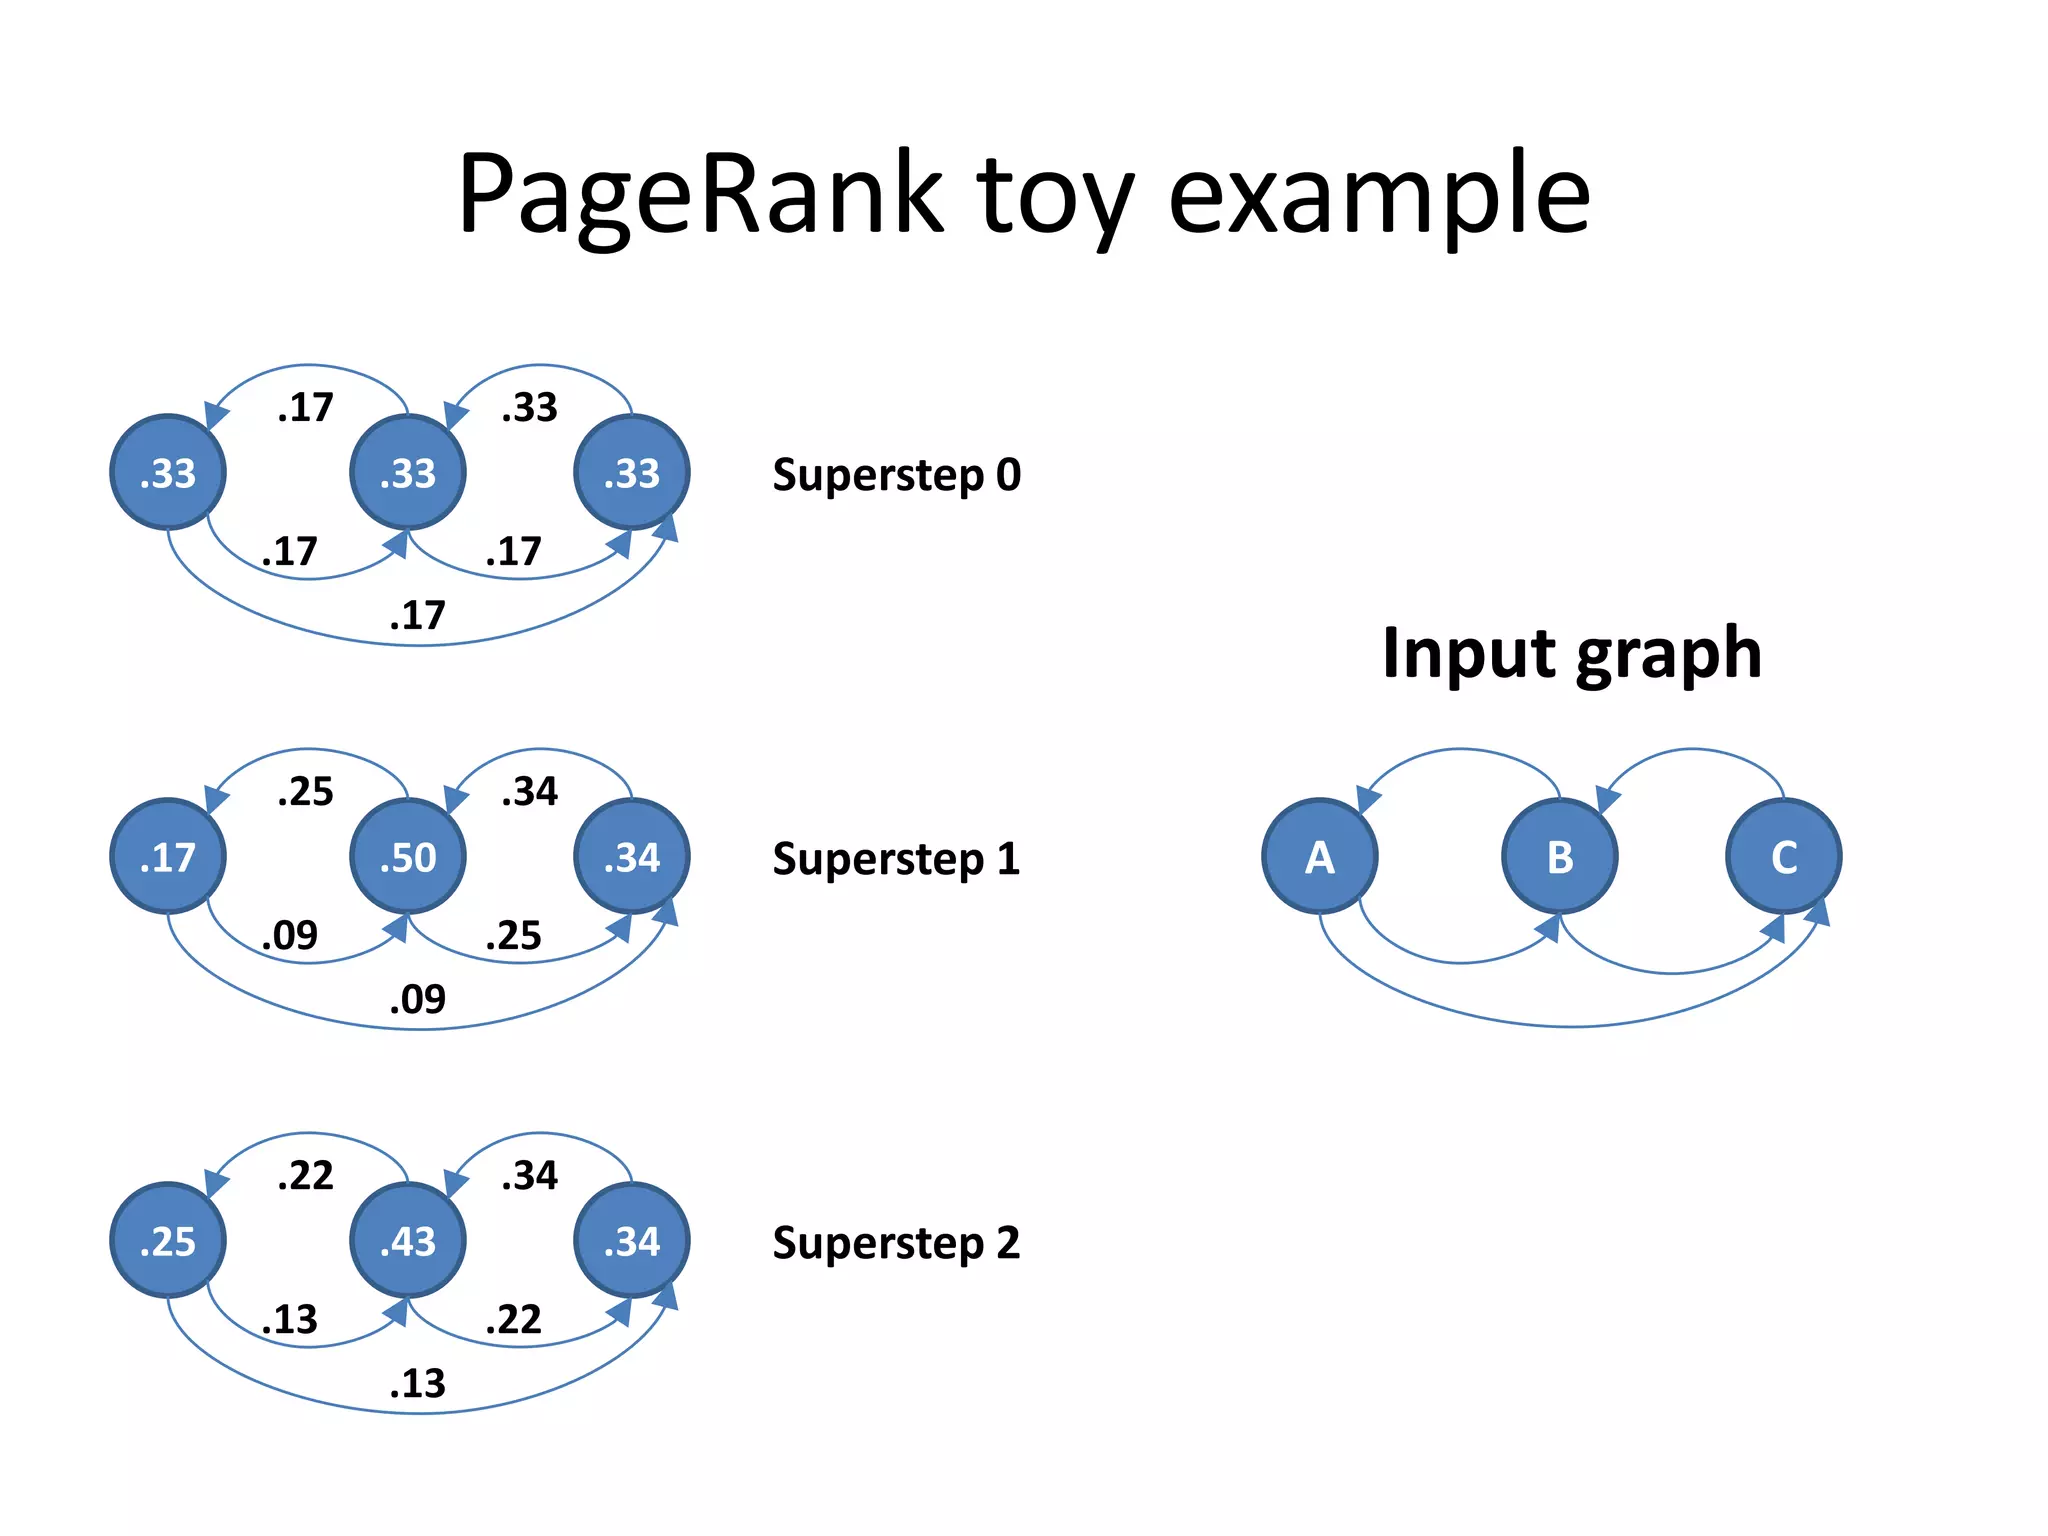
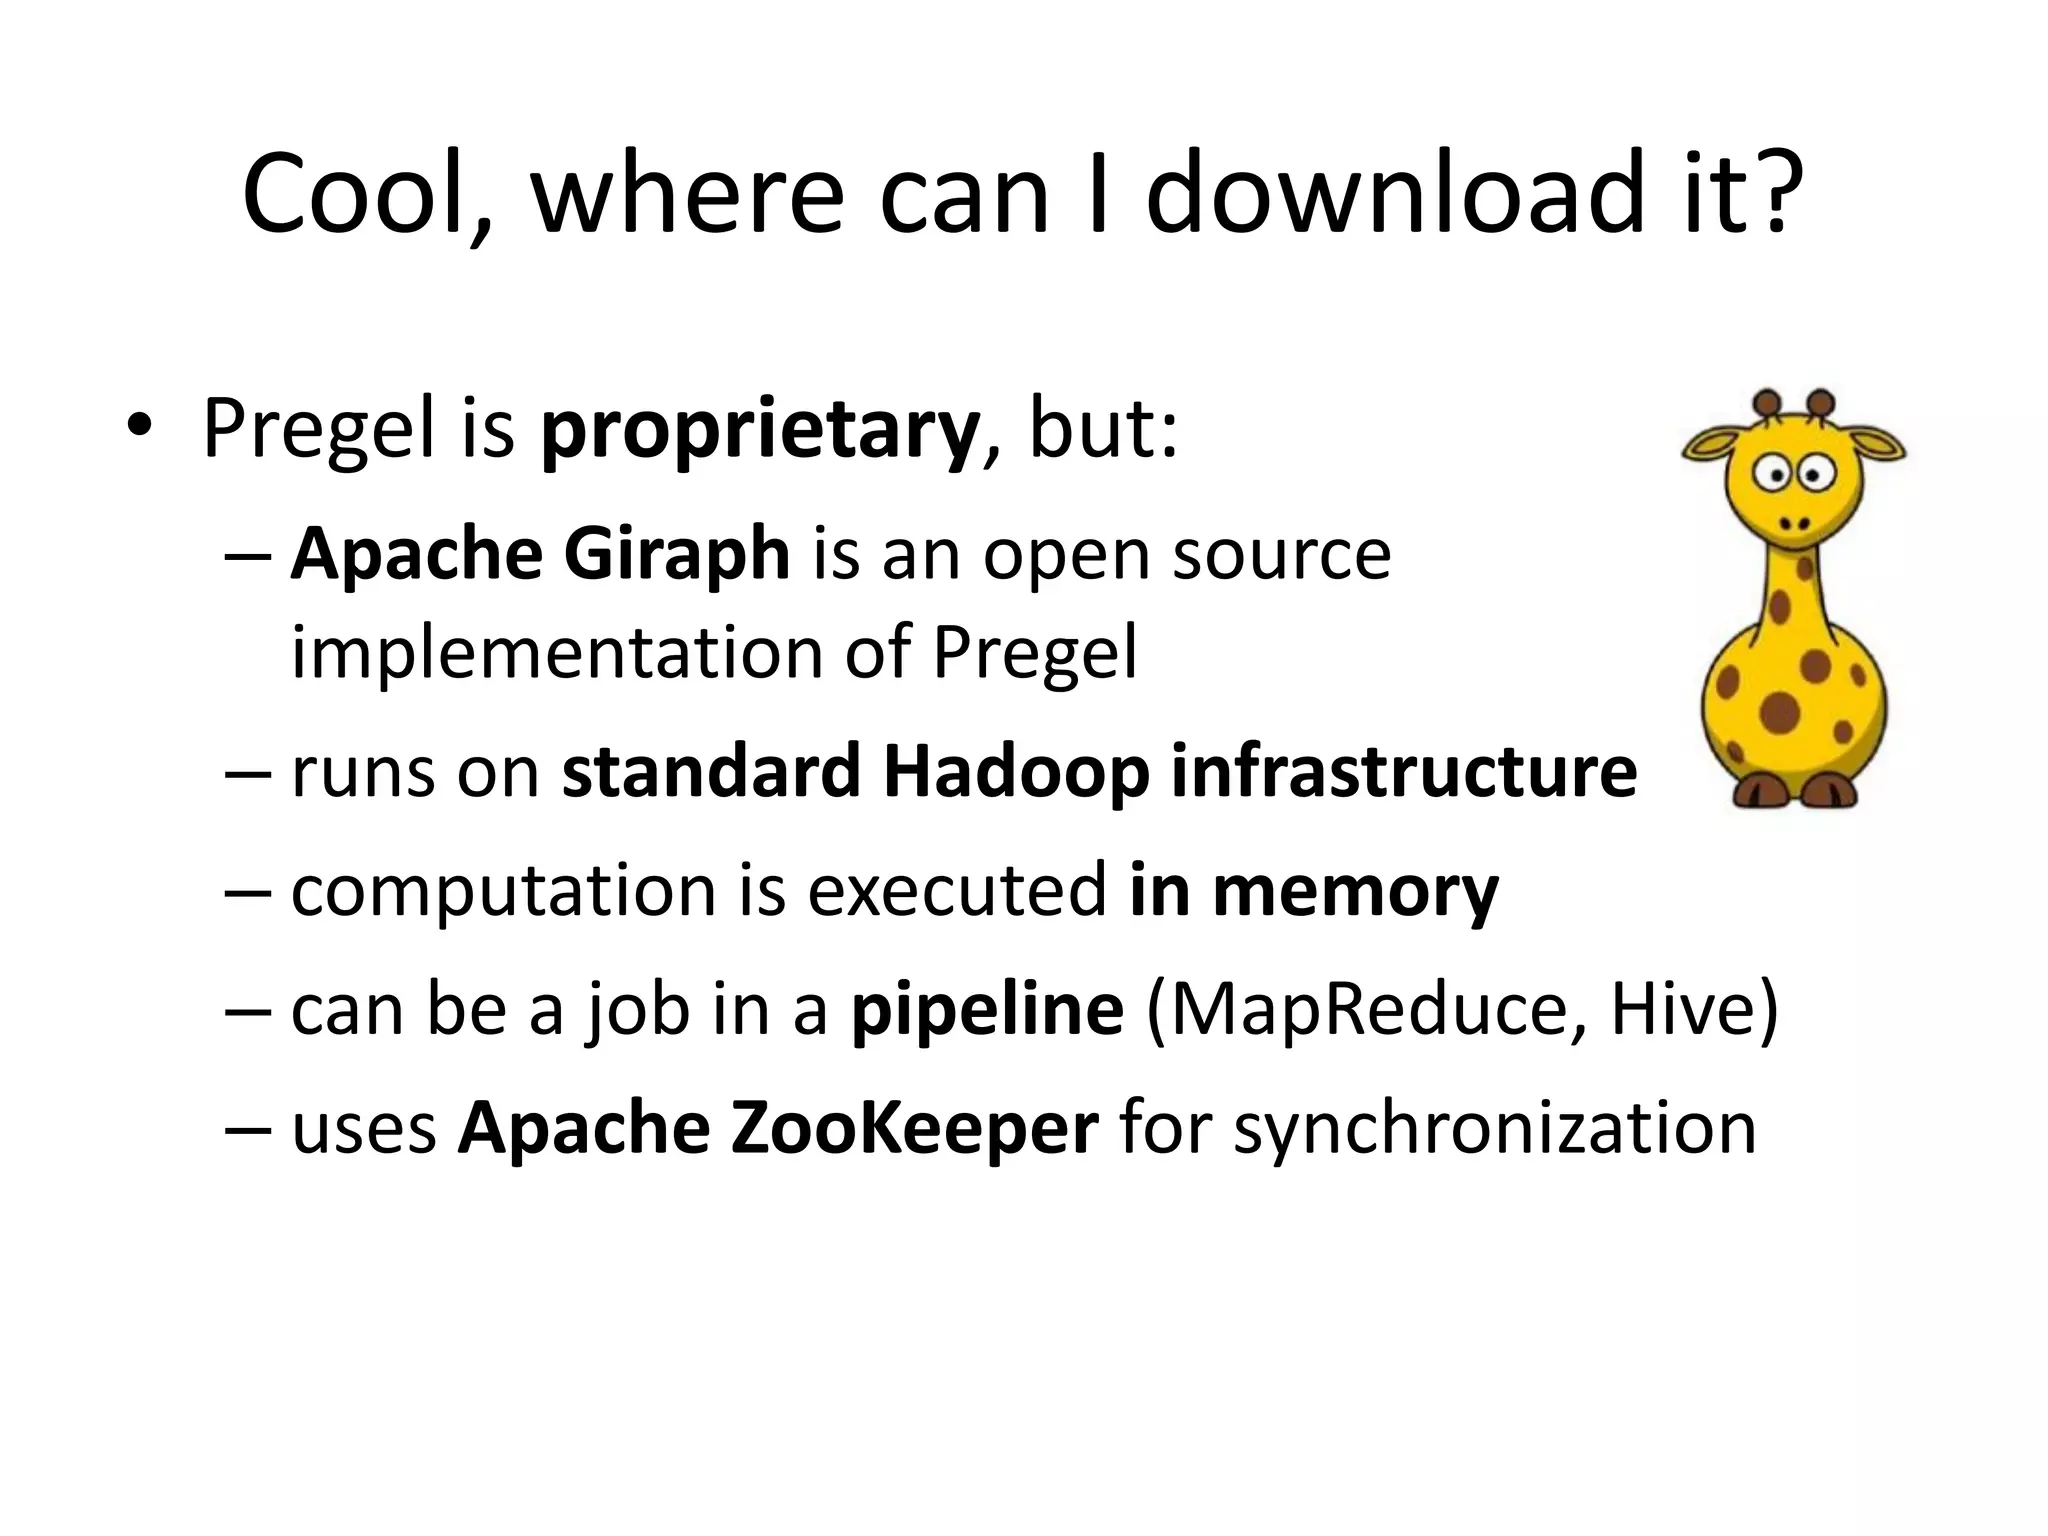
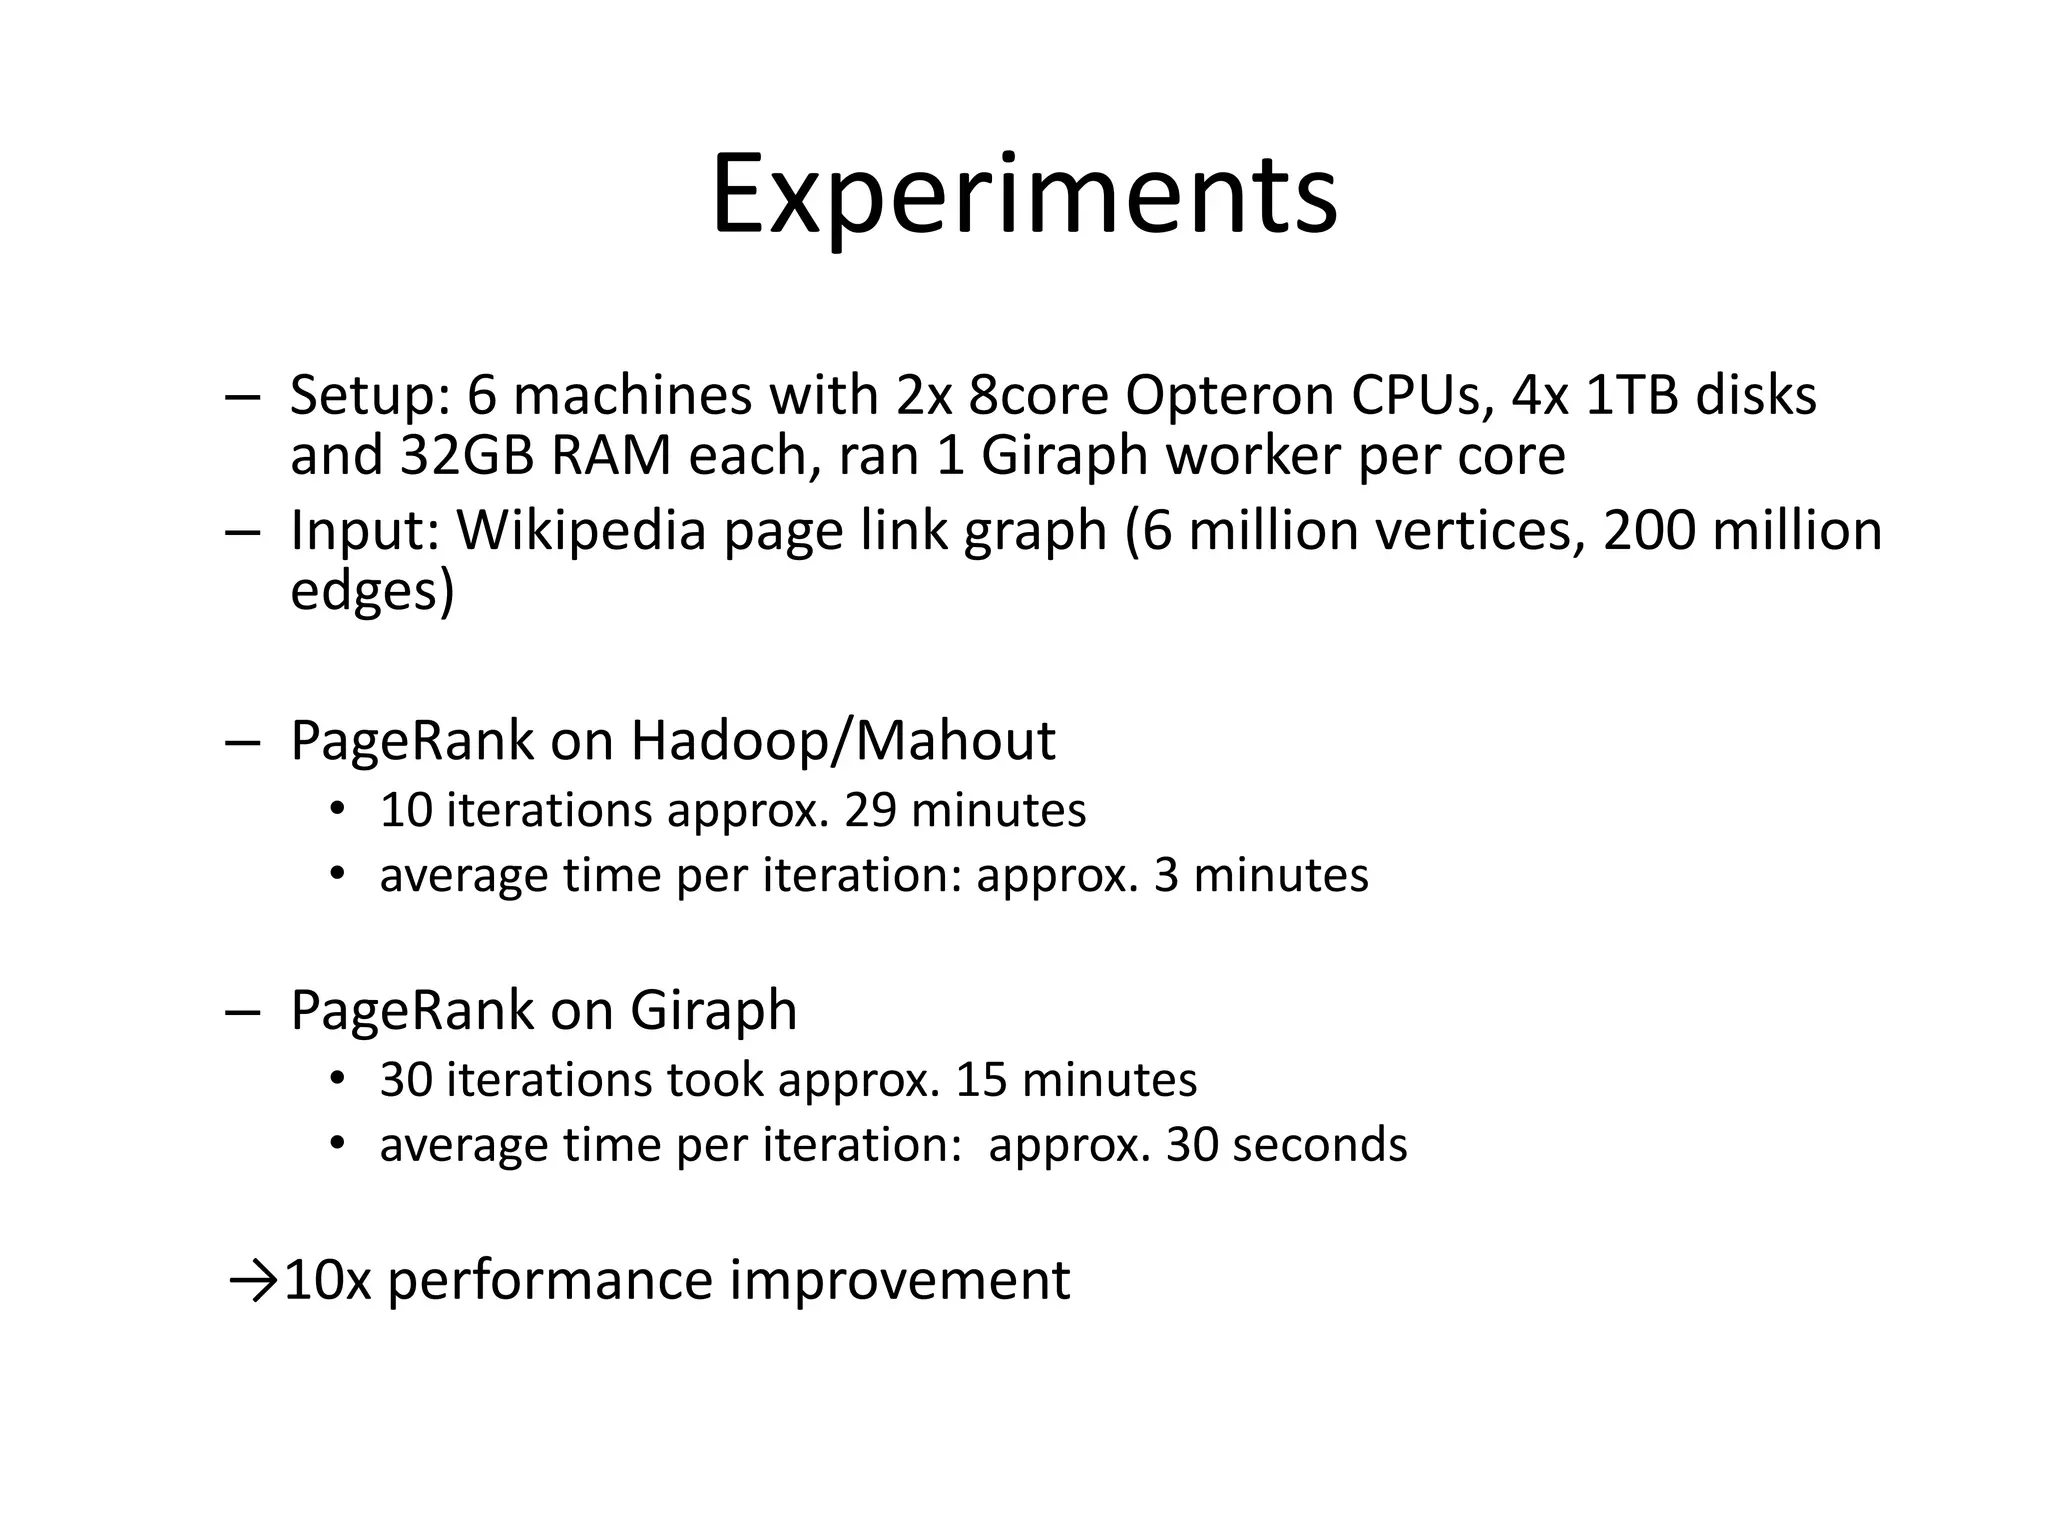
Large Scale Graph Processing
    with Apache Giraph

Sebastian Schelter

Invited talk at GameDuell Berlin
29th May 2012
the mandatory ‚about me‘ slide
• PhD student at the Database Systems and
  Information Management Group (DIMA)
  of TU Berlin
   – Stratosphere, database inspired approach to
     a next generation large scale processing
     system, joint research project with HU Berlin
     and HPI Potsdam
   – European Research Project ‘ROBUST’ dealing
     with the analysis of huge-scale online
     business communities
• involved in open source as committer and
  PMC member of Apache Mahout and
  Apache Giraph
Overview
1)   Graphs
2)   Graph processing with Hadoop/MapReduce
3)   Google Pregel
4)   Apache Giraph
5)   Outlook: everything is a network
Graph recap
graph: abstract representation of a set of objects
(vertices), where some pairs of these objects are
connected by links (edges), which can be directed or
undirected

Graphs can be used to model arbitrary things like
road networks, social networks, flows of goods, etc.

Majority of graph algorithms             B

are iterative and traverse
the graph in some way              A             D

                                             C
The Web
• the World Wide Web itself can be seen as a huge
  graph, the so called web graph
  – pages are vertices connected by edges that represent
    hyperlinks
  – the web graph has several billion vertices and several
    billion edges

• the success of major internet companies such as
  Google is based on the ability to conduct
  computations on this huge graph
Google‘s PageRank
• success factor of Google‘s search engine:
   – much better ranking of search results

• ranking is based on PageRank,
  a graph algorithm computing
  the ‚importance‘ of webpages
   – simple idea: look at the structure
     of the underlying network
   – important pages have a lot of links
     from other important pages

• major technical success factor of Google:
  ability to conduct web scale graph processing
Social Networks
• on facebook, twitter, LinkedIn, etc, the users and
  their interactions form a social graph
   – users are vertices connected by edges that represent
     some kind of interaction such as
     friendship, following, business contact
• fascinating research questions:
   – what is the structure of
     these graphs?
   – how do they evolve over time?
• analysis requires knowledge
  in both computer science and social sciences
six degrees of separation
• small world problem
    – through how many social contacts do
      people know each other on average?

• small world experiment by Stanley Milgram
    – task: deliver a letter to a recipient whom you
      don‘t know personally
    – you may forward the letter only to persons that
      you know on a first-name basis
    – how many contacts does it take on average until the letter reaches the target?

• results
    – it took 5.5 to 6 contacts on average
    – confirmation of the popular assumption of ‚six degrees of separation‘
      between humans
    – experiment criticised due to small number of participants, possibly biased
      selection
four degrees of separation
• the small word problem as a graph problem in social
  network analysis
   – what is the average distance between two users in a social
     graph?

• in early 2011, scientists conducted a world scale
  experiment using the Facebook social graph
   – 721 million users, 69 billion friendships links
   – result: average distance in Facebook is 4.74
     → ‚four degrees of separation‘

→ large scale graph processing gives unpredecented
  opportunities for the social sciences
Overview
1)   Graphs
2)   Graph processing with Hadoop/MapReduce
3)   Google Pregel
4)   Apache Giraph
5)   Outlook: everything is a network
Why not use MapReduce/Hadoop?
• MapReduce/Hadoop is the current standard for data
  intensive computing, why not use it for graph
  processing?
• Example: PageRank
  – defined recursively                                      p
                                              
                                                                 j
  – each vertex distributes its     pi 
    authority to its neighbors in                            d
                                           j ( j , i )        j
    equal proportions
Textbook approach to
           PageRank in MapReduce
• PageRank p is the principal eigenvector of the Markov matrix
  M defined by the transition probabilities between web pages
• it can be obtained by iteratively multiplying an initial
  PageRank vector by M (power method)

    p i  1  Mp    i


       row 1 of M         ∙
       row 2 of M         ∙    pi
                                                            pi+1


       row n of M         ∙
Drawbacks
• Not intuitive: only crazy scientists
  think in matrices and eigenvectors
• Unnecessarily slow: Each iteration is a single
  MapReduce job with lots of overhead
  –   separately scheduled
  –   the graph structure is read from disk
  –   the intermediary result is written to HDFS
• Hard to implement: a join has to be implemented
  by hand, lots of work, best strategy is data
  dependent
Overview
1)   Graphs
2)   Graph processing with Hadoop/MapReduce
3)   Google Pregel
4)   Apache Giraph
5)   Outlook: everything is a network
Google Pregel
• distributed system especially developed for
  large scale graph processing
• intuitive API that let‘s you ‚think like a vertex‘
• Bulk Synchronous Parallel (BSP) as execution
  model
• fault tolerance by checkpointing
Bulk Synchronous Parallel (BSP)
                    processors


local computation


                                 superstep


communication


barrier
synchronization
Vertex-centric BSP
• each vertex has an id, a value, a list of its adjacent neighbor ids and the
  corresponding edge values
• each vertex is invoked in each superstep, can recompute its value and
  send messages to other vertices, which are delivered over superstep
  barriers
• advanced features : termination votes, combiners, aggregators, topology
  mutations
          vertex1                 vertex1                 vertex1


          vertex2                 vertex2                 vertex2


          vertex3                 vertex3                 vertex3


        superstep i           superstep i + 1           superstep i + 2
Master-slave architecture
• vertices are partitioned and
  assigned to workers
   – default: hash-partitioning
   – custom partitioning possible


• master assigns and coordinates,
  while workers execute vertices               Master
  and communicate with each
  other

                                    Worker 1   Worker 2   Worker 3
PageRank in Pregel
class PageRankVertex {
 void compute(Iterator messages) {
   if (getSuperstep() > 0) {
     // recompute own PageRank from the neighbors messages
     pageRank = sum(messages);
     setVertexValue(pageRank);                                                             p
                                                                            
                                                                                               j

   }
                                                                  pi 
                                                                         j ( j , i )    d   j

     if (getSuperstep() < k) {
        // send updated PageRank to each neighbor
        sendMessageToAllNeighbors(pageRank / getNumOutEdges());
     } else {
       voteToHalt(); // terminate
     }
}}
PageRank toy example
      .17         .33
.33         .33         .33   Superstep 0
      .17         .17
            .17
                                                Input graph
      .25         .34
.17         .50         .34   Superstep 1   A       B         C
      .09         .25
            .09


      .22         .34
.25         .43         .34   Superstep 2
      .13         .22
            .13
Cool, where can I download it?
• Pregel is proprietary, but:
  – Apache Giraph is an open source
    implementation of Pregel
  – runs on standard Hadoop infrastructure
  – computation is executed in memory
  – can be a job in a pipeline (MapReduce, Hive)
  – uses Apache ZooKeeper for synchronization
Overview
1)   Graphs
2)   Graph processing with Hadoop/MapReduce
3)   Google Pregel
4)   Apache Giraph
5)   Outlook: everything is a network
Giraph‘s Hadoop usage

   TaskTracker        TaskTracker          TaskTracker

worker    worker   worker      worker   worker    worker


                                           TaskTracker

  ZooKeeper                             master    worker
                       JobTracker
                       NameNode
Anatomy of an execution
Setup                               Teardown
• load the graph from disk          • write back result
• assign vertices to workers        • write back aggregators
• validate workers health


Compute                        Synchronize
• assign messages to workers   • send messages to workers
• iterate on active vertices   • compute aggregators
• call vertices compute()      • checkpoint
Who is doing what?
• ZooKeeper: responsible for computation state
    – partition/worker mapping
    – global state: #superstep
    – checkpoint paths, aggregator values, statistics

• Master: responsible for coordination
    –   assigns partitions to workers
    –   coordinates synchronization
    –   requests checkpoints
    –   aggregates aggregator values
    –   collects health statuses

• Worker: responsible for vertices
    – invokes active vertices compute() function
    – sends, receives and assigns messages
    – computes local aggregation values
Example: finding the connected
  components of an undirected graph
• algorithm: propagate smallest vertex label to
  neighbors until convergence

           2               1                0
       1               0                0

               3               3                3
   0               0                0


• in the end, all vertices of a component will
  have the same label
Step 1: create a custom vertex
public class ConnectedComponentsVertex
   extends BasicVertex<IntWritable, IntWritable, NullWritable, IntWritable> {
 public void compute(Iterator messages) {
     int currentLabel = getVertexValue().get();
     while (messages.hasNext()) {
       int candidate = messages.next().get();
       currentLabel = Math.min(currentLabel, candidate); // compare with neighbors labels
     }
     // propagation is necessary if we are in the first superstep or if we found a new label
     if (getSuperstep() == 0 || currentLabel != getVertexValue().get()) {
       setVertexValue(new IntWritable(currentLabel));
       sendMsgToAllEdges(getVertexValue()); // propagate newly found label to neighbors
     }
     voteToHalt(); // terminate this vertex, new messages might reactivate it
}}
Step 2: create a custom input format
• input is a text file with adjacency lists, each line
  looks like: <vertex_ID> <neighbor1_ID> <neighbor2_ID> ...
public class ConnectedComponentsInputFormat extends
  TextVertexInputFormat<IntWritable, IntWritable, NullWritable, IntWritable> {
 static class ConnectedComponentsVertexReader extends
      TextVertexReader<IntWritable, IntWritable, NullWritable, IntWritable> {
  public BasicVertex<IntWritable, IntWritable, NullWritable, IntWritable> getCurrentVertex() {
      // instantiate vertex
      BasicVertex<IntWritable, IntWritable, NullWritable, IntWritable> vertex = ...
      // parse a line from the input and initialize the vertex
      vertex.initialize(...);
      return vertex;
}}}
Step 3: create a custom output format
• output is a text file, each line looks like:
         <vertex_ID> <component_ID>

public class VertexWithComponentTextOutputFormat extends
  TextVertexOutputFormat<IntWritable, IntWritable, NullWritable> {
 public static class VertexWithComponentWriter extends
     TextVertexOutputFormat.TextVertexWriter<IntWritable, IntWritable, NullWritable> {
     public void writeVertex(BasicVertex<IntWritable, IntWritable, NullWritable, ?> vertex) {
         // write out the vertex ID and the vertex value
         String output = vertex.getVertexId().get() + 't‚ + vertex.getVertexValue().get();
         getRecordWriter().write(new Text(output), null);
     }
}}
Step 4: create a combiner (optional)
• we are only interested in the smallest label sent
  to a vertex, therefore we can apply a combiner

public class MinimumIntCombiner extends VertexCombiner<IntWritable, IntWritable> {
 public Iterable<IntWritable> combine(IntWritable target, Iterable<IntWritable> messages) {
     int minimum = Integer.MAX_VALUE;
     // find minimum label
     for (IntWritable message : messages) {
       minimum = Math.min(minimum, message.get());
     }
     return Lists.<IntWritable>newArrayList(new IntWritable(minimum));
 }
Experiments
– Setup: 6 machines with 2x 8core Opteron CPUs, 4x 1TB disks
  and 32GB RAM each, ran 1 Giraph worker per core
– Input: Wikipedia page link graph (6 million vertices, 200 million
  edges)

– PageRank on Hadoop/Mahout
    • 10 iterations approx. 29 minutes
    • average time per iteration: approx. 3 minutes

– PageRank on Giraph
    • 30 iterations took approx. 15 minutes
    • average time per iteration: approx. 30 seconds

→10x performance improvement
hardware utilization
Connected Components
• execution takes approx. 4 minutes
  – subsecond iterations after superstep 5
  → Giraph exploits small average distance!
                               45000
    duration in milliseconds


                               40000

                               35000

                               30000

                               25000

                               20000

                               15000

                               10000

                                5000

                                   0
                                       1   2   3   4    5   6   7   8   9   10   11   12

                                                       supersteps
Overview
1)   Graphs
2)   Graph processing with Hadoop/MapReduce
3)   Google Pregel
4)   Apache Giraph
5)   Outlook: everything is a network
Everything is a network!
distributed matrix factorization
• decompose matrix A into product of two lower
  dimensional feature matrices R and C

                                    CT
           A            R 


• master algorithm: dimension reduction, solving least
  squares problems, compressing data, collaborative
  filtering, latent semantic analysis, ...
Alternating Least Squares
• minimize squared error over all known entries:
                                                                 2

                              
                                                       T
                 f (R,C )                   ( a ij  ri c j )
                                  i , j A


• Alternating Least Squares
   – fix one side, solve for the other, repeat until convergence
   – easily parallelizable, iterative algorithm


• what does this all have to with graphs?
matrices can be represented by graphs
• represent matrix as bipartite graph
                                                  2
      2       5               row 1                        column 1
                                              5
                 
                                                          1
              7                row 2                        column 2
                 
      1
           3                 row 3        3       7       column 3


• now the ALS algorithm can easily be implemented as a
  Giraph program
   – every vertex holds a row vector of one of the feature matrices
   – in each superstep the vertices of one side recompute their
     vector and send it to the connected vertices on the other side
What‘s to come?
• Current and future work in Giraph
  – out-of-core messaging
  – algorithms library
Thank you. Questions?


Database Systems and Information
Management Group (DIMA), TU Berlin

Large Scale Graph Processing with Apache Giraph

  • 1.
    Large Scale GraphProcessing with Apache Giraph Sebastian Schelter Invited talk at GameDuell Berlin 29th May 2012
  • 2.
    the mandatory ‚aboutme‘ slide • PhD student at the Database Systems and Information Management Group (DIMA) of TU Berlin – Stratosphere, database inspired approach to a next generation large scale processing system, joint research project with HU Berlin and HPI Potsdam – European Research Project ‘ROBUST’ dealing with the analysis of huge-scale online business communities • involved in open source as committer and PMC member of Apache Mahout and Apache Giraph
  • 3.
    Overview 1) Graphs 2) Graph processing with Hadoop/MapReduce 3) Google Pregel 4) Apache Giraph 5) Outlook: everything is a network
  • 4.
    Graph recap graph: abstractrepresentation of a set of objects (vertices), where some pairs of these objects are connected by links (edges), which can be directed or undirected Graphs can be used to model arbitrary things like road networks, social networks, flows of goods, etc. Majority of graph algorithms B are iterative and traverse the graph in some way A D C
  • 5.
    The Web • theWorld Wide Web itself can be seen as a huge graph, the so called web graph – pages are vertices connected by edges that represent hyperlinks – the web graph has several billion vertices and several billion edges • the success of major internet companies such as Google is based on the ability to conduct computations on this huge graph
  • 6.
    Google‘s PageRank • successfactor of Google‘s search engine: – much better ranking of search results • ranking is based on PageRank, a graph algorithm computing the ‚importance‘ of webpages – simple idea: look at the structure of the underlying network – important pages have a lot of links from other important pages • major technical success factor of Google: ability to conduct web scale graph processing
  • 7.
    Social Networks • onfacebook, twitter, LinkedIn, etc, the users and their interactions form a social graph – users are vertices connected by edges that represent some kind of interaction such as friendship, following, business contact • fascinating research questions: – what is the structure of these graphs? – how do they evolve over time? • analysis requires knowledge in both computer science and social sciences
  • 8.
    six degrees ofseparation • small world problem – through how many social contacts do people know each other on average? • small world experiment by Stanley Milgram – task: deliver a letter to a recipient whom you don‘t know personally – you may forward the letter only to persons that you know on a first-name basis – how many contacts does it take on average until the letter reaches the target? • results – it took 5.5 to 6 contacts on average – confirmation of the popular assumption of ‚six degrees of separation‘ between humans – experiment criticised due to small number of participants, possibly biased selection
  • 9.
    four degrees ofseparation • the small word problem as a graph problem in social network analysis – what is the average distance between two users in a social graph? • in early 2011, scientists conducted a world scale experiment using the Facebook social graph – 721 million users, 69 billion friendships links – result: average distance in Facebook is 4.74 → ‚four degrees of separation‘ → large scale graph processing gives unpredecented opportunities for the social sciences
  • 10.
    Overview 1) Graphs 2) Graph processing with Hadoop/MapReduce 3) Google Pregel 4) Apache Giraph 5) Outlook: everything is a network
  • 11.
    Why not useMapReduce/Hadoop? • MapReduce/Hadoop is the current standard for data intensive computing, why not use it for graph processing? • Example: PageRank – defined recursively p  j – each vertex distributes its pi  authority to its neighbors in d j ( j , i )  j equal proportions
  • 12.
    Textbook approach to PageRank in MapReduce • PageRank p is the principal eigenvector of the Markov matrix M defined by the transition probabilities between web pages • it can be obtained by iteratively multiplying an initial PageRank vector by M (power method) p i  1  Mp i row 1 of M ∙ row 2 of M ∙ pi pi+1 row n of M ∙
  • 13.
    Drawbacks • Not intuitive:only crazy scientists think in matrices and eigenvectors • Unnecessarily slow: Each iteration is a single MapReduce job with lots of overhead – separately scheduled – the graph structure is read from disk – the intermediary result is written to HDFS • Hard to implement: a join has to be implemented by hand, lots of work, best strategy is data dependent
  • 14.
    Overview 1) Graphs 2) Graph processing with Hadoop/MapReduce 3) Google Pregel 4) Apache Giraph 5) Outlook: everything is a network
  • 15.
    Google Pregel • distributedsystem especially developed for large scale graph processing • intuitive API that let‘s you ‚think like a vertex‘ • Bulk Synchronous Parallel (BSP) as execution model • fault tolerance by checkpointing
  • 16.
    Bulk Synchronous Parallel(BSP) processors local computation superstep communication barrier synchronization
  • 17.
    Vertex-centric BSP • eachvertex has an id, a value, a list of its adjacent neighbor ids and the corresponding edge values • each vertex is invoked in each superstep, can recompute its value and send messages to other vertices, which are delivered over superstep barriers • advanced features : termination votes, combiners, aggregators, topology mutations vertex1 vertex1 vertex1 vertex2 vertex2 vertex2 vertex3 vertex3 vertex3 superstep i superstep i + 1 superstep i + 2
  • 18.
    Master-slave architecture • verticesare partitioned and assigned to workers – default: hash-partitioning – custom partitioning possible • master assigns and coordinates, while workers execute vertices Master and communicate with each other Worker 1 Worker 2 Worker 3
  • 19.
    PageRank in Pregel classPageRankVertex { void compute(Iterator messages) { if (getSuperstep() > 0) { // recompute own PageRank from the neighbors messages pageRank = sum(messages); setVertexValue(pageRank); p  j } pi  j ( j , i )  d j if (getSuperstep() < k) { // send updated PageRank to each neighbor sendMessageToAllNeighbors(pageRank / getNumOutEdges()); } else { voteToHalt(); // terminate } }}
  • 20.
    PageRank toy example .17 .33 .33 .33 .33 Superstep 0 .17 .17 .17 Input graph .25 .34 .17 .50 .34 Superstep 1 A B C .09 .25 .09 .22 .34 .25 .43 .34 Superstep 2 .13 .22 .13
  • 21.
    Cool, where canI download it? • Pregel is proprietary, but: – Apache Giraph is an open source implementation of Pregel – runs on standard Hadoop infrastructure – computation is executed in memory – can be a job in a pipeline (MapReduce, Hive) – uses Apache ZooKeeper for synchronization
  • 22.
    Overview 1) Graphs 2) Graph processing with Hadoop/MapReduce 3) Google Pregel 4) Apache Giraph 5) Outlook: everything is a network
  • 23.
    Giraph‘s Hadoop usage TaskTracker TaskTracker TaskTracker worker worker worker worker worker worker TaskTracker ZooKeeper master worker JobTracker NameNode
  • 24.
    Anatomy of anexecution Setup Teardown • load the graph from disk • write back result • assign vertices to workers • write back aggregators • validate workers health Compute Synchronize • assign messages to workers • send messages to workers • iterate on active vertices • compute aggregators • call vertices compute() • checkpoint
  • 25.
    Who is doingwhat? • ZooKeeper: responsible for computation state – partition/worker mapping – global state: #superstep – checkpoint paths, aggregator values, statistics • Master: responsible for coordination – assigns partitions to workers – coordinates synchronization – requests checkpoints – aggregates aggregator values – collects health statuses • Worker: responsible for vertices – invokes active vertices compute() function – sends, receives and assigns messages – computes local aggregation values
  • 26.
    Example: finding theconnected components of an undirected graph • algorithm: propagate smallest vertex label to neighbors until convergence 2 1 0 1 0 0 3 3 3 0 0 0 • in the end, all vertices of a component will have the same label
  • 27.
    Step 1: createa custom vertex public class ConnectedComponentsVertex extends BasicVertex<IntWritable, IntWritable, NullWritable, IntWritable> { public void compute(Iterator messages) { int currentLabel = getVertexValue().get(); while (messages.hasNext()) { int candidate = messages.next().get(); currentLabel = Math.min(currentLabel, candidate); // compare with neighbors labels } // propagation is necessary if we are in the first superstep or if we found a new label if (getSuperstep() == 0 || currentLabel != getVertexValue().get()) { setVertexValue(new IntWritable(currentLabel)); sendMsgToAllEdges(getVertexValue()); // propagate newly found label to neighbors } voteToHalt(); // terminate this vertex, new messages might reactivate it }}
  • 28.
    Step 2: createa custom input format • input is a text file with adjacency lists, each line looks like: <vertex_ID> <neighbor1_ID> <neighbor2_ID> ... public class ConnectedComponentsInputFormat extends TextVertexInputFormat<IntWritable, IntWritable, NullWritable, IntWritable> { static class ConnectedComponentsVertexReader extends TextVertexReader<IntWritable, IntWritable, NullWritable, IntWritable> { public BasicVertex<IntWritable, IntWritable, NullWritable, IntWritable> getCurrentVertex() { // instantiate vertex BasicVertex<IntWritable, IntWritable, NullWritable, IntWritable> vertex = ... // parse a line from the input and initialize the vertex vertex.initialize(...); return vertex; }}}
  • 29.
    Step 3: createa custom output format • output is a text file, each line looks like: <vertex_ID> <component_ID> public class VertexWithComponentTextOutputFormat extends TextVertexOutputFormat<IntWritable, IntWritable, NullWritable> { public static class VertexWithComponentWriter extends TextVertexOutputFormat.TextVertexWriter<IntWritable, IntWritable, NullWritable> { public void writeVertex(BasicVertex<IntWritable, IntWritable, NullWritable, ?> vertex) { // write out the vertex ID and the vertex value String output = vertex.getVertexId().get() + 't‚ + vertex.getVertexValue().get(); getRecordWriter().write(new Text(output), null); } }}
  • 30.
    Step 4: createa combiner (optional) • we are only interested in the smallest label sent to a vertex, therefore we can apply a combiner public class MinimumIntCombiner extends VertexCombiner<IntWritable, IntWritable> { public Iterable<IntWritable> combine(IntWritable target, Iterable<IntWritable> messages) { int minimum = Integer.MAX_VALUE; // find minimum label for (IntWritable message : messages) { minimum = Math.min(minimum, message.get()); } return Lists.<IntWritable>newArrayList(new IntWritable(minimum)); }
  • 31.
    Experiments – Setup: 6machines with 2x 8core Opteron CPUs, 4x 1TB disks and 32GB RAM each, ran 1 Giraph worker per core – Input: Wikipedia page link graph (6 million vertices, 200 million edges) – PageRank on Hadoop/Mahout • 10 iterations approx. 29 minutes • average time per iteration: approx. 3 minutes – PageRank on Giraph • 30 iterations took approx. 15 minutes • average time per iteration: approx. 30 seconds →10x performance improvement
  • 32.
  • 33.
    Connected Components • executiontakes approx. 4 minutes – subsecond iterations after superstep 5 → Giraph exploits small average distance! 45000 duration in milliseconds 40000 35000 30000 25000 20000 15000 10000 5000 0 1 2 3 4 5 6 7 8 9 10 11 12 supersteps
  • 34.
    Overview 1) Graphs 2) Graph processing with Hadoop/MapReduce 3) Google Pregel 4) Apache Giraph 5) Outlook: everything is a network
  • 35.
  • 36.
    distributed matrix factorization •decompose matrix A into product of two lower dimensional feature matrices R and C CT A  R  • master algorithm: dimension reduction, solving least squares problems, compressing data, collaborative filtering, latent semantic analysis, ...
  • 37.
    Alternating Least Squares •minimize squared error over all known entries: 2  T f (R,C )  ( a ij  ri c j ) i , j A • Alternating Least Squares – fix one side, solve for the other, repeat until convergence – easily parallelizable, iterative algorithm • what does this all have to with graphs?
  • 38.
    matrices can berepresented by graphs • represent matrix as bipartite graph 2 2  5 row 1 column 1 5   1   7 row 2 column 2   1  3  row 3 3 7 column 3 • now the ALS algorithm can easily be implemented as a Giraph program – every vertex holds a row vector of one of the feature matrices – in each superstep the vertices of one side recompute their vector and send it to the connected vertices on the other side
  • 39.
    What‘s to come? •Current and future work in Giraph – out-of-core messaging – algorithms library
  • 40.
    Thank you. Questions? DatabaseSystems and Information Management Group (DIMA), TU Berlin