1) The document describes an experiment measuring the transient behavior of RC circuits. Students used alligator clips to construct circuits with resistors and capacitors and measured the voltage over time as capacitors charged and discharged.
2) Graphs of voltage versus time were produced and showed either linear or exponential patterns, characterizing charging and discharging behavior. Capacitance was calculated from the graphs' time constants and slopes.
3) Percent errors between measured and expected capacitance values were low, between 5-10%, validating the theory that charging and discharging capacitors follows the equation q = CVe-t/RC.
The JB is a DC circuit breaker dedicated to multi string photovoltaic installations. This circuit breaker is designed to protect the cables located between each string of photovoltaic modules and the photovoltaic inverter against overloads and short circuits.
The JB is a DC circuit breaker dedicated to multi string photovoltaic installations. This circuit breaker is designed to protect the cables located between each string of photovoltaic modules and the photovoltaic inverter against overloads and short circuits.
Sheet1resistance of resistorTime Constant = 5.3s10v from power sup.docxmaoanderton
Sheet1resistance of resistorTime Constant = 5.3s10v from power supply 54.37 kohmscapacitor 96.9 micro farradsY axistheoretical max 183.9 micro amps0835-0.7955515238536.610-1.61434389121016.215-2.4293808894157.8520-3.1538785998203.3925-3.9935622102251.8330-4.6100761648300.8635-5.3652150213350.4640-5.9909209211400.2545-6.6006864927450.18950-6.8804003955500.13355-7.2317982824550.10160-7.507026893860micro ampsseconds
5 10 15 20 25 30 35 40 45 50 55 60 -0.79555152381367755 -1.6143438912029549 -2.4293808893719371 -3.1538785998159584 -3.9935622102179167 -4.6100761647569461 -5.3652150213448593 -5.9909209211092715 -6.6006864927301665 -6.8804003955327699 -7.2317982823706588 -7.5070268937511528
Sheet285.5k ohms96.9 micro farrads10v from power supplyTime constant = 8.3Y axistheoretical max 117 micro amps050.18-0.8481529267823.616-1.60092722281611.324-2.3373712091244.8432-3.1852592141322.3440-3.9120230054401.1448-4.6311456724480.53456-5.3895333748560.31464-5.9205362279640.2172-6.3228216831720.14880-6.67271694800.12488-6.8496476482880.10896-6.987797986796micro ampsseconds
8 16 24 32 40 48 56 64 72 80 88 96 -0.84815292670693698 -1.6009272227661917 -2.3373712090794614 -3.185259214069216 -3.912023005428146 -4.6311456723913524 -5.3895333748196981 -5.92053622787164 -6.3228216830624246 -6.6727169400157784 -6.8496476481748561 -6.9877979866556732
Sheet384.37k ohms96.9 micro farradstime constant 5.310vx axisy axis4.855-0.66358837837.7410-1.48722027978.9815-2.28278246579.520-2.99573227369.7625-3.7297014486voltsseconds
5 10 15 20 25 -0.6635883783184009 -1.4872202797098513 -2.2827824656978661 -2.99573227355399 -3.7297014486341906
Sheet4resistance 85.5k ohm96.9 micro farradtime constant = 8.3s10vx axisy axis5.348-0.76356964497.8916-1.55589714559.0624-2.36446049679.5432-3.07911388259.7640-3.7297014486voltsseconds
8 16 24 32 40 seconds -0.76356964485649126 -1.5558971455060702 -2.3644604967121334 -3.0791138824930413 -3.7297014486341906
R-C Circuits
Purpose: This lab will consider another electrical component with unique characteristics, the capacitor. The lab will also provide practice constructing and interpreting graphs for the purpose of circuit analysis.
Introduction: As you have learned, a capacitor in its simplest form is two parallel plates of conductive material, separated by a non-conductive material that prevents the plates from touching. Capacitance, “C”, is measured in Farads (F), with typical values of capacitors being measured in μF. Capacitor labeling sometimes deviates from standard metric prefixes in that an upper case “M” is often used in place of the μ symbol for micro- (x 10-6). Do not confuse it with mega- (x 10+6). A mega-Farad capacitor would be enormous, if one could even be built!
As an electrical potential (voltage) is placed across the capacitor, electrical charge flows (current) from the voltage source and builds up on the plates of the capacitor. If connected to a DC source, the current will continue to fl.
reference notes/455647_1_EE460-Project-131.pdf
King Fahd University of Petroleum and Minerals
Department of Electrical Engineering
EE Power Electronics Project
Design of a DC Chopper
I. Design of an AC/DC converter with the following the specifications:
AC supply voltage VS = 230 V (rms), 60 Hz.
The DC output voltage V01(dc) = 48 V.
The ripple factor of the output voltage RFV 5%.
II. Design of step-down DC chopper with the following specifications:
Switching (or chopping) frequency, fs = 20 kHz.
Dc input supply voltage VS = 48 V dc, where as the source available is an ac with 230 V
(rms).
Load resistance R = 5 .
The DC output voltage V02(dc) = 12 V.
The peak-to-peak output ripple voltage, VC 2.5%.
The peak-to-peak inductor ripples current, IL 5%.
III. Calculation for both circuits:
(a) Determine the values of Le and Ce for the output LC-filter.
(b) Determine the (peak and rms) voltage ratings and the (average, rms, and the peak) current for
all components and devices.
(c) Verify your design calculation by using Pspice simulation.
Design AC/DC
Circuit
Design DC-DC
Chopper Circuit
AC 5
Output Load
The project will be due on Sunday December 22, 2013.
reference notes/455647_2_DC-20Converters-Design (1).pdf
....-ju"ncv
O.
214 Chapter 5 Dc-Dc Converters
Example 5.10
A buck converter is shown in Figure 5.29. The input voltage is V, == 110 V, the average load
age is Va == 60 V, and the average load current is la == 20 A. The chopping u
1 == 20 kHz. The peak-to-peak ripples are 2.5% for load voltage, 5% for load current, and
for filter Le current. (a) Determine the values of L" L, and Ceo Use PSpice (b) to verify the
suits by plotting the instantaneous capacitor voltage vc, and instantaneous load current iL ;
(c) to calculate the Fourier coefficients and the input current is. The SPICE model pax'ameters
the transistor are IS == 6.734f, BF = 416.4, BR == 0.7371, CJC == 3.638P, CJE::
TR == 239.5N, TF = 30L2P, and that ofthe diode are IS :: 2.2E-15, BV = 1800V, IT ==
Solution
V, = 110 V, va = 60 V, I. == 20 A.
ay: == 0.025 x Va = 0.025 x 60 = 1.5 V
Va 60
R==-=-=311
10 20
From Eq. (5.48),
Va 60
k = - = - = 05455
V, 110 .
From Eq. (5.49),
Is = kla = 0.5455 x 20 == 10.91 A
alL = 0.05 x I. :: 0.05 x 20 == 1 A
M = 0.1 x 10 == 0.1 x 20 == 2 A
8. From Eq. (5.51), we get the value of L.:
VaWs - Va) 60 X (110 - 60)
Le = MIV, = 2 x 20 kHz x 110 = 681.82 ~H
From Eq. (5.53) we get the value of Ce:
2c == ,11
e ,lV, X 81 1.5 x 8 X 20 kHz == 8.33 ~F
L4
+
+
Vs 110 V
FIGURE 5.29
o~-----------+----------~--------~Buck converter.
5.12 Chopper Circuit Design 215
Vs
L
8
v, OV
O~----------------------------*-------~~------~
(a) Circuit
Vgj
2ov~______________1~________-L____--'
o 27.28 IlS SOIlS
(b) Control voltage
FIGURE 5.30
Buck chopper for PSpice simulation.
Assuming a linear rise of load current i ...
Harmonic Analysis of Output Voltage of Single phase AC Voltage ControllersEditor IJMTER
The harmonic analysis of output voltage of single phase AC voltage controller was well
known. But, it has been found that less harmonic analysis and comparison between voltage dimmer
and thyristorised AC voltage controller. This paper presents such an analysis on the AC voltage
controller using TRIAC, thyristor and voltage dimmer circuit. Results are obtained from simulations
as well as hardware implementation and results were compared.
Original IGBT N-CHANNEL STGP7NC60HD GP7NC60HD 7NC60 14A 600V TO-220 New
Lab report 2
1. Ethan Vanderbyl
Dr. Chen
Physics237
Date: 3/20/21
Title:TransientBehaviorinRCcircuits
Date: 2/28/14
Lab Partners: ChristinaHouck,AnthonyMen9dez
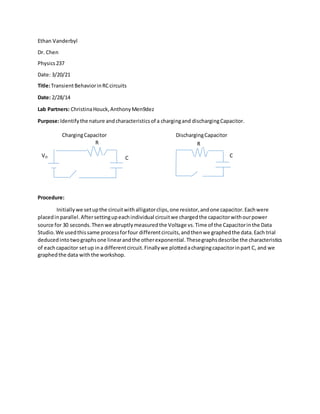
Purpose:Identifythe nature andcharacteristicsof a chargingand dischargingCapacitor.
Procedure:
Initiallywe setupthe circuitwithalligatorclips,one resistor,andone capacitor.Eachwere
placedinparallel.Aftersettingupeachindividual circuitwe chargedthe capacitorwithourpower
source for 30 seconds.Thenwe abruptlymeasuredthe Voltage vs.Time of the Capacitorinthe Data
Studio.We usedthissame processforfour differentcircuits,andthenwe graphedthe data.Each trial
deducedintotwographsone linearandthe otherexponential.Thesegraphsdescribe the characteristics
of eachcapacitor setup ina differentcircuit.Finallywe plottedachargingcapacitorinpart C, and we
graphedthe data withthe workshop.
ChargingCapacitor DischargingCapacitor
R
VO C
R
C
2. Data:
y = 8.4047e-0.015x
0
1
2
3
4
5
6
7
8
9
10
0 20 40 60 80 100 120 140 160
Votage(V)
Time (s)
Graph 2: Circuit 1 Run #2 Volatge vs. Time
y = 8.5046e-0.013x
0
2
4
6
8
10
0 50 100 150 200
Voltatge(V)
Time (s)
Graph 1: Circuit 1 Run # 1 Voltage vs.
Time
3. Results:
Graph Manufactured
Capacitance (μFarads)
Graph Capacitance
(μ Farads)
% difference
1 22000 24,150 9.77%
2 22000 21,000 4.5%
Calculations:
1. I = 𝑉𝑒−𝑡/𝑅𝐶
y = 8.4705e-0.029x
0
1
2
3
4
5
6
7
8
9
0 10 20 30 40 50 60 70 80 90
Voltage(V)
TIme (s)
Graph 3: Circuit 2, Run #1 Voltage vs. time
y = 8.3245e-0.007x
0
1
2
3
4
5
6
7
8
9
0 50 100 150 200 250 300 350
AxisTitle
Axis Title
Graph 4: CIrcuit 3, Run #1 Voltage vs.
Time
5. y = -0.0127x + 2.1406
-0.5
0
0.5
1
1.5
2
2.5
0 50 100 150 200
Voltage
Time (s)
Graph 1: Circuit 1 Run # 1 Voltage vs.
Time
y = -0.0146x + 2.1288
-0.5
0
0.5
1
1.5
2
2.5
0 20 40 60 80 100 120 140 160
Voltaage(V)
Time (s)
Graph 2: Ciruit 1 Run #2 Voltage vs.
Time
3.
6. 4.
Value Voltage (V) Time (s)
VO 8.655 0
τ 3.185 76.28
VO to .5V 1.593 131.24
.5VO to .25VO 0.796 186.2
.25VO to .125VO 0.398 241.16
y = -0.0068x + 2.1192
0
0.5
1
1.5
2
2.5
0 50 100 150 200 250 300 350
Voltage(V)
Time (s)
Graph 4: Circuit 3, Run #1 Voltage vs.
Time (Parallel)
y = -0.0285x + 2.1366
-0.5
0
0.5
1
1.5
2
2.5
0 20 40 60 80 100
Voltage(V)
Time (s)
Graph 3: Circuit 2 Run #1 Voltage vs.
TIme (Series)
7. 5.
Graph Slope (m) Time Constant(s)
1 -.0127 78.7402
2 -.0146 68.4932
3 -.0285 35.0877
4 -.0068 147.059
6.
Graph Time Constant(s) Capacitance (C)
1 78.7402 .02415
2 68.4932 .0210
3 35.0877 .0108
4 147.059 .0451
7.
Graph Manufactured
Capacitance (μFarads)
Graph Capacitance
(μ Farads)
% difference
1 22000 24,150 9.77%
2 22000 21,000 4.5%
8.
Graph CalculatedValues(μFarads) ExpectedValues(μFarads)
3 10800 11000
4 45100 11000
Conclusion:
The principle thatwasprovedinthislabis the fact that a charging dischargingcapacitoris
describedby 𝑞 = 𝑉𝐶𝑒−𝑡/𝑅𝐶.The graphsin thislabdescribe the capacitorswithrespecttovoltage vs.
time.Fromthe graphs we were able todefine how differentcircuitsetupseffectthe efficiencyof the
capacitor,whicheffectthe capacitorscharacteristicswithrespect tovelocityandtime.The slope relates
to the time constant,whichwe usedtofindthe Capacitance.We accomplishedthe purpose of thislab
because ourpercenterrorsof the Capacitance are verylow.Our percenterrorsbetweenourcalculated
value andthe exceptedvalue were9.8% and 4.5%.
Thisexperimentcouldhave beenimprovedif ourerrorswere eliminated.Some of these errors
includedthe time we chargedanddischargedthe capacitor.If were able tomake these readingsmore
precise ourpercenterrorswouldhave beenless.We alsoencounterederrorsbecauseof the constant
resistance inanimperfectcircuit.These errorscouldhave beenavoidedbyusingamechanical device to
8. take the time measurementsandthe circuitcouldhave beenmade betterbyusingbettermetalsas
conductors.Overall the errorsthatoccurred were minimal andtherefore we achievedgoodpercent
errors.