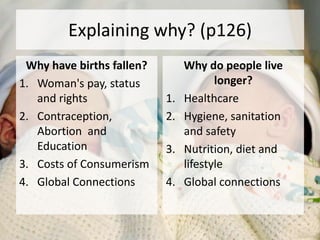
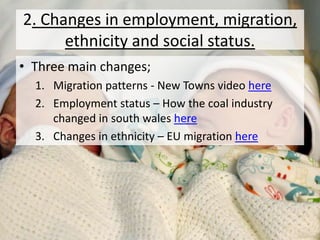
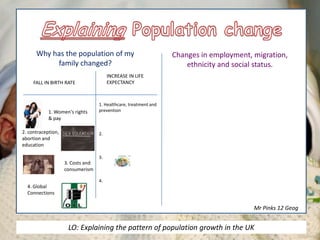
Todays lesson
LO: Explaining the pattern of population growth in the UK
Explaining patterns of
population change
1. Changes in Family size
and population structure
Video here
2. Changes in
employment, migration,
ethnicity and social status
LO: Explaining the pattern of population growth in the UK
• Where do you fit into 7 billion???
1. Changes in Family size and
population structure
• Two important phases of change; pre and post
1970
LO: Explaining the pattern of population growth in the UK
A. Pre 1970
• Population of Uk growing due to Natural
Increase (more …………………………..)
• Death rate had been falling since 1800 due to
improved food supply, health and hygiene. By
1950 it reached where it is still today.
• Birth rate fell later. It stopped in the 1970’s
with the end of the post war ……... ……………
LO: Explaining the pattern of population growth in the UK
1. Changes in Family size and
population structure
• 2 main
changes;
1. Falling
birth rates
2. Longer life
expectancy
LO: Explaining the pattern of population growth in the UK
B. Post 1970
• Population growth rate has slowed.
• Recent growth due to immigration, not ………….
………………..
• Low birth and death rates are low, resulting in
small families and long ………… ……………….
• Post 1970 people are more Secular. People are
more likely to reject religion and be tolerant of
abortion and contraception.
• Migrants into the UK are now of child-bearing age
and a small baby boom is resulting from this.
LO: Explaining the pattern of population growth in the UK
Explaining why? (p126)
Why have births fallen?
1. Woman's pay, status
and rights
2. Contraception,
Abortion and
Education
3. Costs of Consumerism
4. Global Connections
Why do people live
longer?
1. Healthcare
2. Hygiene, sanitation
and safety
3. Nutrition, diet and
lifestyle
4. Global connections
Video here
2. Changes in employment, migration,
ethnicity and social status.
• Three main changes;
1. Migration patterns - New Towns video here
2. Employment status – How the coal industry
changed in south wales here
3. Changes in ethnicity – EU migration here
Your Turn
• Design a poster that explains BOTH changes in
family size and structure AND changes in
employment, migration, ethnicity and social
status. Use p126-127 to help you.
• Include clip art / images to help as well.
• Here’s one I started earlier …
LO: Explaining the pattern of population growth in the UK
Why has the population of my
family changed?
Changes in employment, migration,
ethnicity and social status.
3. Costs and
consumerism
2. contraception,
abortion and
education
1. Women's rights
& pay
FALL IN BIRTH RATE
INCREASE IN LIFE
EXPECTANCY
1. Healthcare, treatment and
prevention
2.
3.
4.
4. Global
Connections
Mr Pinks 12 Geog
LO: Explaining the pattern of population growth in the UK

L8 explaining why has the uk’s population changed

  • 1.
    Todays lesson LO: Explainingthe pattern of population growth in the UK
  • 2.
    Explaining patterns of populationchange 1. Changes in Family size and population structure Video here 2. Changes in employment, migration, ethnicity and social status LO: Explaining the pattern of population growth in the UK
  • 3.
    • Where doyou fit into 7 billion???
  • 4.
    1. Changes inFamily size and population structure • Two important phases of change; pre and post 1970 LO: Explaining the pattern of population growth in the UK
  • 5.
    A. Pre 1970 •Population of Uk growing due to Natural Increase (more …………………………..) • Death rate had been falling since 1800 due to improved food supply, health and hygiene. By 1950 it reached where it is still today. • Birth rate fell later. It stopped in the 1970’s with the end of the post war ……... …………… LO: Explaining the pattern of population growth in the UK
  • 6.
    1. Changes inFamily size and population structure • 2 main changes; 1. Falling birth rates 2. Longer life expectancy LO: Explaining the pattern of population growth in the UK
  • 7.
    LO: Explaining thepattern of population growth in the UK
  • 8.
    B. Post 1970 •Population growth rate has slowed. • Recent growth due to immigration, not …………. ……………….. • Low birth and death rates are low, resulting in small families and long ………… ………………. • Post 1970 people are more Secular. People are more likely to reject religion and be tolerant of abortion and contraception. • Migrants into the UK are now of child-bearing age and a small baby boom is resulting from this. LO: Explaining the pattern of population growth in the UK
  • 10.
    Explaining why? (p126) Whyhave births fallen? 1. Woman's pay, status and rights 2. Contraception, Abortion and Education 3. Costs of Consumerism 4. Global Connections Why do people live longer? 1. Healthcare 2. Hygiene, sanitation and safety 3. Nutrition, diet and lifestyle 4. Global connections
  • 11.
  • 12.
    2. Changes inemployment, migration, ethnicity and social status. • Three main changes; 1. Migration patterns - New Towns video here 2. Employment status – How the coal industry changed in south wales here 3. Changes in ethnicity – EU migration here
  • 13.
    Your Turn • Designa poster that explains BOTH changes in family size and structure AND changes in employment, migration, ethnicity and social status. Use p126-127 to help you. • Include clip art / images to help as well. • Here’s one I started earlier … LO: Explaining the pattern of population growth in the UK
  • 14.
    Why has thepopulation of my family changed? Changes in employment, migration, ethnicity and social status. 3. Costs and consumerism 2. contraception, abortion and education 1. Women's rights & pay FALL IN BIRTH RATE INCREASE IN LIFE EXPECTANCY 1. Healthcare, treatment and prevention 2. 3. 4. 4. Global Connections Mr Pinks 12 Geog LO: Explaining the pattern of population growth in the UK
  • 15.
    LO: Explaining thepattern of population growth in the UK