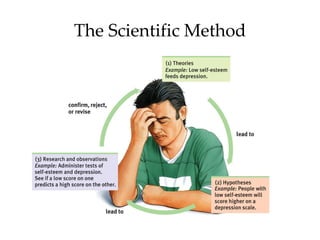
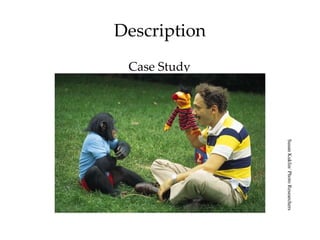
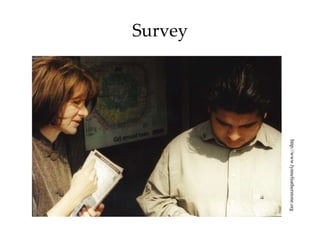
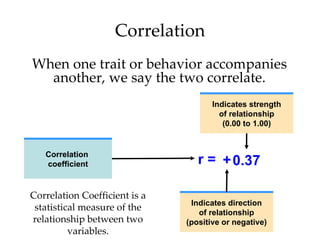
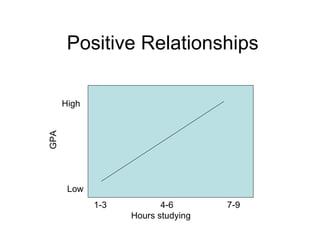
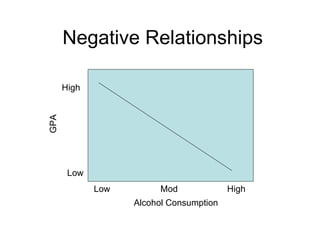
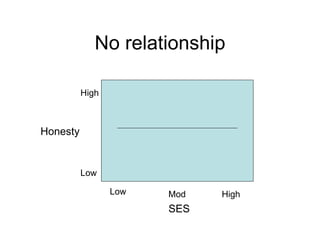
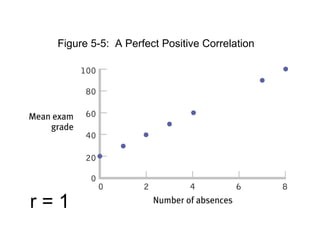
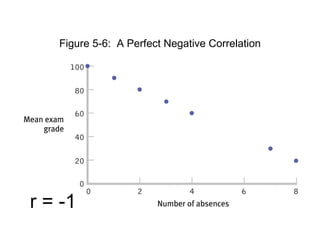
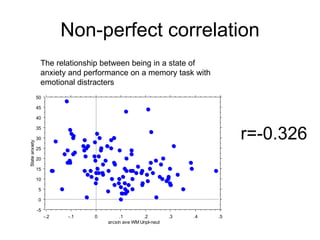
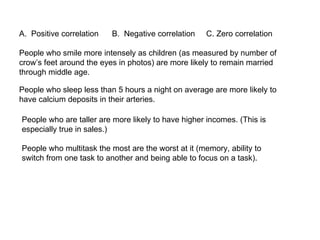
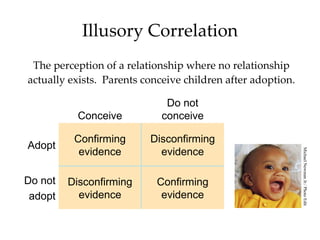
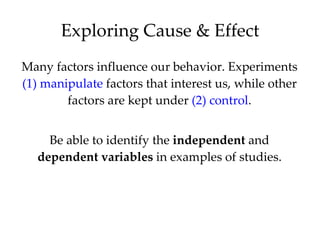
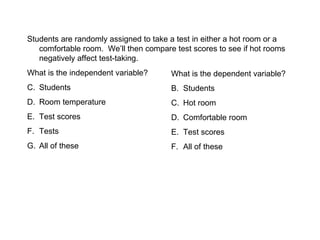
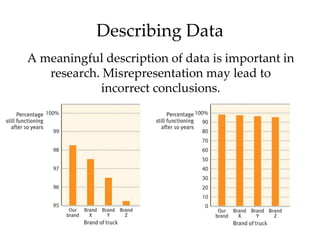
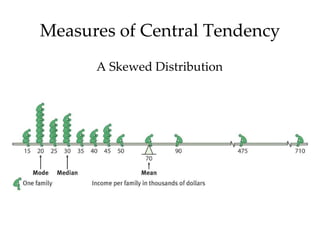
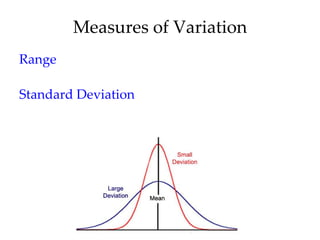
Lecture 2 Ch. 1 Psychological Science
Lecture 2 Why do we need to use a scientific approach? What does science value? The Scientific Method Experimental Designs Correlation vs. Causation In-class Activity 1 Research Ethics
Why do we need to use a scientific approach? Are intuition and common sense enough?
What characteristics are valued in scientists?
The Scientific Method
Methods for studying Psychology Be able to identify each method Know the pros and cons for using each method
Description Case Study Susan Kuklin/ Photo Researchers
Survey http://www.lynnefeatherstone.org
Naturalistic Observation Courtesy of Gilda Morelli
How well do you understand correlations? I get it! I’m almost there. Sort of. Not really. I have no clue what you’re talking about.
Correlation Correlation Coefficient is a statistical measure of the relationship between two variables. When one trait or behavior accompanies another, we say the two correlate. r = 0.37 + Correlation  coefficient Indicates direction of relationship (positive or negative) Indicates strength of relationship (0.00 to 1.00)
Positive Relationships High Low GPA 1-3 4-6 7-9 Hours studying
Negative Relationships High Low GPA Low Mod High Alcohol Consumption
No relationship Honesty High Low SES Low Mod High
Figure 5-5:  A Perfect Positive Correlation r = 1
Figure 5-6:  A Perfect Negative Correlation r = -1
Non-perfect correlation The relationship between being in a state of anxiety and performance on a memory task with emotional distracters r=-0.326
People who smile more intensely as children (as measured by number of crow’s feet around the eyes in photos) are more likely to remain married through middle age. Positive correlation  B.  Negative correlation  C. Zero correlation People who sleep less than 5 hours a night on average are more likely to have calcium deposits in their arteries. People who are taller are more likely to have higher incomes. (This is especially true in sales.) People who multitask the most are the worst at it (memory, ability to switch from one task to another and being able to focus on a task).
Illusory Correlation The perception of a relationship where no relationship actually exists.  Parents conceive children after adoption. Michael Newman Jr./ Photo Edit Confirming evidence Disconfirming evidence Do not adopt Disconfirming evidence Confirming evidence Adopt Do not conceive Conceive
Many factors influence our behavior. Experiments  (1)   manipulate  factors that interest us, while other factors are kept under  (2) control . Be able to identify the  independent  and  dependent   variables  in examples of studies. Exploring Cause & Effect
Students are randomly assigned to take a test in either a hot room or a comfortable room.  We’ll then compare test scores to see if hot rooms negatively affect test-taking.  What is the independent variable? Students Room temperature Test scores Tests All of these What is the dependent variable? Students Hot room Comfortable room Test scores All of these
Describing Data A meaningful description of data is important in research. Misrepresentation may lead to incorrect conclusions.
Measures of Central Tendency A Skewed Distribution
Measures of Variation Range Standard Deviation
Evaluating the results of a study What increases the chance that a difference between groups is a real, reliable effect?
Research Ethics Animal research Human research
In-class activity 1 Get into groups of 2-4 Make sure you turn in the handout with all your names on it

L2 scientificmethods

  • 1.
    Lecture 2 Ch.1 Psychological Science
  • 2.
    Lecture 2 Whydo we need to use a scientific approach? What does science value? The Scientific Method Experimental Designs Correlation vs. Causation In-class Activity 1 Research Ethics
  • 3.
    Why do weneed to use a scientific approach? Are intuition and common sense enough?
  • 4.
    What characteristics arevalued in scientists?
  • 5.
  • 6.
    Methods for studyingPsychology Be able to identify each method Know the pros and cons for using each method
  • 7.
    Description Case StudySusan Kuklin/ Photo Researchers
  • 8.
  • 9.
  • 10.
    How well doyou understand correlations? I get it! I’m almost there. Sort of. Not really. I have no clue what you’re talking about.
  • 11.
    Correlation Correlation Coefficientis a statistical measure of the relationship between two variables. When one trait or behavior accompanies another, we say the two correlate. r = 0.37 + Correlation coefficient Indicates direction of relationship (positive or negative) Indicates strength of relationship (0.00 to 1.00)
  • 12.
    Positive Relationships HighLow GPA 1-3 4-6 7-9 Hours studying
  • 13.
    Negative Relationships HighLow GPA Low Mod High Alcohol Consumption
  • 14.
    No relationship HonestyHigh Low SES Low Mod High
  • 15.
    Figure 5-5: A Perfect Positive Correlation r = 1
  • 16.
    Figure 5-6: A Perfect Negative Correlation r = -1
  • 17.
    Non-perfect correlation Therelationship between being in a state of anxiety and performance on a memory task with emotional distracters r=-0.326
  • 18.
    People who smilemore intensely as children (as measured by number of crow’s feet around the eyes in photos) are more likely to remain married through middle age. Positive correlation B. Negative correlation C. Zero correlation People who sleep less than 5 hours a night on average are more likely to have calcium deposits in their arteries. People who are taller are more likely to have higher incomes. (This is especially true in sales.) People who multitask the most are the worst at it (memory, ability to switch from one task to another and being able to focus on a task).
  • 19.
    Illusory Correlation Theperception of a relationship where no relationship actually exists. Parents conceive children after adoption. Michael Newman Jr./ Photo Edit Confirming evidence Disconfirming evidence Do not adopt Disconfirming evidence Confirming evidence Adopt Do not conceive Conceive
  • 20.
    Many factors influenceour behavior. Experiments (1) manipulate factors that interest us, while other factors are kept under (2) control . Be able to identify the independent and dependent variables in examples of studies. Exploring Cause & Effect
  • 21.
    Students are randomlyassigned to take a test in either a hot room or a comfortable room. We’ll then compare test scores to see if hot rooms negatively affect test-taking. What is the independent variable? Students Room temperature Test scores Tests All of these What is the dependent variable? Students Hot room Comfortable room Test scores All of these
  • 22.
    Describing Data Ameaningful description of data is important in research. Misrepresentation may lead to incorrect conclusions.
  • 23.
    Measures of CentralTendency A Skewed Distribution
  • 24.
    Measures of VariationRange Standard Deviation
  • 25.
    Evaluating the resultsof a study What increases the chance that a difference between groups is a real, reliable effect?
  • 26.
    Research Ethics Animalresearch Human research
  • 27.
    In-class activity 1Get into groups of 2-4 Make sure you turn in the handout with all your names on it

Editor's Notes

  • #12 Preview Question 5: What are positive and negative correlations, and why do they enable prediction but not cause-effect explanation?
  • #13 Increases in the values of one variable are associated with increases in the second variable
  • #14 Increases in the values of one variable are associated with decreases in the second variable
  • #15 There is no relationship between two variables
  • #19 Kids’ smiles & marital success ( http://www.scientificamerican.com/article.cfm?id=kids-smiles-predict-their-future ) Sleep & heart disease: http://www.nytimes.com/2008/12/24/health/research/24sleep.html Judge, T.A. & Cable, D.M. (2004). The effect of physical height on workplace success and income: Preliminary test of a theoretical model. Journal of Applied Psychology, 89, 428-444. Multitasking (Not ignoring irrelevant information): http://www.msnbc.msn.com/id/32541721/ns/health-mental_health
  • #20 Preview Question 6: What are illusory correlations?
  • #23 Preview Question 8: How can we describe data with measures of central tendency and variation?