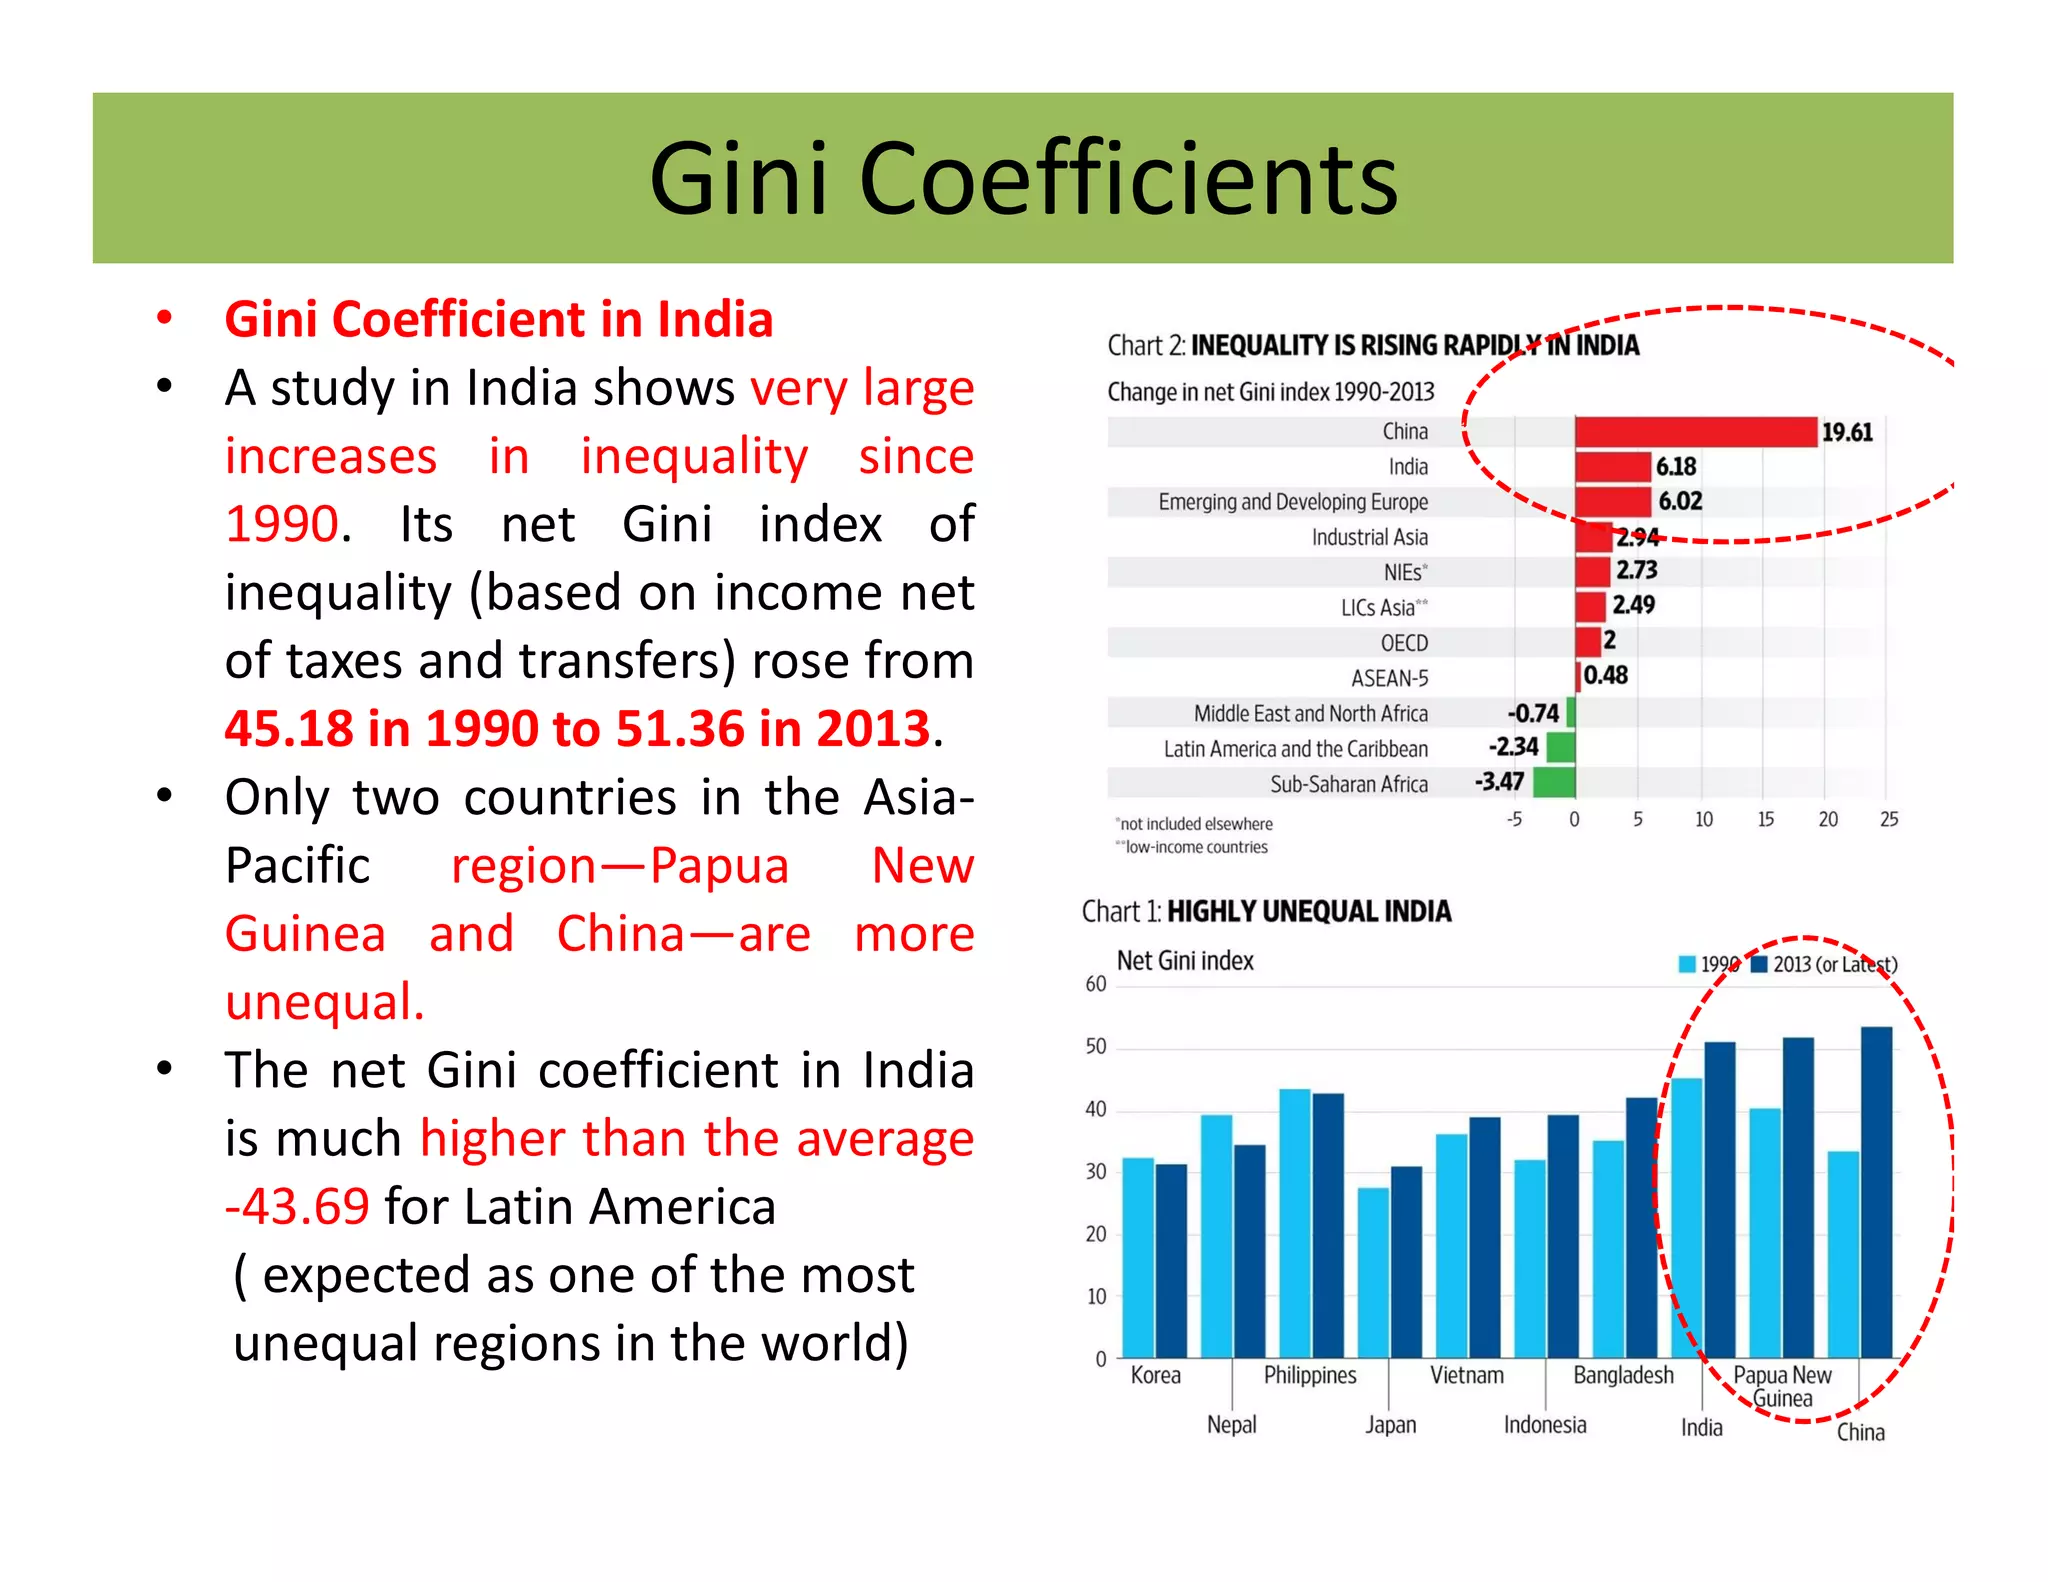
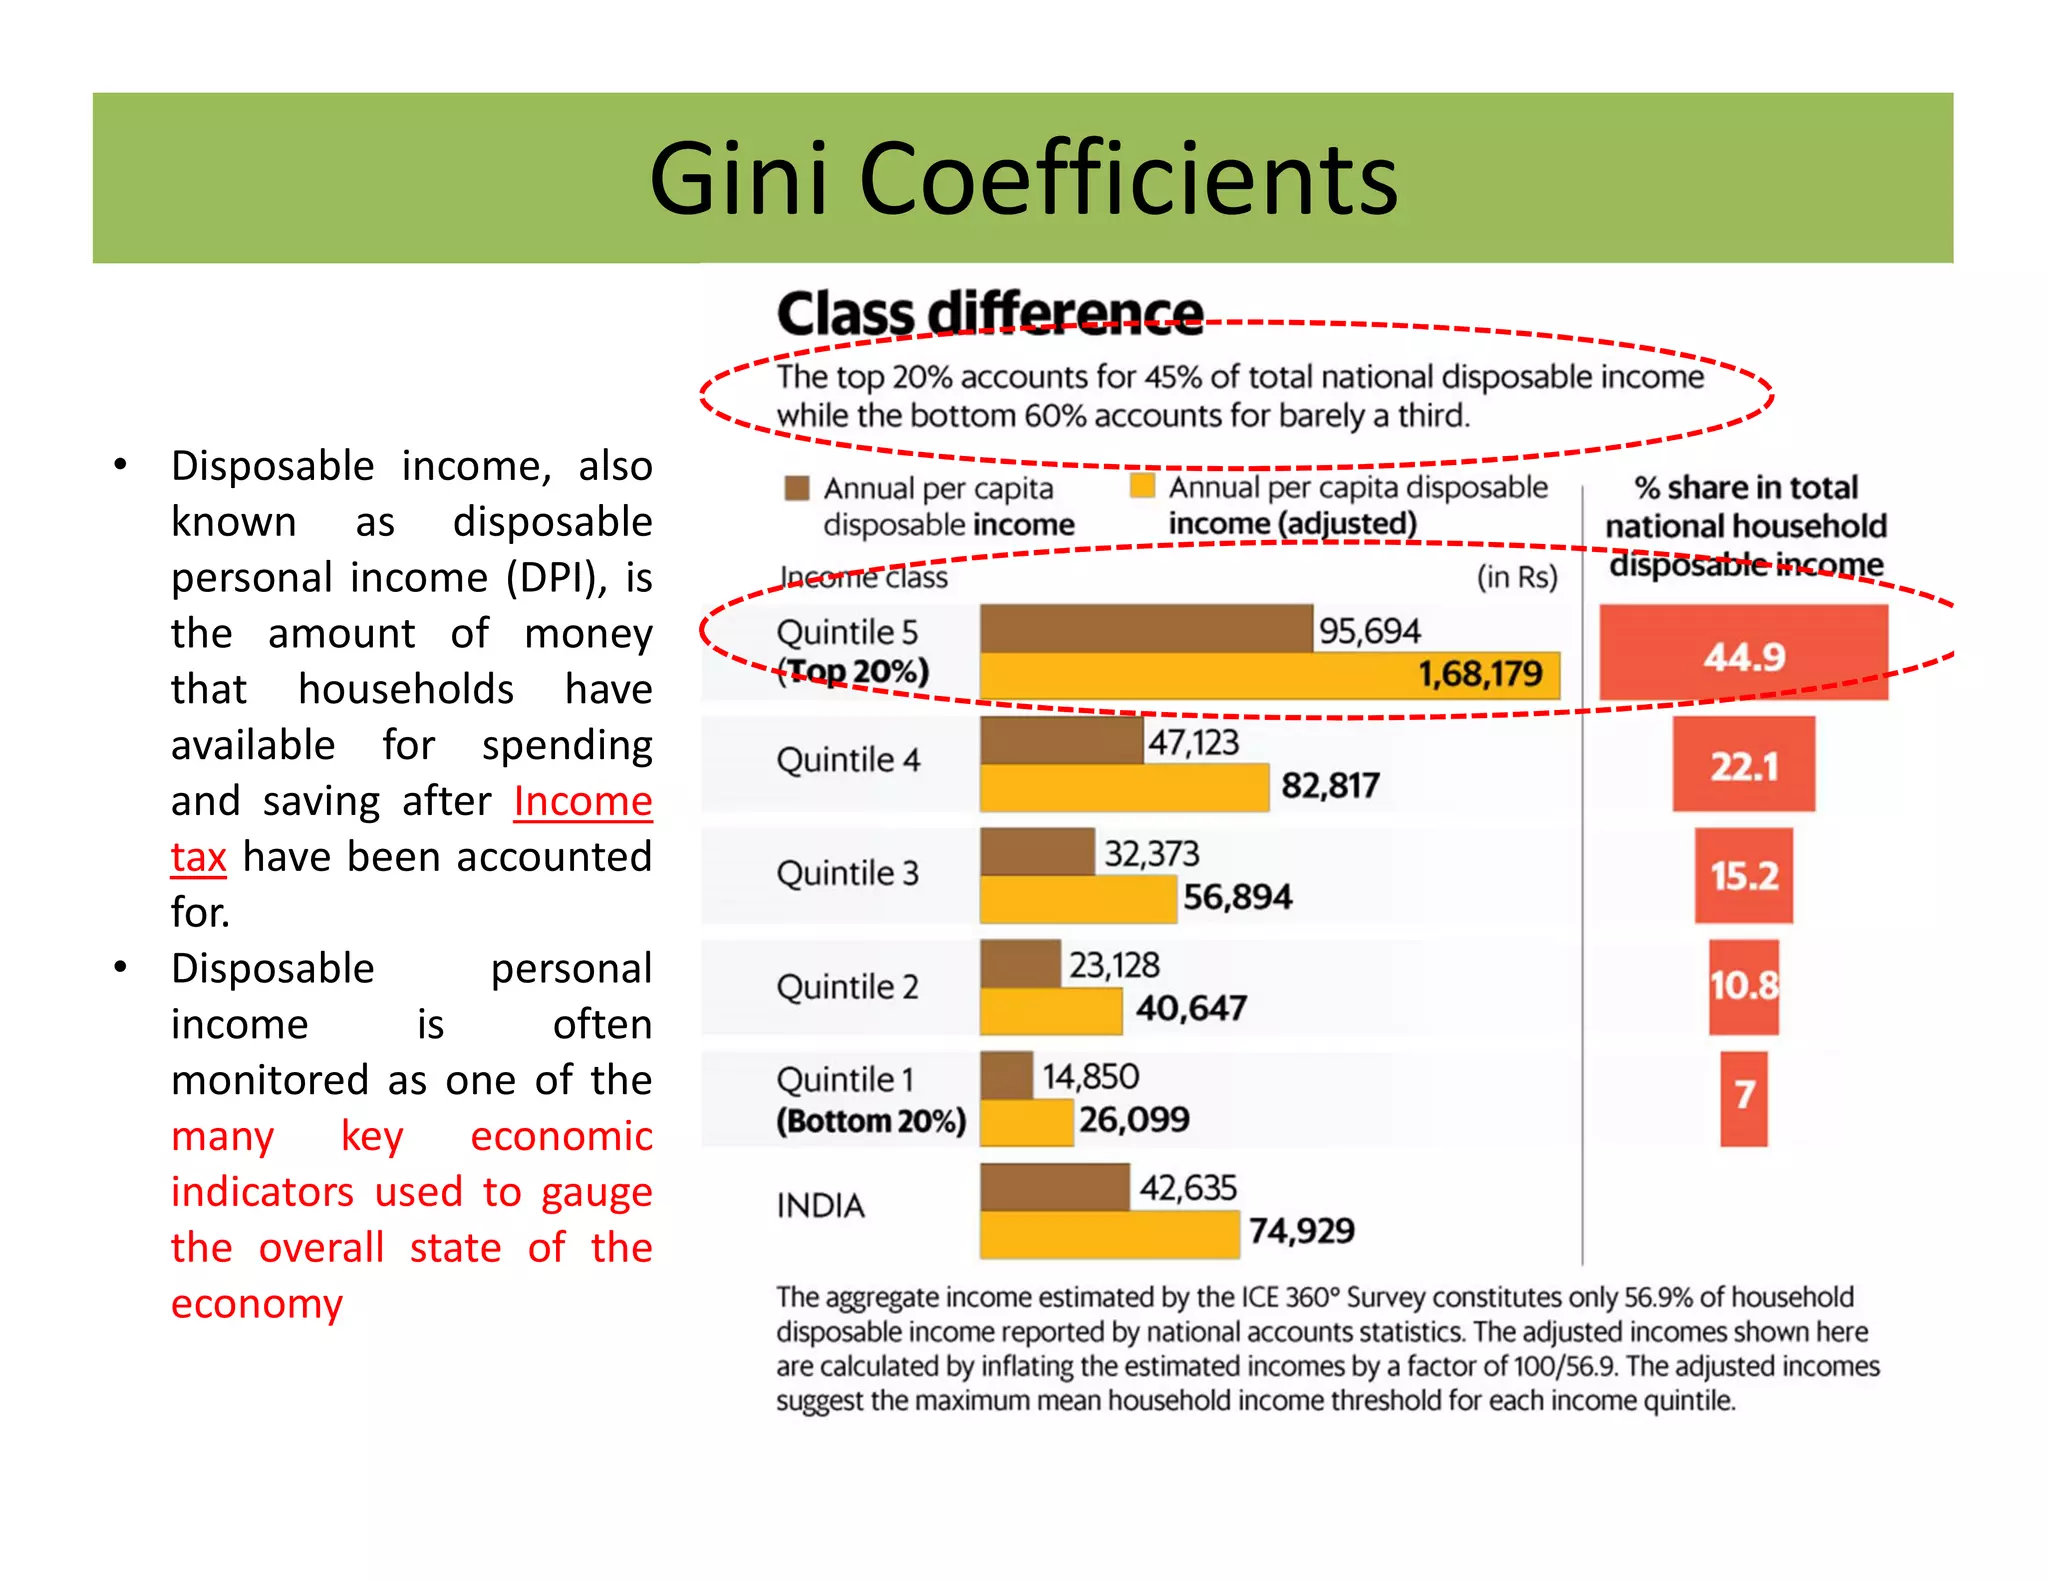
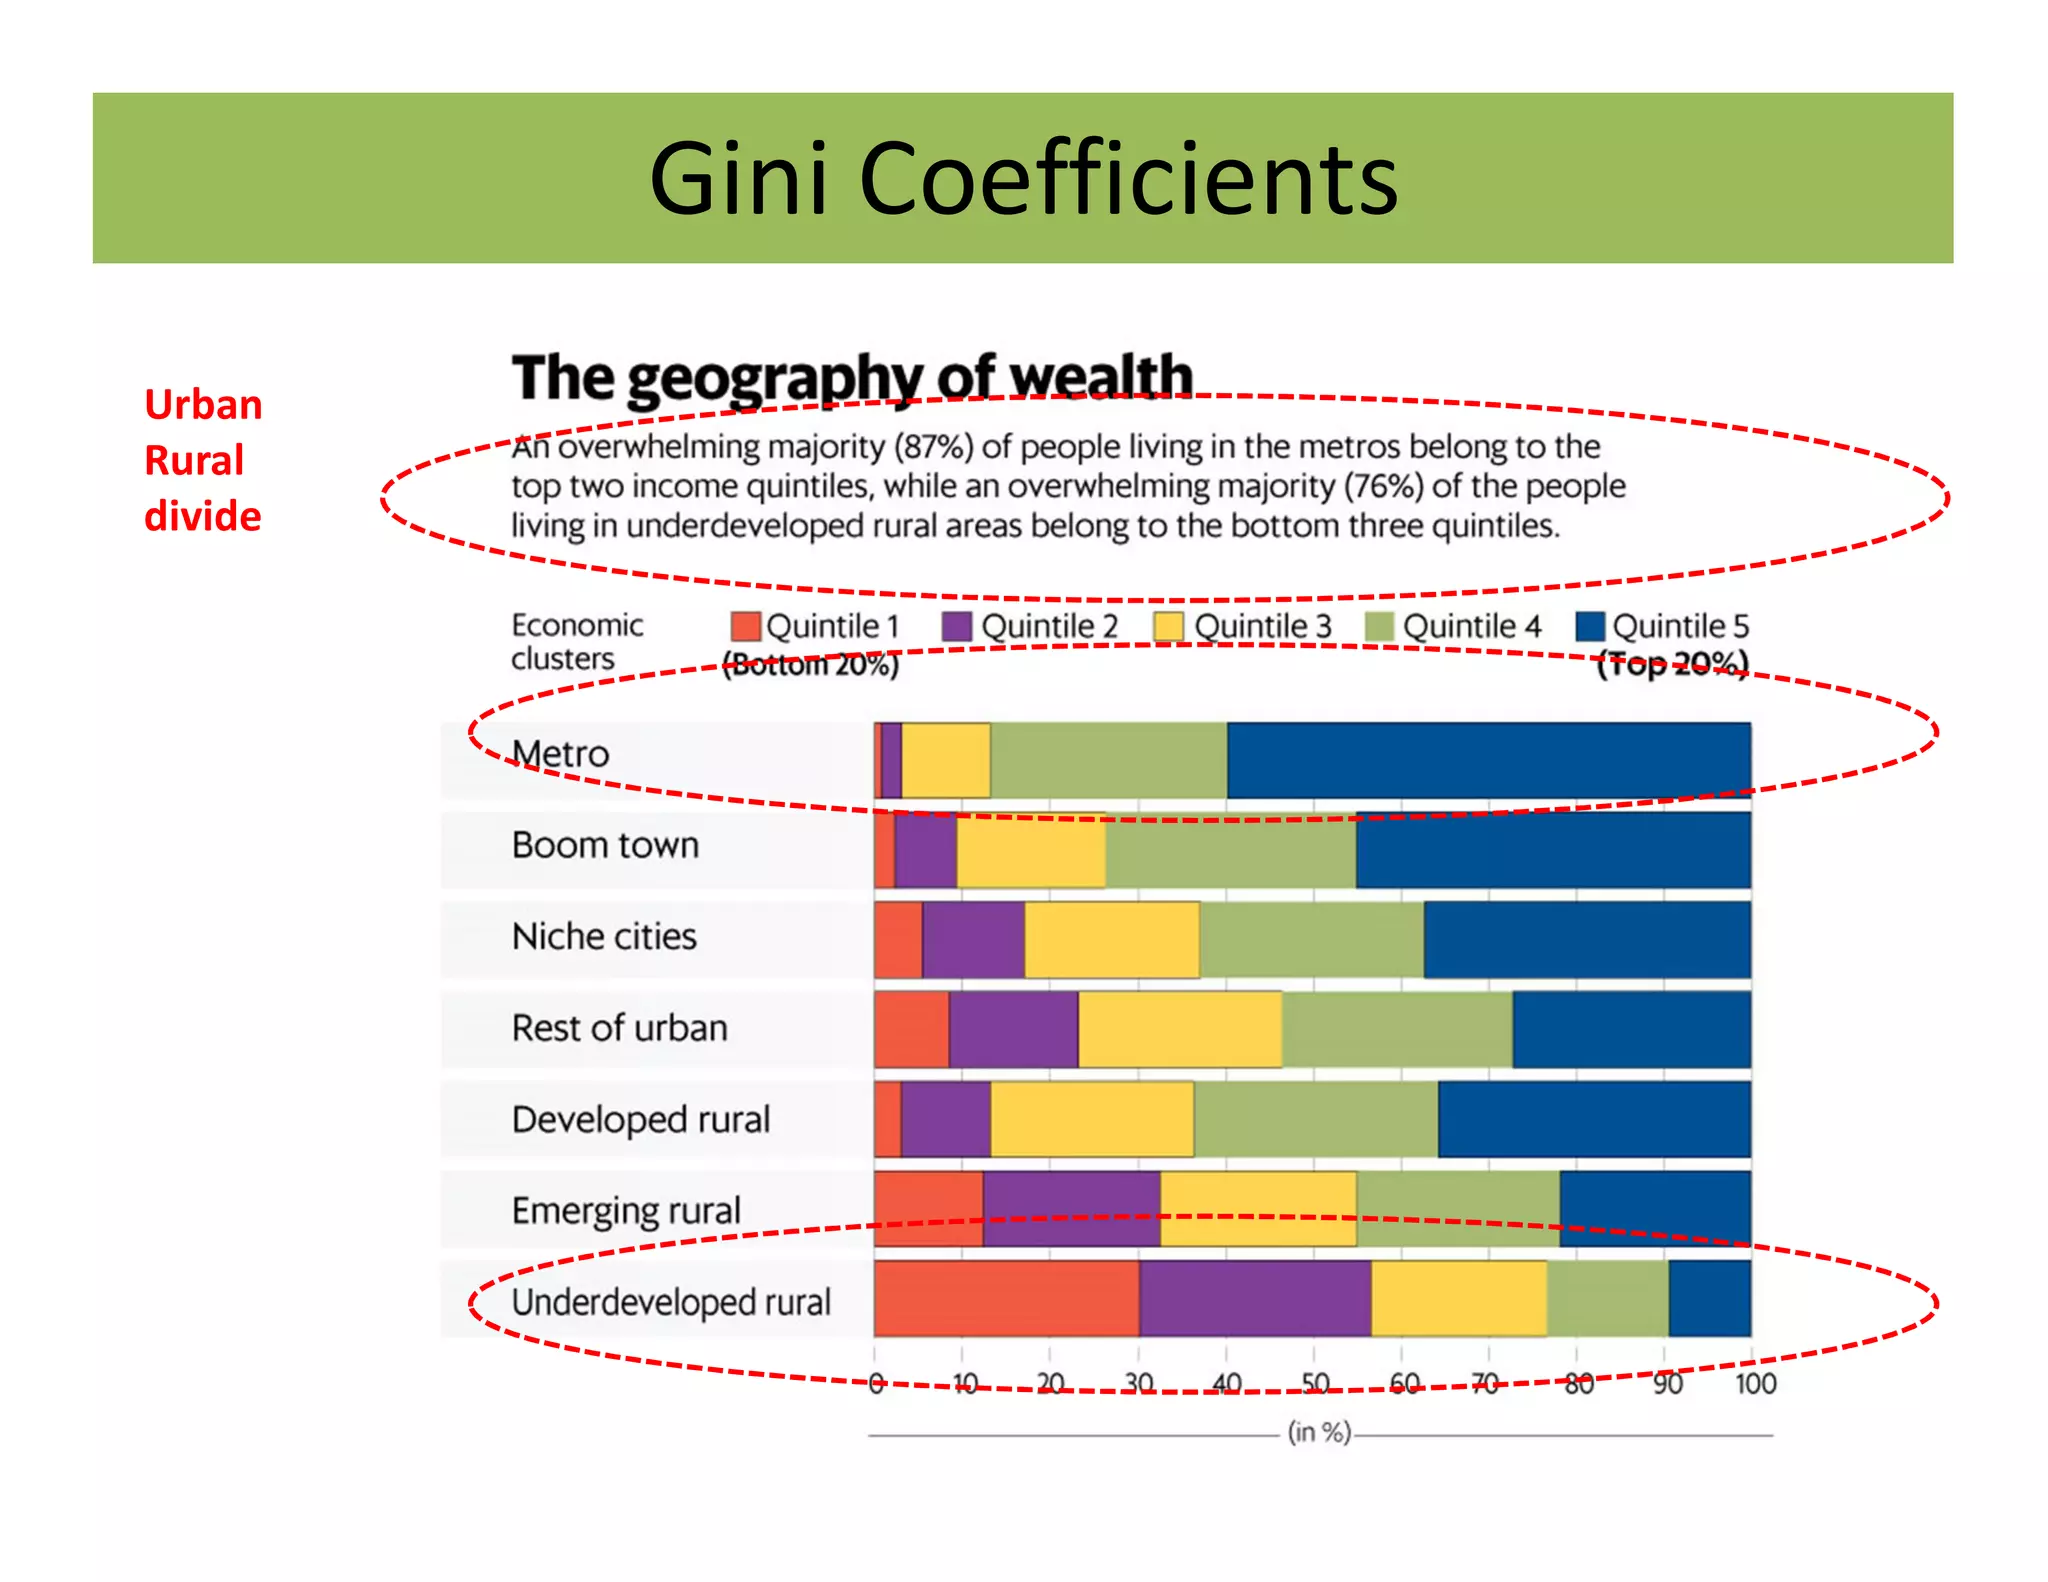
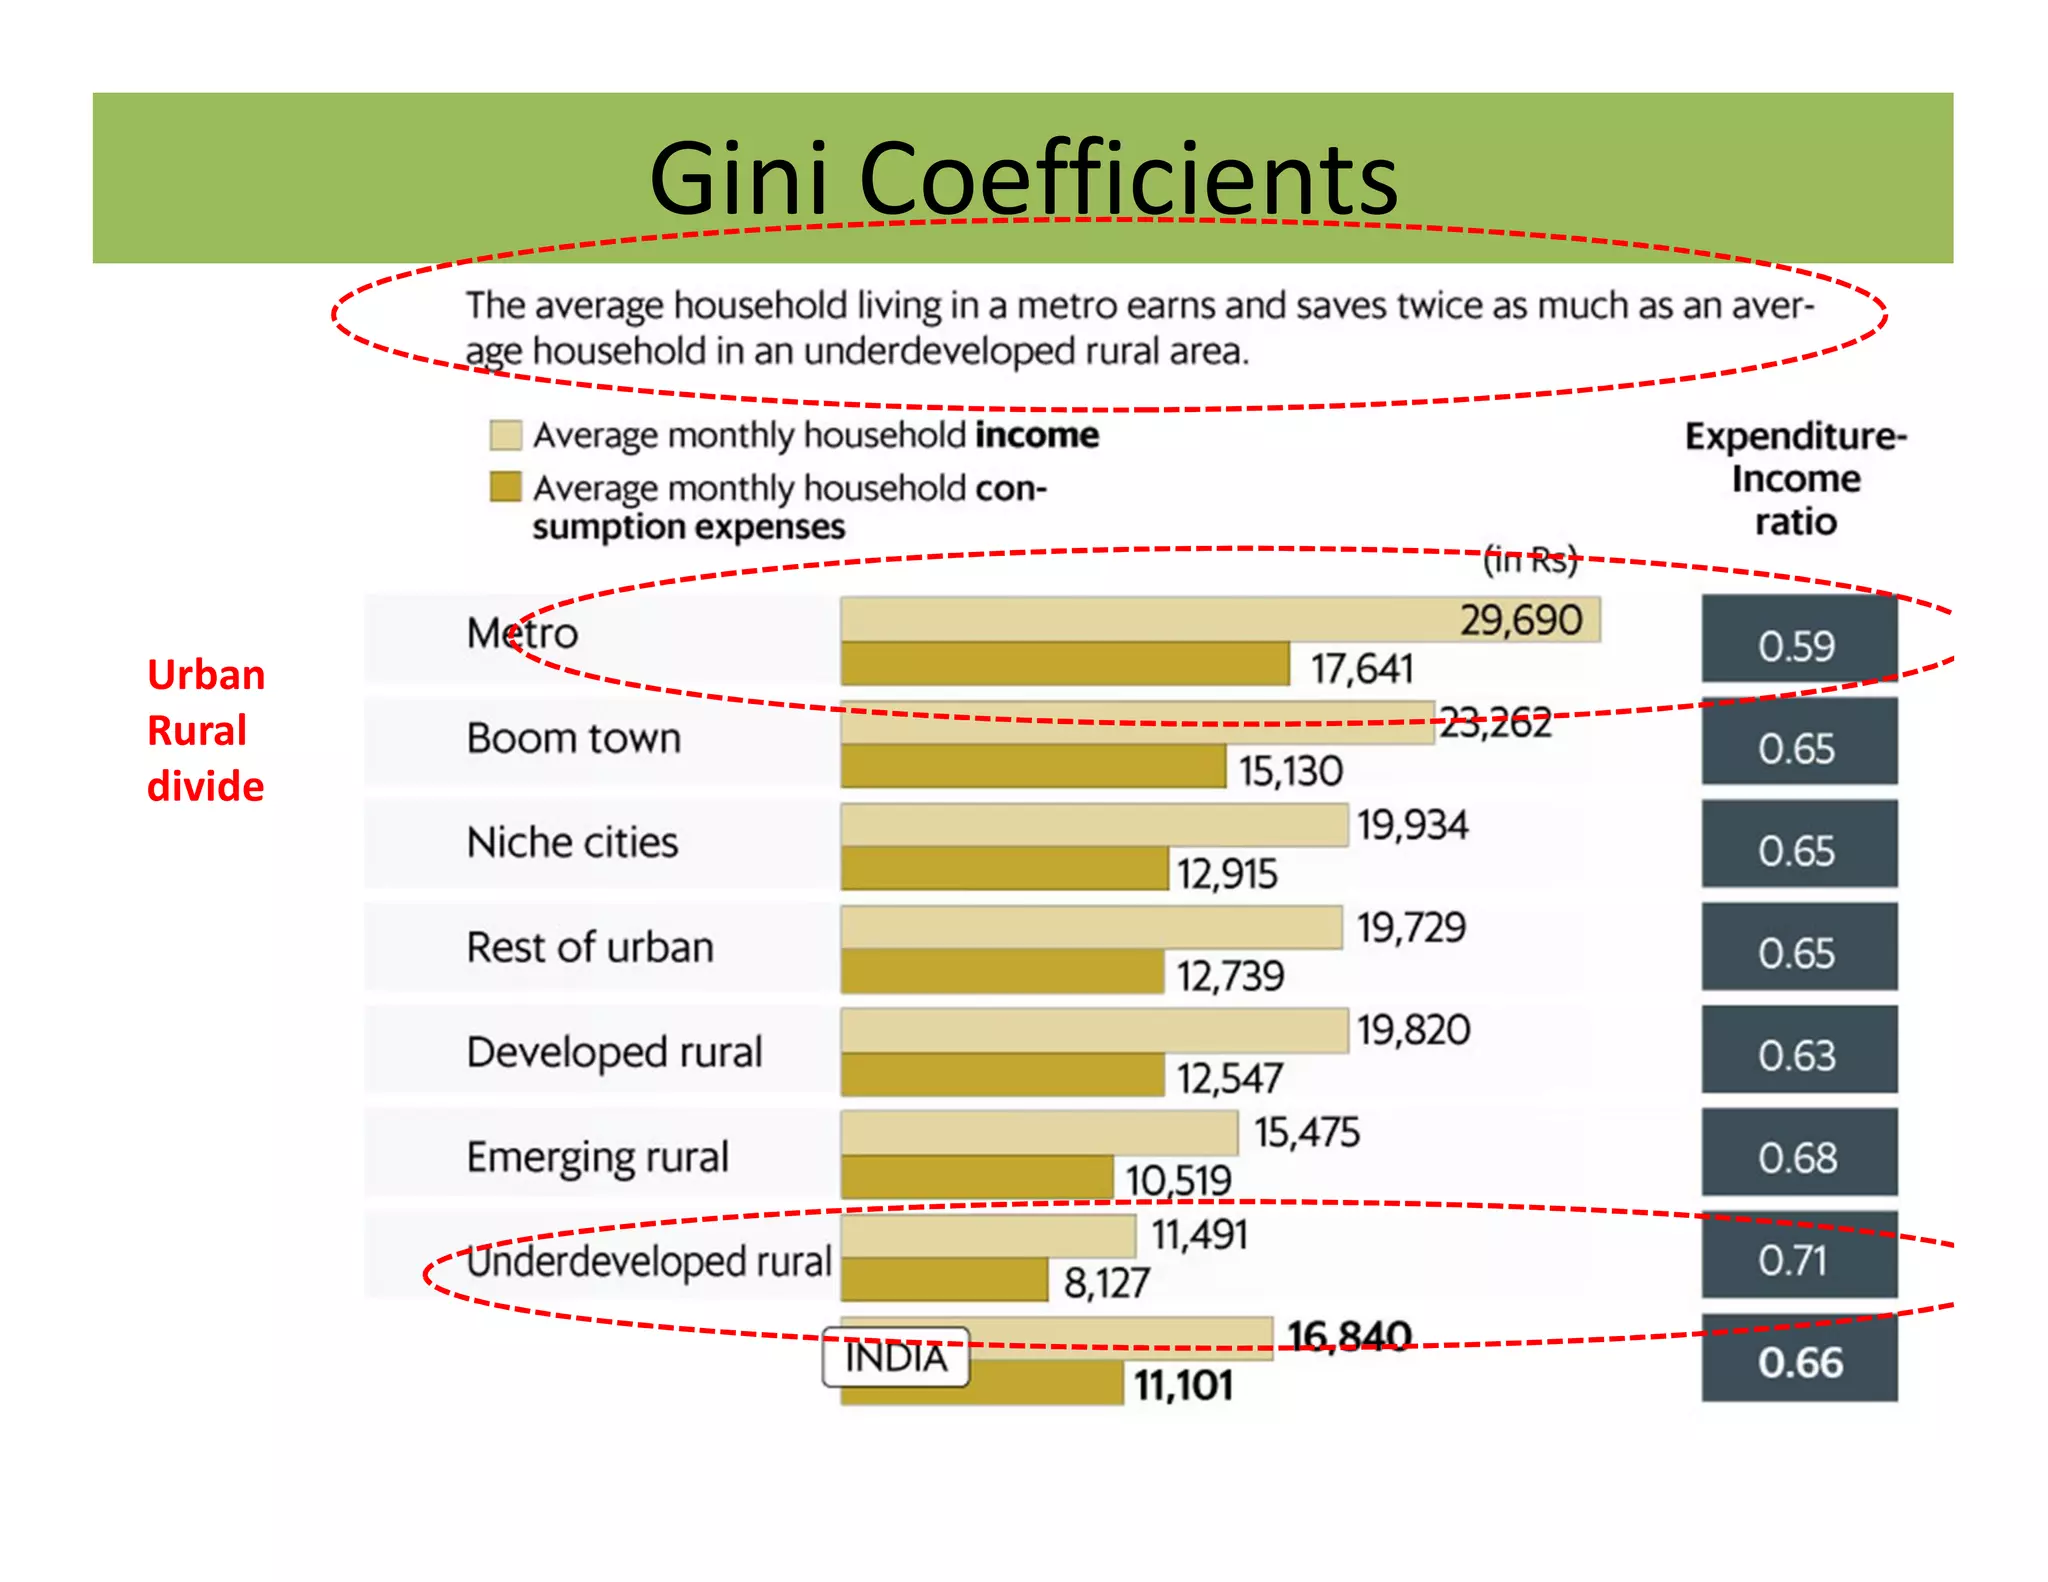
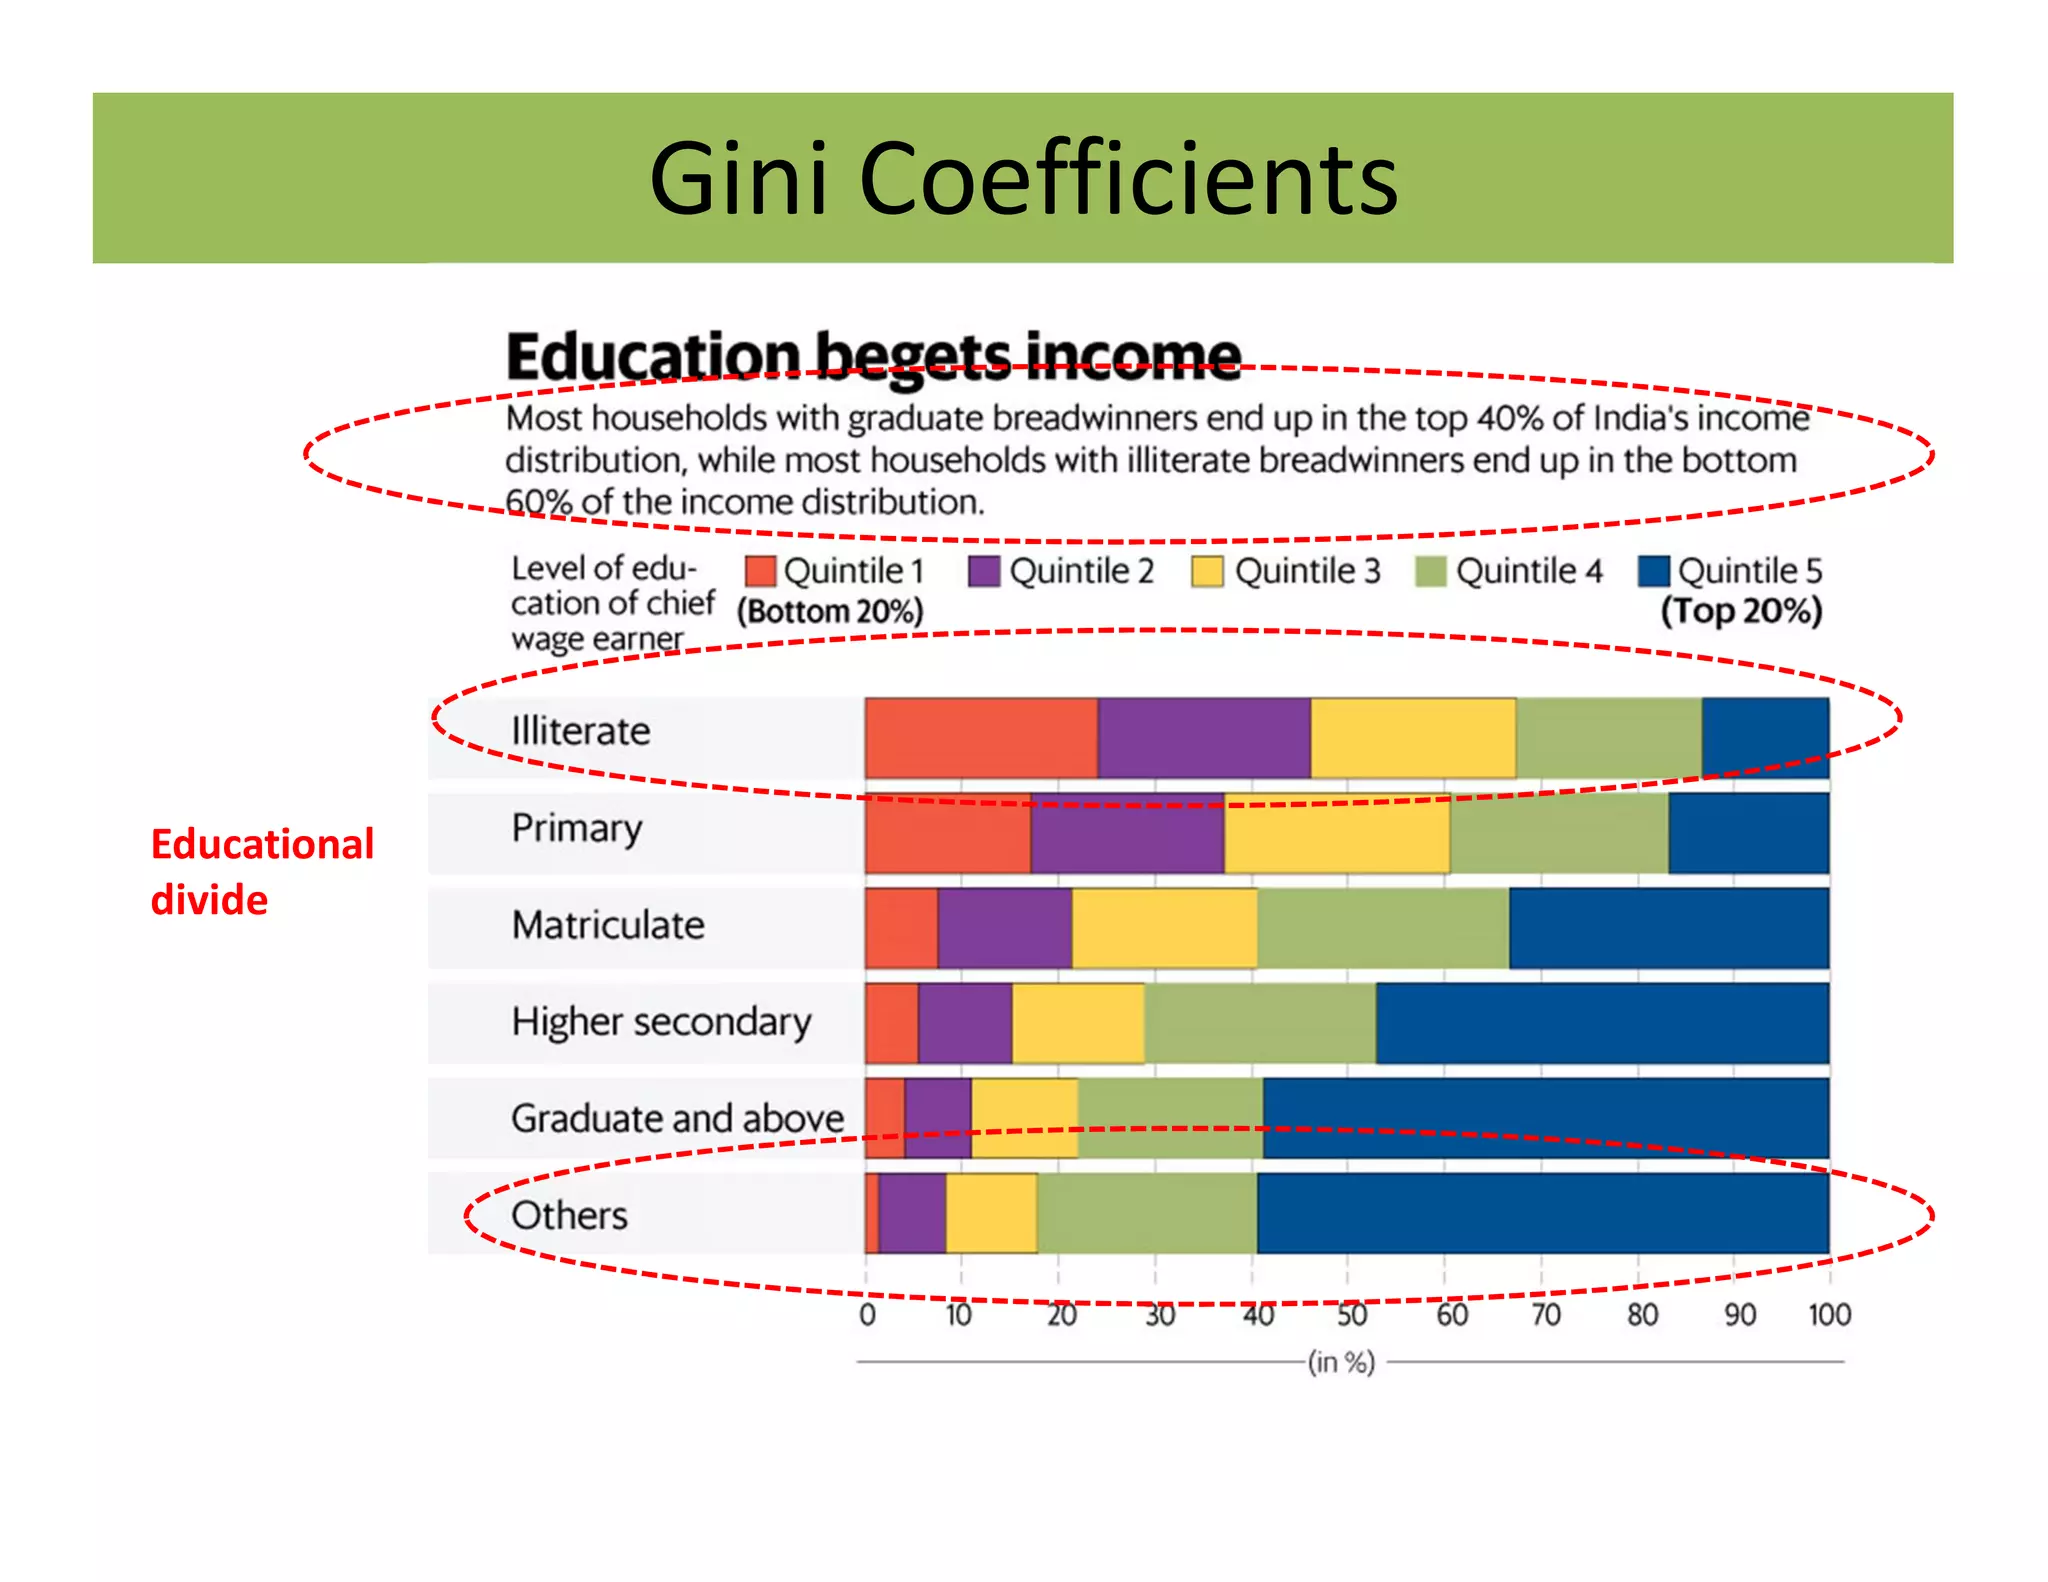
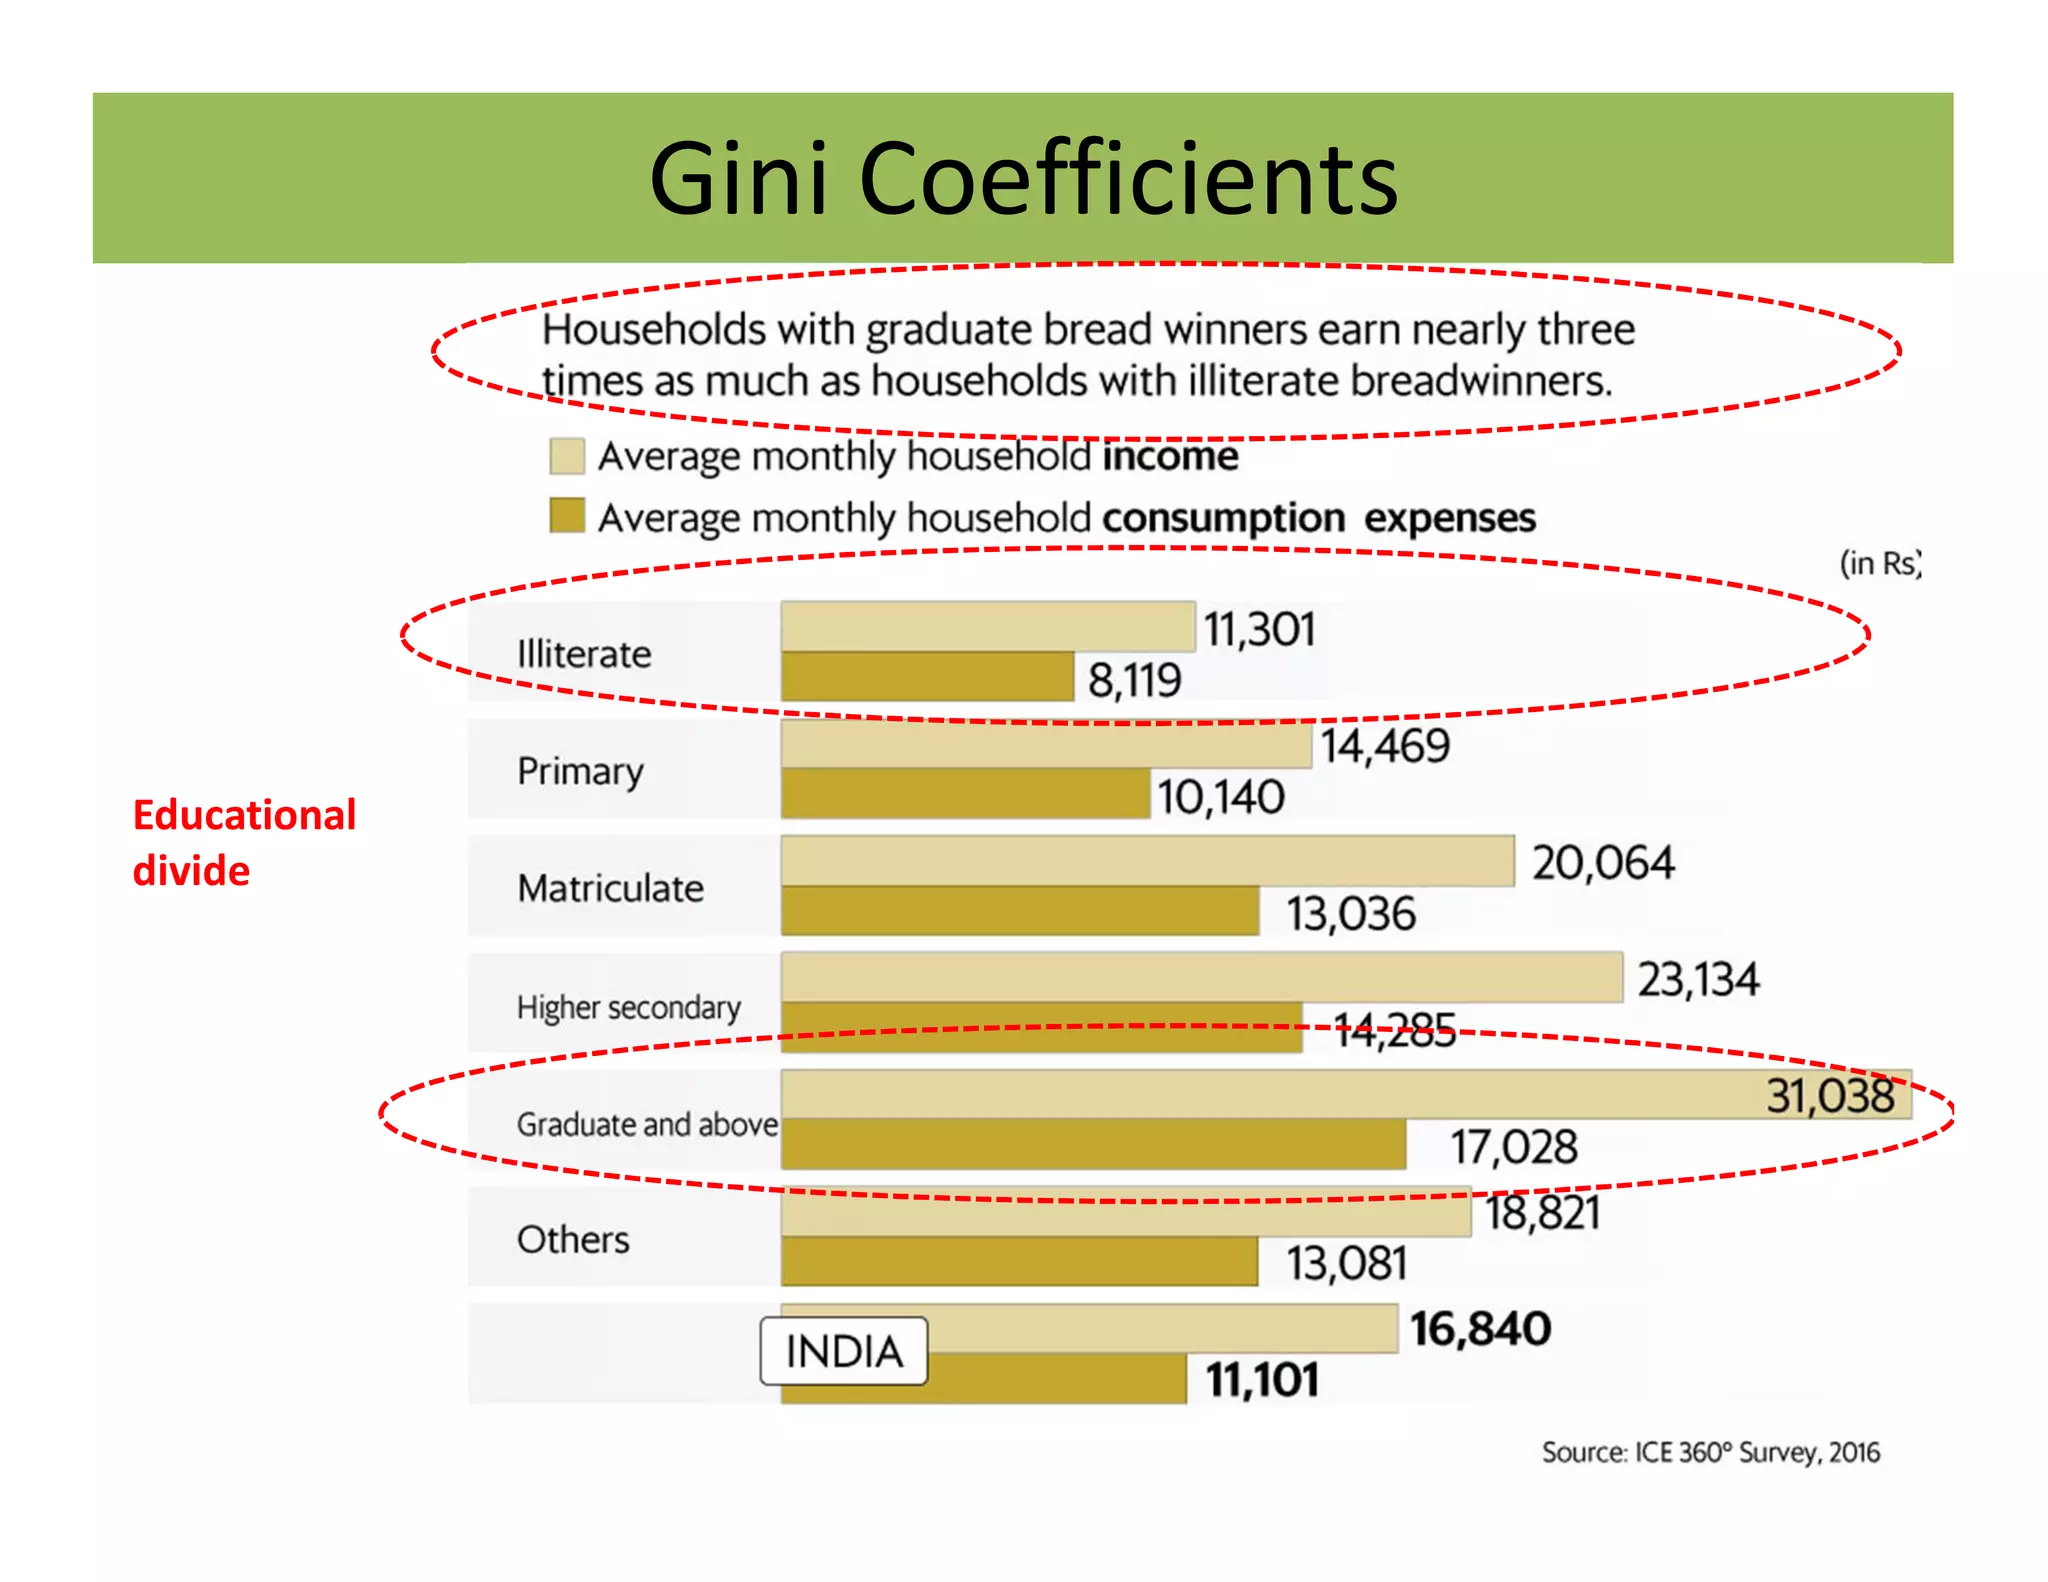
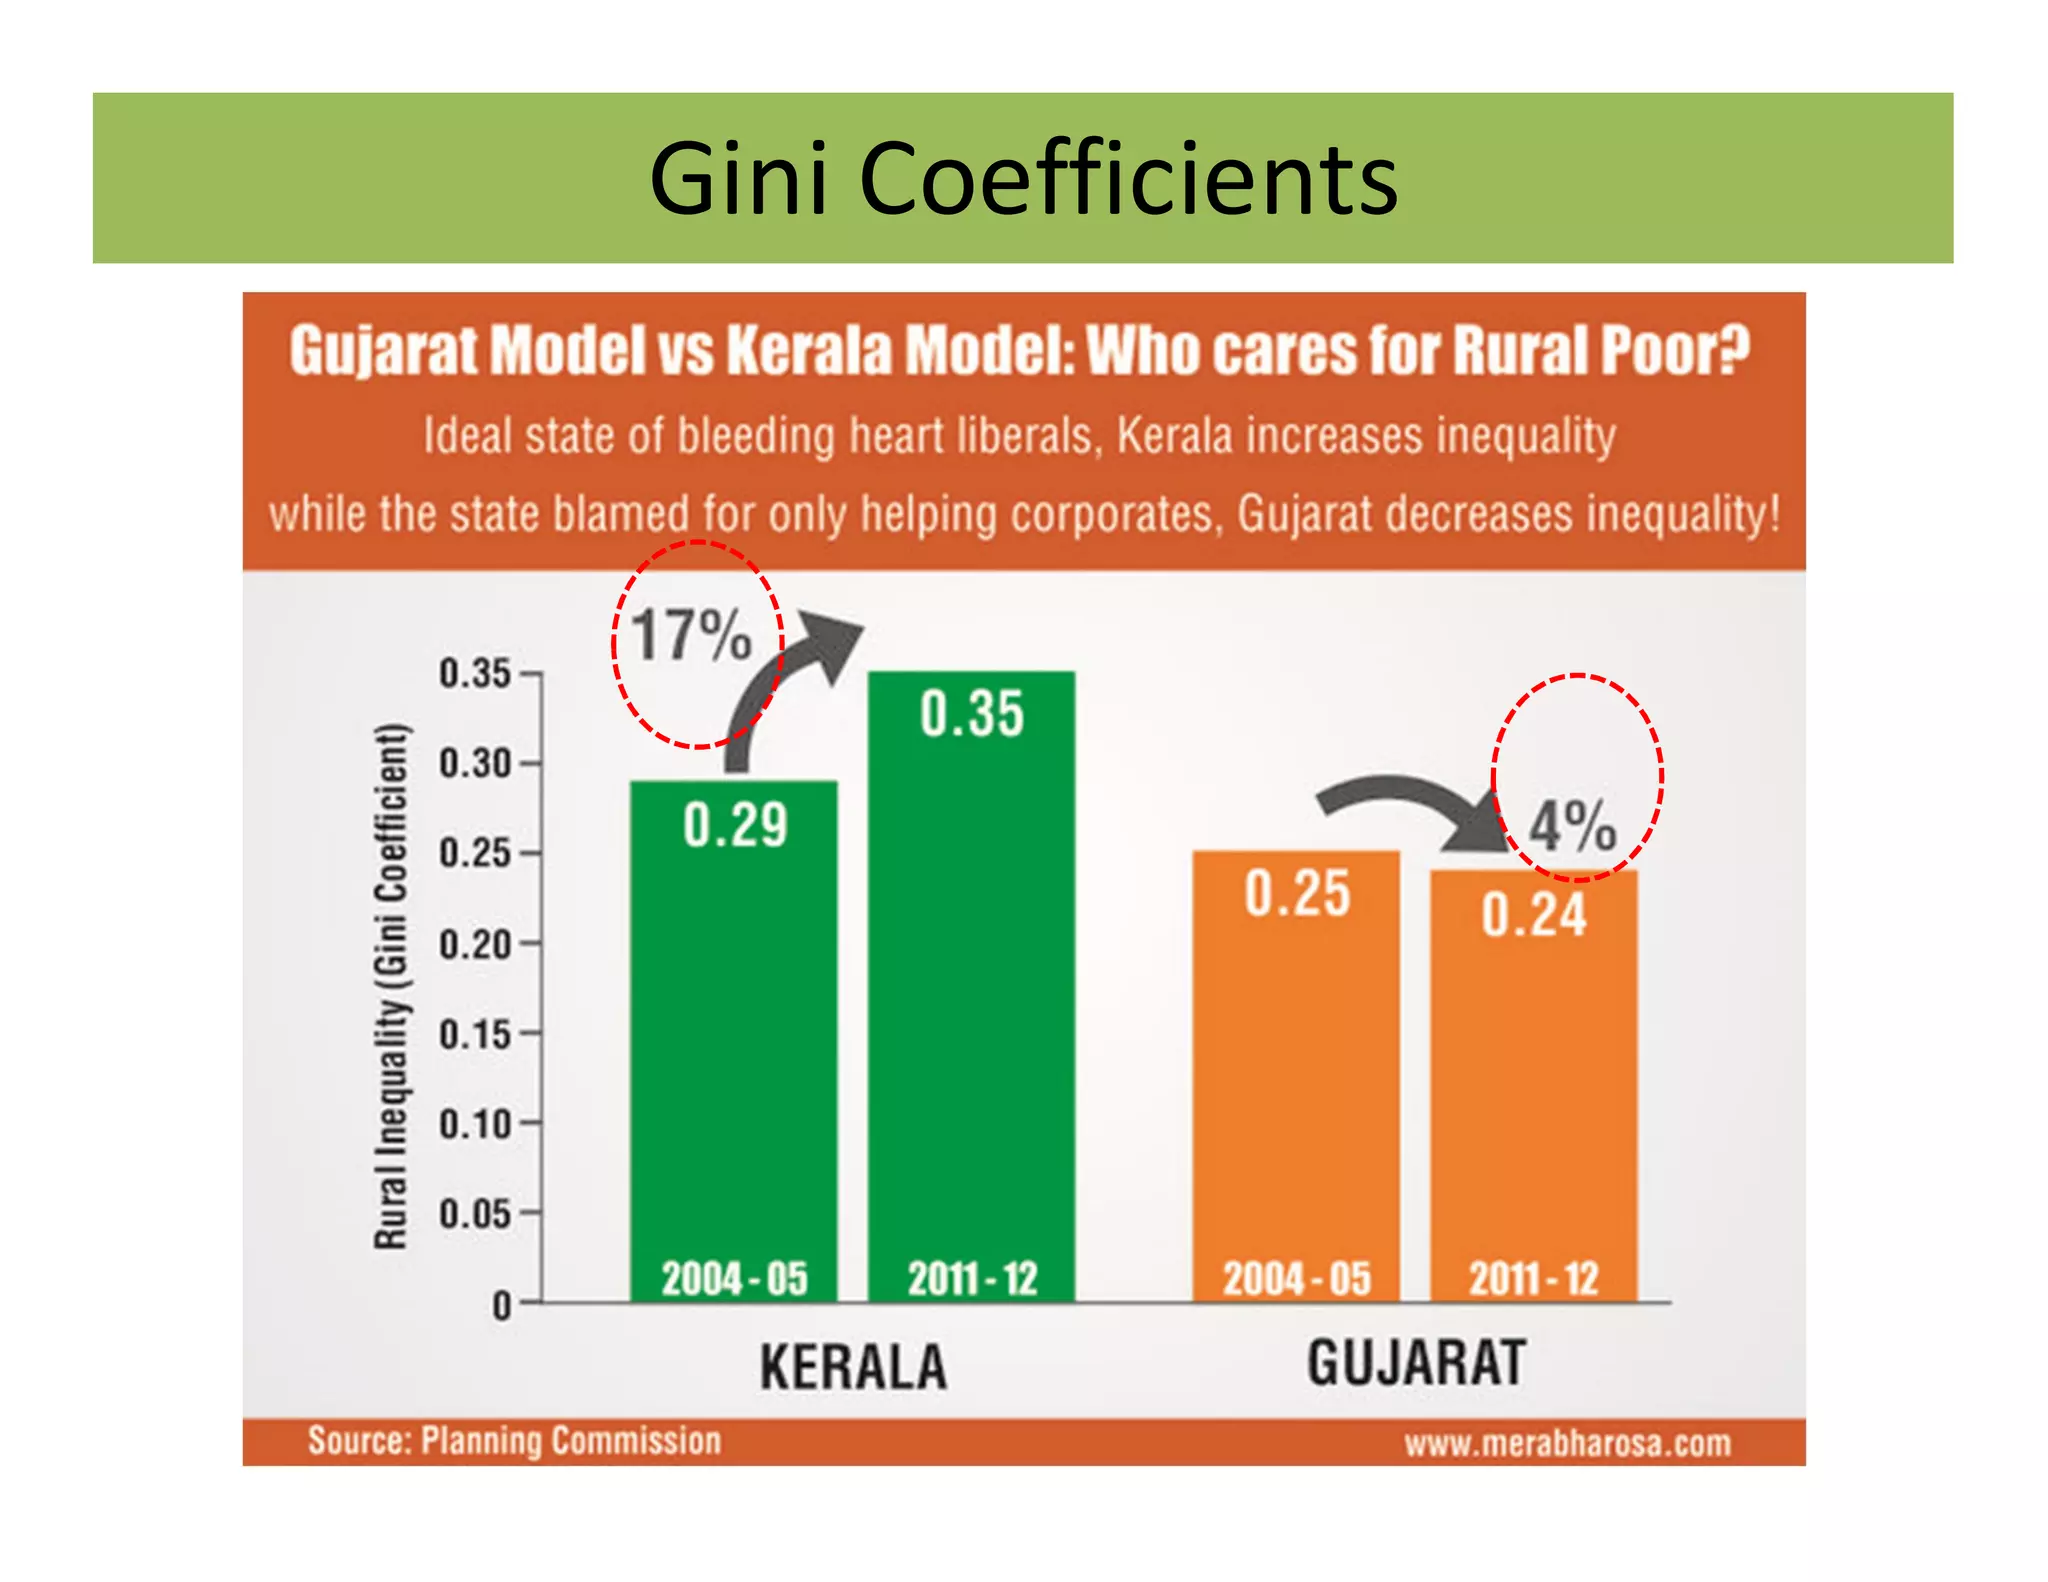
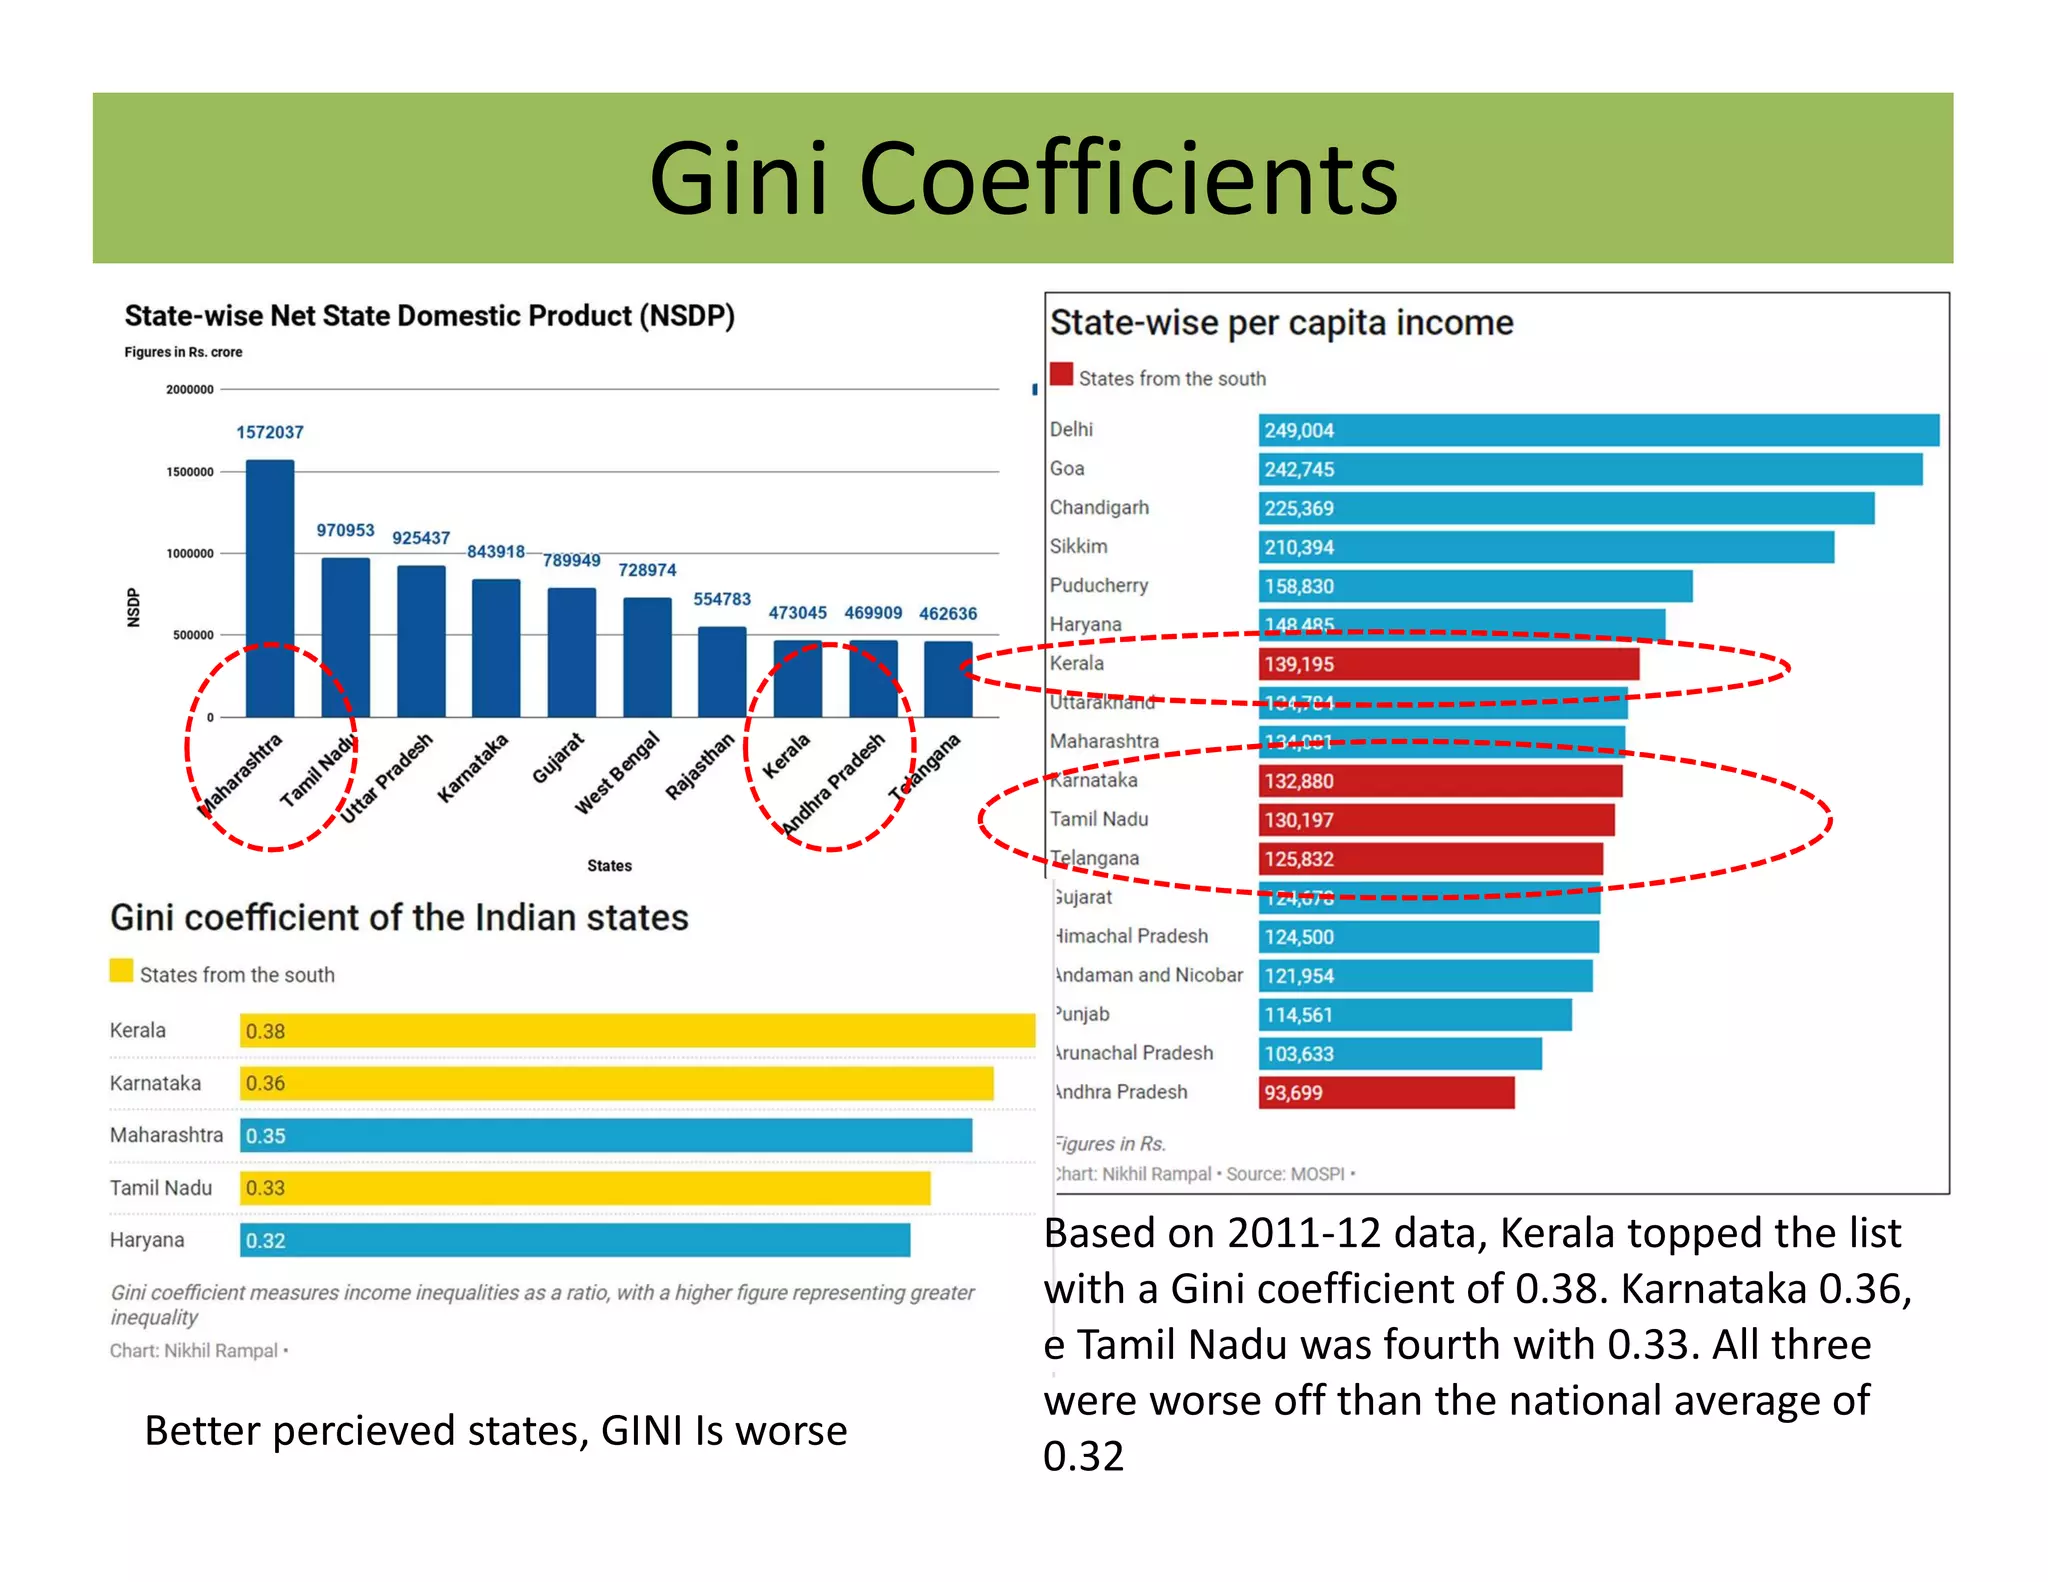
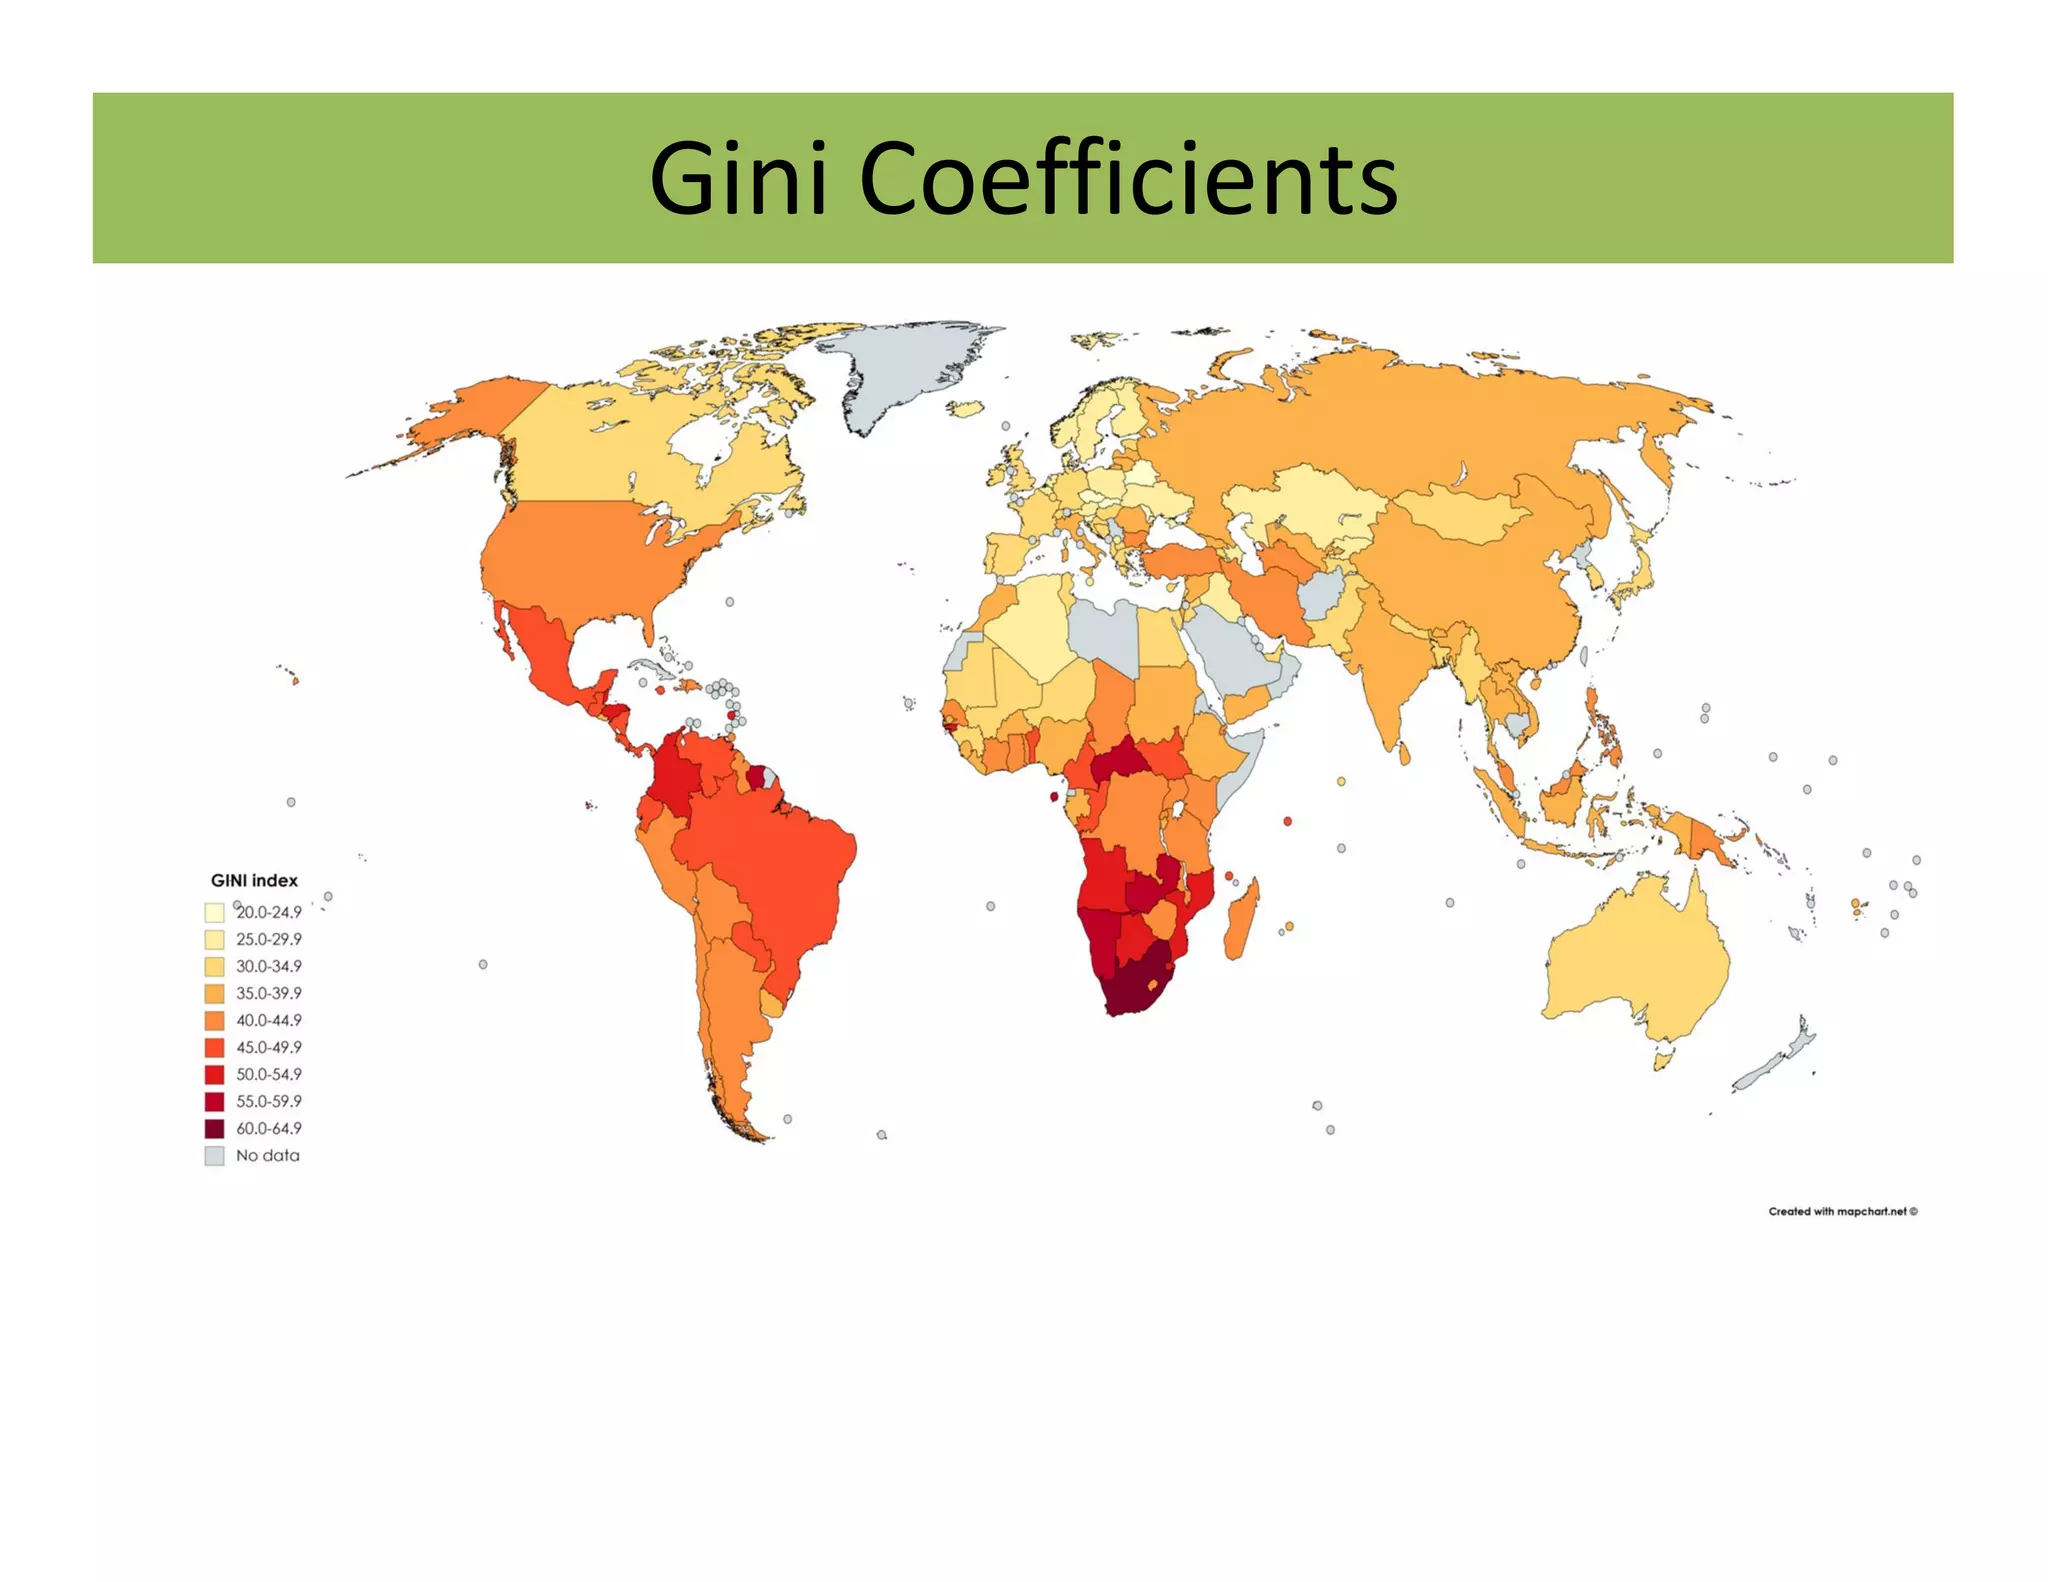
Regional & Metropolitan Planning
Dr. Mohammed Firoz . C
Architect and Urbanist
Department of Architecture and Planning
National Institute of Technology Calicut, India
Lecture 12
Measuring Regional Imbalances
Concept of GINI Coefficient
Gini Coefficients
What is Gini coefficient?
• Gini coefficient also called the Gini index or Gini ratio, is a measure
of statistical dispersion intended to represent the income
inequality or wealth Inequality within a nation /Region or any other
group of people.
• It can also be used to compare income or wealth over a period of
time
• It was developed by the Italian statistician and sociologist corrado
Gini and published in his 1912 paper Variability and Mutability
• The Gini coefficient is a single number aimed at measuring the degree
of inequality in a distribution.
• It is most often used in economics to measure how far a
country's/regions wealth or income distribution deviates from a
totally equal distribution.
Gini Coefficients
What is Gini coefficient?
• The Gini coefficient is usually defined mathematically based on
the Lorenz Curve which plots cumulative share of Income in % on
Y axis and % House hold by income distribution on X axis
• Its value varies anywhere from ‘zero’ to ‘One’, zero indicating
perfect equality and one indicating the perfect inequality.
• A Gini figure below 0.40 is generally considered to be within
tolerable limits by economic experts.
• Two popular ways to measure Gini Coefficient are those based on
pre-tax (or market) income and disposable income.
• Different scales like -Per capita household scale, OECD scale,
Square root scale etc. are used depending on the case. There exist
no consensus globally in the usage of scale
Gini Coefficients
Region/Country 1:
• Household A, Income =100000 Rs, Household B, Income =
20,000/-
• Average Income = (100000+20000) =60000/-
Region/Country 2:
• Household A, Income =65000 Rs, Household B, Income = 55000/Rs
-
• Average Income = (65000+55000) =60000/-Rs
Both Region has an average income of 60,000/- But here, simple
average do not measure any disparities between the households.
Hence Gini Coefficient measures the disparities more accurately and
is a better concept to assess inequality
Gini Coefficients
Lorenz Curve
• The line at 45 degrees represents
perfect equality of incomes.
• The Gini coefficient is the ratio of the
area that lies between the line of
equality and the Lorenz curve
(marked A in the diagram) over the total
area under the line of equality
(marked A and B in the diagram); i.e., G
= A/(A + B).
• The closer the Lorenz curve is to the
line of equality, the smaller area A is.
And the Gini coefficient will be low.
• If there is a high degree of inequality,
then area A will be a bigger percentage
of the total area.
• A rise in the Gini coefficient shows a rise in inequality – it shows the Lorenz
curve is further away from the line of equality.
Gini Coefficients
Interpretations :
• Curve 1 : 90% of the population holds 55% of the
total income. That means the richest 10% of
income earners gain 45% of total income.
• 20 % of population only Holds 5 % of Income
• Curve 2: 90% of the population holds 75% of the
total income. That means the richest 10% of
income earners gain only 25% of total income
• 20 % of population Holds 9 % of Income
• Line 3 : Line of perfect equality -
everyone had the same Income
distribution - An idealist case (
Line of 45 degree)
• 20% of the population would gain
20% of the total income.
• 60% of the population would get
60% of the income.
Gini Coefficients
Why is the coefficient significant?
• A general rise in Gini Coefficient indicates that government
policies are not inclusive and may be benefiting the rich as much
as (or even more than) the poor.
• It is important that rich-poor divide is kept in check to ensure that
a larger section of society reaps benefits from economic growth.
• A higher Gini Coefficient also could mean temptation for an
incumbent government to splurge more on welfare schemes and
tax the rich more ????? ( Idealistically…but do not happen
practically) .
• In India, the Gini Index has crossed 0.5 recently which is not a
good sign. The Gini has been increasing over a period of time
which is not good
Gini Coefficients
Critisism ….add
https://corporatefinanceinstitute.com/resources/knowledge/econ
omics/gini-coefficient/
https://blogs.adb.org/blog/take-gini-coefficients-grain-
salt#:~:text=Gini%20coefficients%20can%20understate%20inequality
&text=Other%20criticisms%20of%20the%20Gini,levels%20of%20pov
erty%20and%20prosperity.
http://hdr.undp.org/en/content/gini-coefficient-not-sufficient-
measure-inequality-what-difference-between-gini-and-atkinson
https://blogs.worldbank.org/developmenttalk/defense-gini-
coefficient
http://www.hsrc.ac.za/en/review/hsrc-review-november-
Gini Coefficients
Video explaining Concept of
GINI Coefficient and Lorenz
Curve
Imbalances- Indian Case study
Gini Coefficients
• Gini Coefficient in India
• A study in India shows very large
increases in inequality since
1990. Its net Gini index of
inequality (based on income net
of taxes and transfers) rose from
45.18 in 1990 to 51.36 in 2013.
• Only two countries in the Asia-
Pacific region—Papua New
Guinea and China—are more
unequal.
• The net Gini coefficient in India
is much higher than the average
-43.69 for Latin America
( expected as one of the most
unequal regions in the world)
Gini Coefficients
• According to Credit Suisse in their
2018 Global Wealth Report The
richest 10% of Indians own 77.4% of
the country’s wealth,. The bottom
60%, the majority of the population,
own 4.7%. The richest 1% own 51.5%
• Whose development are we talking
about? Is it development for the top
1%, or for the top 10%, or the poorest
60%?
• While wealth has been rising in India,
not everyone has shared in this
growth.
• 91% of the adult population has
wealth below $10,000. At the other
extreme, a small fraction of the
population (0.6% of adults) has a net
worth over $100,000.
Gini Coefficients
• Disposable income, also
known as disposable
personal income (DPI), is
the amount of money
that households have
available for spending
and saving after Income
tax have been accounted
for.
• Disposable personal
income is often
monitored as one of the
many key economic
indicators used to gauge
the overall state of the
economy
Gini Coefficients
Consumpt
ion and
Spending
Gini Coefficients
Urban
Rural
divide
Gini Coefficients
Urban
Rural
divide
Gini Coefficients
Educational
divide
Gini Coefficients
Educational
divide
Imbalances- Kerala –Other - An Ideal State ?
Gini Coefficients
NSSO 68TH
Round
Survey
Gini Coefficients
Gini Coefficients
Gini Coefficients
Gini Coefficients
Based on 2011-12 data, Kerala topped the list
with a Gini coefficient of 0.38. Karnataka 0.36,
e Tamil Nadu was fourth with 0.33. All three
were worse off than the national average of
0.32
Better percieved states, GINI Is worse
Gini Coefficients
Gini Coefficients
Gini Coefficients
Thanks You
Gini Coefficients
https://www.economicshelp.org/blog/glossary/lorenz-curve/.
http://www.ice360.in/events/india-s-richest-
20-account-for-45-of-income
https://www.livemint.com/Opinion/v9bWm59
FOXpedpKb7GhqCO/What-is-behind-high-
inequality-in-Kerala.html
https://theprint.in/economy/is-south-india-
really-richer-than-the-north-three-charts-that-
show-the-truth/103253/
https://www.youtube.com/watch?v=Quf4y499
sUY
ADD THESE ALSO IN NEXT SEMESTER
• https://economictimes.indiatimes.com/blogs/et-
commentary/heres-how-indias-widening-income-
distribution-can-be-redressed/
• https://www.thehindubusinessline.com/opinion/books/the
-many-hues-of-inequality-in-india/article28235613.ece
• https://www.thehindubusinessline.com/opinion/books/the
-many-hues-of-inequality-in-india/article28235613.ece
• https://www.customwritingservice.org/an-analysis-of-the-
causes-and-effects-of-income-inequality-in-india/
• https://www.livemint.com/Money/HJkSWsigdz6Xvkg8wpr6
jK/Where-are-you-in-Indias-wealth-distribution.html

L11PDF.pdf