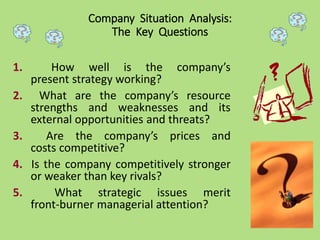
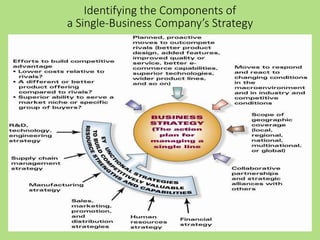
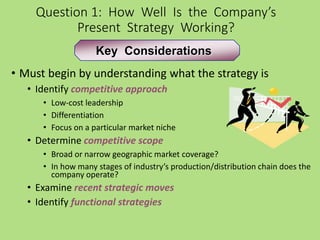
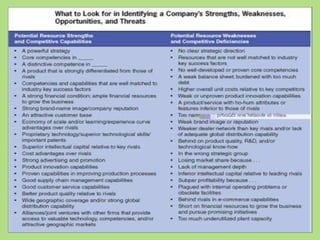
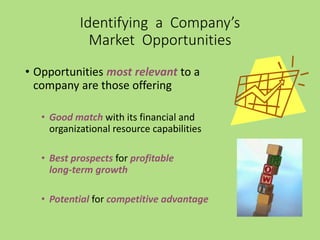
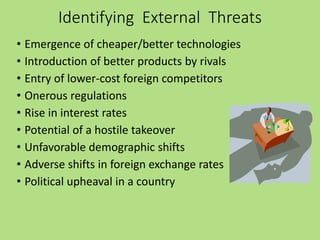
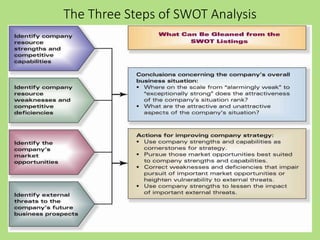
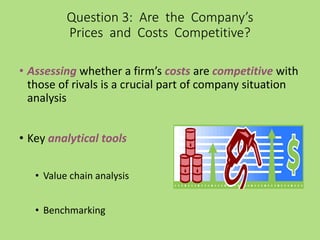
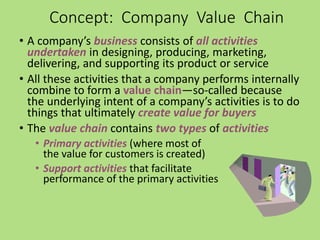
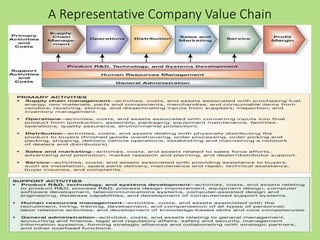
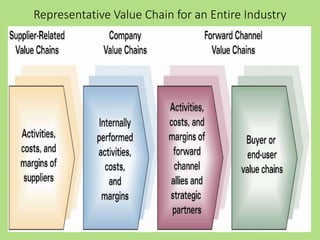
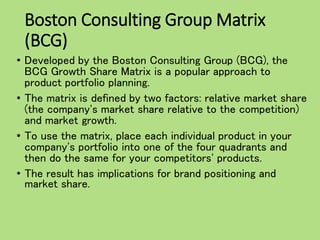
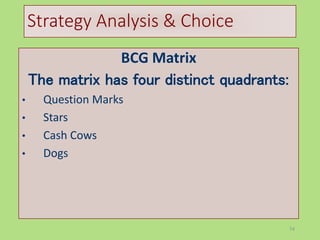
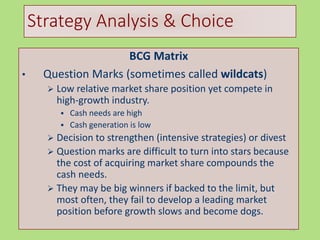
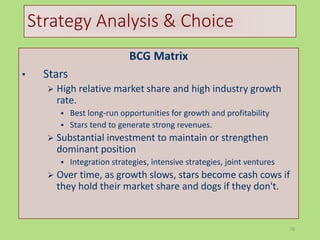
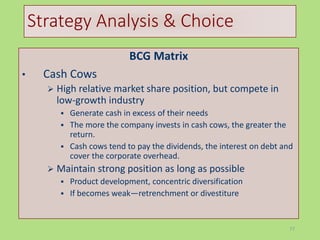
The document provides an overview of analyzing a company's internal environment and strategy. It discusses the key questions to ask, including how well the current strategy is working, the company's strengths/weaknesses/opportunities/threats (SWOT analysis), whether prices and costs are competitive, how the company compares to rivals, and what strategic issues need attention. It also covers tools like value chain analysis, benchmarking, and the BCG matrix to evaluate different aspects of the company's strategy and competitive positioning. The overall aim is to conduct a thorough internal analysis of the business to inform strategic decision making.
3. 1. How well is the company’s
present strategy working?
2. What are the company’s resource
strengths and weaknesses and its
external opportunities and threats?
3. Are the company’s prices and
costs competitive?
4. Is the company competitively stronger
or weaker than key rivals?
5. What strategic issues merit
front-burner managerial attention?
Company Situation Analysis:
The Key Questions
5. Question 1: How Well Is the Company’s
Present Strategy Working?
• Must begin by understanding what the strategy is
• Identify competitive approach
• Low-cost leadership
• Differentiation
• Focus on a particular market niche
• Determine competitive scope
• Broad or narrow geographic market coverage?
• In how many stages of industry’s production/distribution chain does the
company operate?
• Examine recent strategic moves
• Identify functional strategies
Key Considerations
6. • Qualitative assessment –
Is the strategy well-
conceived?
• Covers all the bases?
• Internally consistent?
• Makes sense?
• Timely and in step with
marketplace?
• Quantitative assessment
– What are the results?
• Is company achieving its
financial and strategic
objectives?
• Is company an above-
average industry
performer?
Approaches to Assess How Well
the Present Strategy Is Working
7. • Trend in sales and market share
• Acquiring and/or retaining customers
• Trend in profit margins
• Trend in net profits, ROI, and EVA
• Overall financial strength and credit ranking
• Efforts at continuous improvement
activities
• Trend in stock price and stockholder value
• Image and reputation with customers
• Leadership role(s) – Technology, quality,
innovation, e-commerce, etc.
Key Indicators of How Well
the Strategy Is Working
8.
9.
10. • S W O T represents the first letter in
• S trengths
• W eaknesses
• O pportunities
• T hreats
• For a company’s strategy to be well-conceived, it must
be
• Matched to its resource strengths and weaknesses
• Aimed at capturing its best market opportunities and erecting
defenses against external threats to its well-being
S W
O T
Question 2: What Are the Company’s Strengths,
Weaknesses, Opportunities and Threats ?
11. • A strength is something a firm does well or an
attribute that enhances its competitiveness
• Valuable skills, competencies, or capabilities
• Valuable physical assets
• Valuable human assets
• Valuable organizational assets
• Valuable intangible assets
• Important competitive capabilities
• An attribute placing a company in a position of market
advantage
• Alliances or cooperative ventures with partners
Resource strengths and competitive
capabilities are competitive assets!
Identifying Resource Strengths
and Competitive Capabilities
12. Competencies vs. Core Competencies vs.
Distinctive Competencies
• A competence is the product of organizational
learning and experience and represents real
proficiency in performing an internal activity
• A core competence is a well-performed
internal activity central (not peripheral or
incidental) to a company’s competitiveness
and profitability
• A distinctive competence is a competitively
valuable activity a company performs better than
its rivals
13. Identifying Resource Weaknesses
and Competitive Deficiencies
• A weakness is something a firm lacks, does poorly,
or a condition placing it at a disadvantage
• Resource weaknesses relate to
• Inferior or unproven skills,
expertise, or intellectual capital
• Lack of important physical,
organizational, or intangible assets
• Missing capabilities in key areas
Resource weaknesses and deficiencies
are competitive liabilities!
14.
15.
16. Identifying a Company’s
Market Opportunities
• Opportunities most relevant to a
company are those offering
• Good match with its financial and
organizational resource capabilities
• Best prospects for profitable
long-term growth
• Potential for competitive advantage
17. Identifying External Threats
• Emergence of cheaper/better technologies
• Introduction of better products by rivals
• Entry of lower-cost foreign competitors
• Onerous regulations
• Rise in interest rates
• Potential of a hostile takeover
• Unfavorable demographic shifts
• Adverse shifts in foreign exchange rates
• Political upheaval in a country
19. • Assessing whether a firm’s costs are competitive with
those of rivals is a crucial part of company situation
analysis
• Key analytical tools
• Value chain analysis
• Benchmarking
Question 3: Are the Company’s
Prices and Costs Competitive?
20. • A company’s business consists of all activities
undertaken in designing, producing, marketing,
delivering, and supporting its product or service
• All these activities that a company performs internally
combine to form a value chain—so-called because
the underlying intent of a company’s activities is to do
things that ultimately create value for buyers
• The value chain contains two types of activities
• Primary activities (where most of
the value for customers is created)
• Support activities that facilitate
performance of the primary activities
Concept: Company Value Chain
23. Developing Data to Measure a Company’s Cost
Competitiveness
• After identifying key value chain activities,
the next step involves determining costs
of performing specific value chain
activities using activity-based costing
• Appropriate degree of disaggregation
depends on
• Economics of activities
• Value of comparing narrowly defined
versus broadly defined activities
• Guideline – Develop separate cost
estimates for activities
• Having different economics
• Representing a significant or growing
proportion of costs
24. • Determining whether a company’s costs are in line
with those of rivals requires
• Measuring how a company’s costs compare with those
of rivals activity-by-activity
• Requires having accounting data to measure cost
of each value chain activity
• Activity-based costing entails
• Defining expense categories according
to specific activities performed and
• Assigning costs to the activity
responsible for creating the cost
Activity-Based Costing: A Key
Tool in Analyzing Costs
25.
26. • Focuses on cross-company comparisons of how
certain activities are performed and costs associated
with these activities
• Purchase of materials
• Payment of suppliers
• Management of inventories
• Getting new products to market
• Performance of quality control
• Filling and shipping of customer orders
• Training of employees
• Processing of payrolls
Benchmarking Costs of
Key Value Chain Activities
28. • Overall competitive position involves
answering two questions
• How does a company rank relative
to competitors on each important
factor that determines market success?
• Does a company have a net
competitive advantage or disadvantage
vis-à-vis major competitors?
Question 4: Is the Company Stronger
or Weaker than Key Rivals?
29. 1. List industry key success factors and other relevant
measures of competitive strength
2. Rate firm and key rivals on each factor using rating
scale of 1 to 10 (1 = very weak; 5 = average; 10 = very
strong)
3. Decide whether to use a weighted or unweighted
rating system (a weighted system is superior because
chosen strength measures are unlikely to be equally
important)
4. Sum individual ratings to get an overall measure of
competitive strength for each rival
5. Based on overall strength ratings, determine overall
competitive position of firm
Assessing a Company’s
Competitive Strength vs. Key Rivals
30.
31.
32. • Based on results of both industry and competitive
analysis and an evaluation of a company’s
competitiveness, what items should be
on a company’s “worry list”?
• Requires thinking strategically about
• Pluses and minuses in the industry
and competitive situation
• Company’s resource strengths and weaknesses and
attractiveness of its competitive position
A “good” strategy must address “what to do”
about each and every strategic issue!
Question 5: What Strategic Issues
Merit Managerial Attention?
34. What is a SWOT analysis and why
should you use one?
A SWOT analysis guides you to identify the positives
and negatives inside your organization (Strength &
Weakness) and outside of it, in the external
environment (Opportunity & Threat). Developing a full
awareness of your situation can help with both
strategic planning and decision -making.
35. When do you use SWOT?
You might use it to:
• Explore possibilities to problems.
• Make decisions for your initiative.
• Determine where change is possible.
• Adjust and refine plans mid-course.
37. A SWOT analysis focuses on Strengths, Weaknesses,
Opportunities, and Threats.
Ask participants to answer these simple questions: what are the
strengths and weaknesses of your group, community, or effort,
and what are the opportunities and threats facing it?
38. If a looser structure helps you brainstorm, you can group
positives and negatives to think broadly about your
organization and its external environment.
39. Below is a third option for structuring your SWOT analysis,
which may be appropriate for a larger initiative that requires
detailed planning. This "TOWS Matrix" is adapted from Fred
David's Strategic Management text.
40. David gives an example for Campbell Soup Company that
stresses financial goals, but it also illustrates how you can pair
the items within a SWOT grid to develop strategies. (This
version of the chart is abbreviated.)
41. Listing Your Internal Factors:
Strengths and Weaknesses (S, W)
General areas to consider
• Human resources - staff, volunteers, board members,
target population
• Physical resources - your location, building, equipment
• Financial - grants, funding agencies, other sources of
income
• Activities and processes - programs you run, systems you
employ
• Past experiences - building blocks for learning and
success, your reputation in the community
42. Listing External Factors:
Opportunities and Threats (O, T)
Forces and facts that your group does not control include
• Future trends in your field or the culture
• The economy - local, national, or international
• Funding sources - foundations, donors, legislatures
• Demographics - changes in the age, race, gender, culture
of those you serve or in your area
• The physical environment (Is your building in a growing
part of town? Is the bus company cutting routes?)
• Legislation (Do new federal requirements make your job
harder...or easier?)
• Local, national or international events
43. How do you create a SWOT analysis?
• Who develops the SWOT?
• When and where do you develop a SWOT analysis?
• How do you develop a SWOT analysis?
44. Steps for conducting a SWOT analysis:
• Designate a leader or group facilitator.
• Designate a recorder to back up the leader if your group is large.
• Introduce the SWOT method and its purpose in your organization.
• Let all participants introduce themselves.
• Have each group designate a recorder; direct them to create a SWOT
analysis.
• Reconvene the group at the agreed-upon time to share results.
• Discuss and record the results.
• Prepare a written summary of the SWOT analysis to give to participants.
45. How do you use your SWOT
analysis?
Use it to:
• Identify the issues or problems you intend to
change.
• Set or reaffirm goals.
• Create an action plan.
47. WhatistheIFE Matrix?
• Internal Factor Evaluation Matrix
• A summary step in conducting internal
strategic management audit.
• Summarizes and evaluates the major
strengths and weaknesses in the
functional areas of a business.
48. Components
• Internal Factors – list of all strengths and
weaknesses
• Weights – Scale of 0 to 1
• Rating – Scale of 1 to 4
– Strengths – 4-major strength; 3- minor
strength
– Weaknesses – 1-major weakness; 2-minor
weakness
• Total Weighted Score
49. ConstructionofIFE Matrix
• Make a table. In the first column, list
down all the strengths and weaknesses.
• In the second column, assign weights to
each factor ranging from 0.0 (not
important) to 1 (most important).
• The sum of all weights must be equal to
1.
50. ConstructionofIFE Matrix
• In the third column, rate each factor
ranging from 1 to 4 (where: 1 = major
weakness, 2 = minor weakness, 3 = minor
strength, 4 = major strength.)
51. ConstructionofIFE Matrix
• In the fourth column, calculate weighted
score by multiplying each factor’s score
by its rating.
• Find the total weighted score by adding
the weighted scores for each variable.
54. WhatisRBV?
• The resource-based view focuses on
internal resources, the firm's strengths
positional or environmental models
and weaknesses, in contrast to the
of
competitive advantage which focuses on
opportunities and threats. (Barney, 1991)
56. Rents
A surplus of revenue over cost.
Strategic Assets/Core Competencies
Resources and capabilities that can earn
rents.
57. Typesof Resources
Tangible Resources – include all plant and
equipment, location, technology, raw
materials and machines
Intangible
employees,
Resources - include all
training, experience,
intelligence, knowledge, skills, abilities
Organizational Resources - include firm
structure, planning processes, information
systems, trademarks, copyrights, databases.
58. Resources and capabilities lead to Competitive
Advantage when they are:
Valuable allow the firm to exploit
opportunities or neutralize
threats in its external
environment.
Rare possessed by few, if any,
current and potential
competitors
59. Costly to imitate when other firms
either cannot
obtain them at a
much higher
cost
Non-substitutable the firm must be
organized
appropriately to
obtain the full
benefits of the
resources in
order to realize a competitive
advantage
62. 62
Strategy Analysis & Choice
“Strategic management is not a box of tricks or a
bundle of techniques. It is analytical thinking and
commitment of resources to action. But
quantification alone is not planning. Some of the
most important issues in strategic management
cannot be quantified at all.”
—Peter Drucker—
63. 63
Strategy Analysis & Choice
“Whether it’s broke or not, fix it—make it better. Not
just products, but the whole company if necessary.”
—Bill Saporito—
64. 64
Strategy Analysis & Choice
“Planning is often doomed before it ever starts, either
because too much is expected of it or because not
enough is put into it.”
—T. J. Cartwright—
65. 65
Strategy Analysis & Choice
Strategic Analysis and Choice:
Making subjective decisions based on objective
information
66. 66
Strategy Analysis & Choice
Strategic Analysis and Choice:
• Generate feasible alternatives
• Evaluate alternatives
• Select specific course of action
67. 67
Strategy Analysis & Choice
Generating & Selecting Strategies
Develop set of most attractive alternative
strategies
Determine for the set
• Advantages
• Disadvantages
• Trade-offs
• Costs
• Benefits
68. 68
Strategy Analysis & Choice
Generating & Selecting Strategies
Involve a broad mix of personnel
• Representation from each department/function
• Provides opportunity to gain understanding of firm’s direction
• Provides vehicle to develop commitment to attainment of
organizational objectives
69. Boston Consulting Group Matrix
(BCG)
• Developed by the Boston Consulting Group (BCG), the
BCG Growth Share Matrix is a popular approach to
product portfolio planning.
• The matrix is defined by two factors: relative market share
(the company's market share relative to the competition)
and market growth.
• To use the matrix, place each individual product in your
company's portfolio into one of the four quadrants and
then do the same for your competitors' products.
• The result has implications for brand positioning and
market share.
70. 70
Strategy Analysis & Choice
Boston Consulting Group Matrix
(BCG)
• Enhances multidivisional firms’ efforts to
formulate strategies
• Autonomous divisions (or profit centers)
constitute the business portfolio
• Firm’s divisions may compete in different
industries requiring separate strategy
71. 71
Strategy Analysis & Choice
Boston Consulting Group Matrix
(BCG)
• Graphically portrays differences among divisions
• Focuses on market share position and industry
growth rate
• Manage business portfolio through relative
market share position and industry growth rate
72. 72
Strategy Analysis & Choice
Boston Consulting Group Matrix
(BCG)
• Relative market share position defined:
Ratio of a division’s own market share in a particular
industry to the market share held by the largest rival
firm in that industry.
74. 74
Strategy Analysis & Choice
BCG Matrix
The matrix has four distinct quadrants:
• Question Marks
• Stars
• Cash Cows
• Dogs
75. 75
Strategy Analysis & Choice
BCG Matrix
• Question Marks (sometimes called wildcats)
Low relative market share position yet compete in
high-growth industry.
Cash needs are high
Cash generation is low
Decision to strengthen (intensive strategies) or divest
Question marks are difficult to turn into stars because
the cost of acquiring market share compounds the
cash needs.
They may be big winners if backed to the limit, but
most often, they fail to develop a leading market
position before growth slows and become dogs.
76. 76
Strategy Analysis & Choice
BCG Matrix
• Stars
High relative market share and high industry growth
rate.
Best long-run opportunities for growth and profitability
Stars tend to generate strong revenues.
Substantial investment to maintain or strengthen
dominant position
Integration strategies, intensive strategies, joint ventures
Over time, as growth slows, stars become cash cows if
they hold their market share and dogs if they don't.
77. 77
Strategy Analysis & Choice
BCG Matrix
• Cash Cows
High relative market share position, but compete in
low-growth industry
Generate cash in excess of their needs
The more the company invests in cash cows, the greater the
return.
Cash cows tend to pay the dividends, the interest on debt and
cover the corporate overhead.
Maintain strong position as long as possible
Product development, concentric diversification
If becomes weak—retrenchment or divestiture
78. 78
Strategy Analysis & Choice
BCG Matrix
• Dogs
Low relative market share position and compete in
slow or no market growth
Weak internal and external position
Dogs often report a profit even though they are net cash
users.
They are essentially cash traps.
Decision to liquidate, divest, retrenchment
79. 79
Strategy Analysis & Choice
BCG Matrix
• The purpose of this tool is to help you balance your product
portfolio.
• Ideally, you would eliminate any dogs, while keeping the others
in a kind of dynamic equilibrium.
• The cash generated by cash cows can then be used to turn
question marks into stars, which, in turn, may become cash
cows.
• As noted above, many of the question marks will become dogs,
which means you'll need to compensate for these failures by
improving margins on the stars and cash cows.
• One of the underlying assumptions of this model is that higher
rates of profit are directly related to high market share. This
isn't always the case.
80.
81. GE Nine Cell Planning Grid
• General Electric developed with the help of the
consulting firm McKinsey and Company, an
adaptation of the BCG approach that attempts to
overcome some of the matrix limitations.
• The GE grid uses multiple factors to assess industry
attractiveness and business strength.
82. GE Nine Cell Planning Grid
• The GE/McKinsey Matrix improves on the BCG
approach in two ways:
1) it utilizes more comprehensive axes (the BCG
matrix uses market growth rate as a proxy for
industry attractiveness and relative market share
as a proxy for the strength of the business unit);
and
2) it consists of nine-cells rather than four,
allowing for greater precision.
83. Industry Attractiveness Factors
• Market size and projected growth
• Intensity of competition
• Emerging opportunities and threats
• Seasonal and cyclical factors
• Resource requirements
• Cross-industry strategic fits and
resource fits with present businesses
• Industry profitability
• Social, political, regulatory, and environmental
factors
• Degree of risk and uncertainty
84. Procedure: Rating the Relative
Attractiveness of Each Industry
Step 1: Select industry attractiveness factors
Step 2: Assign weights to each factor
(sum of weights = 1.0)
Step 3: Rate each industry on each
factor (use scale of 1 to 10)
Step 4: Calculate weighted ratings; sum to get an
overall industry attractiveness rating for each
industry
85. Example: Rating Industry
Attractiveness
Rating Scale: 1 = Very unattractive; 5 = Average; 10 = Very attractive
4
2
5
0.20
0.20
0.50
5.80
0.05
0.10
0.10
1.00
5
7
6
0.75
1.05
0.60
0.15
0.15
0.10
Attractiveness
Rating
5
8
Weighted
Industry Rating
0.50
2.00
Weight
0.10
0.25
Industry Attractiveness Factor
Market size and projected growth
Intensity of competition
Strategic fits and resource fits with
other industries in portfolio
Resource requirements
Emerging industry opportunities and
threats
Seasonal and cyclical influences
Social, political, regulatory, and
environmental factors
Industry uncertainty and business
risk
Sum of weights
Industry attractiveness rating
86. Attractiveness of Mix of
Industries as a Whole
• How appealing is the whole group of industries
in which the company is invested?
• Is the company in too many relatively unattractive
industries?
• Does the portfolio of industries hold promise for
attractive growth and profitability?
• Should some form of portfolio restructuring
be considered?
87. Evaluate Each Business
Unit’s Competitive Strength
•Objectives
• Determine how well each business is
positioned in its industry relative to rivals
• Evaluate whether it is or can be
competitively strong enough to contend
for
market leadership
88. Factors to Use in
Evaluating Competitive Strength
• Relative market share
• Costs relative to competitors
• Ability to match/beat rivals on key product attributes
• Ability to exercise bargaining leverage with key suppliers or
customers
• Caliber of alliances and collaborative partnerships
• Ability to benefit from strategic fits with sister businesses
• Technology and innovation capabilities
• How well business’s competencies match industry KSFs
• Brand name recognition and reputation
• Profitability relative to competitors
89. Procedure: Rating the Competitive
Strength of Each Business
Step 1: Select competitive strength factors
Step 2: Assign weights to each factor
(sum of weights = 1.0)
Step 3: Rate each business on each
factor (use scale of 1 to 10)
Step 4: Calculate weighted ratings; sum to get an
overall strength rating for each business
90. Example: Rating a Business Unit’s
Competitive Strength
4
7
5
0.40
0.70
0.50
6.30
0.10
0.10
0.10
1.00
7
6
7
0.70
0.60
1.05
0.10
0.10
0.15
Strength
Rating
5
8
Weighted
Strength Rating
0.75
1.60
Weight
0.15
0.20
Competitive Strength Measure
Relative market share
Costs relative to competitors
Ability to match rivals on key
product attributes
Bargaining leverage
Strategic fit relationships
Technology and innovation
capabilities
How well resources match KSFs
Degree of profit relative to rivals
Sum of weights
Competitive strength rating
Rating Scale: 1 = Very weak ; 5 = Average; 10 = Very strong
91. Using a Matrix to Display Industry
Attractiveness and Competitive Strength
• Use quantitative measures of industry
attractiveness and business strength to plot
location of each business in matrix
• Each business unit appears as a circle
• Area of circle is proportional to size of business as a
percent of company revenues
• Or area of circle can represent relative size of
industry with pie slice showing the company’s
market share
93. Strategy Implications of
Attractiveness/Strength Matrix
• Businesses in upper left corner
• Accorded top investment priority
• Strategic prescription - grow and build
• Businesses in three diagonal cells
• Given medium investment priority
• Invest to maintain position
• Businesses in lower right corner
• Candidates for harvesting or divestiture
• May, on occasion, be candidates for an overhaul and
reposition strategy
94. Appeal of the
Attractiveness/Strength Matrix
• Incorporates a wide variety of strategically relevant
variables
• Stresses concentrating corporate resources in
businesses that enjoy
• High degree of industry attractiveness and
• High degree of competitive
strength
• The lesson here is emphasize
businesses that are market
leaders or that can contend
for market leadership
95. GE Nine Cell Planning Grid
• The sample diagram shows the relative position of
an SBU with a market share of 65%. The arrow in
the upward right position indicates that the SBU
is expected to lose strength relative to
competitors, and the that the business unit is in
an industry that is projected to become
increasingly less attractive. The tip of the arrow
indicates the future position of the center point of
the circle.
• Both axes are divided into three segments,
yielding nine cells. The nine cells are grouped into
three zones:
96. GE Nine Cell Planning Grid
• The Green Zone
• The Green Zone consists of the three cells in the
upper left corner. If the SBU falls in this zone, it’s in
a favorable position with relatively attractive
growth opportunities. This position indicates a
"green light" to invest and grow this SBU.
97. GE Nine Cell Planning Grid
• The Yellow Zone
• The Yellow Zone consists of the three diagonal cells
from the lower left to the upper right. A position in
the yellow zone is viewed as having medium
attractiveness. Management must therefore
exercise caution when making additional
investments in this SBU. The suggested strategy is
to protect or allocate resources on a selective basis
rather than growing or reducing share.
98. GE Nine Cell Planning Grid
• The Red Zone
• The Red Zone consists of the three cells in the
lower right corner. A harvest strategy should be
used in the two cells just below the three-cell
diagonal. These SBUs shouldn’t receive substantial
new resources. The SBUs in the lower right cell
shouldn’t receive any resources and should
probably be divested or eliminated from a firm’s
portfolio.
99. GE Nine Cell Planning Grid
• There are strategy variations within these three groups. For example,
within the Red Zone, a firm would be inclined to quickly divest itself of
a weak business in an unattractive industry, whereas it might perform
a phased harvest of an average SBU in the same industry.
• While the GE/McKinsey Matrix represents an improvement over the
relatively simplistic BCG Growth-Share Matrix, it still encompasses a
limited view of the competitive landscape.
• The matrix doesn’t take into account interactions among SBUs or the
core competencies that lead to value creation.
• For these and other reasons, some believe the matrix is better suited
for providing an overview of the current market rather than serving as
a resource allocation tool.
102. 102
Matching Key Factors
Resultant StrategyKey External FactorKey Internal Factor
Develop a new
employee benefits
package
=Strong union
activity (threat)
+
Poor employee morale
(weakness)
Develop new products
for older adults
=
Decreasing numbers
of young adults
(threat)
+Strong R&D (strength)
Pursue horizontal
integration by buying
competitor's facilities
=
Exit of two major
foreign competitors
form the industry
(opportunity)
+
Insufficient capacity
(weakness)
Acquire Visioncable, Inc.=
20% annual growth
in the cablevision
industry
(opportunity)
+
Excess working
capacity (strength)
103. 103
Four Types of Strategies
WT
Strategies
ST
Strategies
WO
Strategies
SO
Strategies
Threats
Opportunities
Weaknesses
Strengths
(TOWS)
104. TOWS Matrix
• The nine-cell TOWS matrix is a more flexible
version of the traditional four-cell matrix.
• The main advantage of this version is that, in
addition to identifying major strengths,
weaknesses, opportunities and threats, it
incorporates potential strategies for improving the
company's competitive position.
105. TOWS Matrix
• There are four steps to developing this
matrix:
1. Complete the S-W-O-T boxes as you
would in a traditional SWOT exercise,
prioritizing your entries after you've
generated an exhaustive list.
106. TOWS Matrix
o Strengths: List company-specific internal strengths
that bolster the company's competitive position.
o Weaknesses: List company-specific internal
weaknesses that hurt the company's competitive
position.
o Opportunities: List external opportunities available
to the company and/or its competitors.
o Threats: List external threats the company and/or
its competitors must face.
107. TOWS Matrix
3. Explain the potential strategies developed in the
previous step in terms of three response options:
prospect, defend or harvest. This requires you 1)
determine the relative magnitude of your various
SWOT entries and 2) develop logically feasible
matches between internal and external factors.
4. Recommend the best strategies to company
decision makers.
108. 108
TOWS Matrix
WT Strategies
Minimize weaknesses
and avoid threats
ST Strategies
Use strengths to avoid
threats
Threats-T
List Threats
WO Strategies
Overcome weaknesses
by taking advantage of
opportunities
SO Strategies
Use strengths to take
advantage of
opportunities
Opportunities-O
List Opportunities
Weaknesses-W
List Weaknesses
Strengths-S
List Strengths
Leave Blank
109. 109
TOWS Matrix
Response Option Potential Actions
Prospect o Develop new distinguishing competency
o Initiate R&D in new technology
o Learn new manufacturing process
o Learn how to design and promote new product
Defend o Preserve existing distinguishing competency
o Reduce price of existing product
o Increase price of existing product
o Intensify R&D in existing technology
Harvest o Gradually dissolve the business
o Increase promotion of existing product
o Reduce expenditures for existing product
110. 110
Strategy Analysis & Choice
Grand Strategy Matrix
• Popular tool for formulating alternative strategies
• Based on two evaluative dimensions
Competitive position
Market growth
111. 111
Grand Strategy Matrix
Quadrant IV
• Concentric diversification
• Horizontal diversification
• Conglomerate
diversification
• Joint ventures
Quadrant III
• Retrenchment
• Concentric diversification
• Horizontal diversification
• Conglomerate
diversification
• Liquidation
Quadrant I
• Market development
• Market penetration
• Product development
• Forward integration
• Backward integration
• Horizontal integration
• Concentric diversification
Quadrant II
• Market development
• Market penetration
• Product development
• Horizontal integration
• Divestiture
• Liquidation
RAPID MARKET GROWTH
SLOW MARKET GROWTH
WEAK
COMPETITIVE
POSITION
STRONG
COMPETITIVE
POSITION
112. 112
Strategy Analysis & Choice
Grand Strategy Matrix
• Quadrant I
Excellent strategic position
Concentration on current markets and products
Take risks aggressively when necessary
113. 113
Strategy Analysis & Choice
Grand Strategy Matrix
• Quadrant II
Evaluate present approach seriously
How to change to improve competitiveness
Rapid market growth requires intensive strategy
114. 114
Strategy Analysis & Choice
Grand Strategy Matrix
• Quadrant III
Compete in slow-growth industries
Weak competitive position
Drastic changes quickly
Cost and asset reduction indicated (retrenchment)
115. 115
Strategy Analysis & Choice
Grand Strategy Matrix
• Quadrant IV
Strong competitive position
Slow-growth industry
Diversification indicated to more promising growth
areas