The document provides a comprehensive overview of establishing and utilizing Prometheus-based monitoring for Kubernetes environments, detailing metrics collection, service discovery, and alerting configurations. It covers the architecture of Prometheus, types of metrics (gauges, counters, histograms), and introduces various Kubernetes components and their respective metrics. Additionally, it discusses the integration of auto-scaling through Kubernetes' Horizontal Pod Autoscaler using Prometheus metrics and the role of Istio in the monitoring setup.
본 세션에서는...
• Introductionto Prometheus
ü Prometheus overview
ü How to monitoring with k8s
• k8s 주요 Metric 소개
ü Node metric
ü Pod/Container metric
ü Kubernetes metric
• 활용기
ü HPA(Horizon Pod Autoscaler)
ü Istio + Prometheus
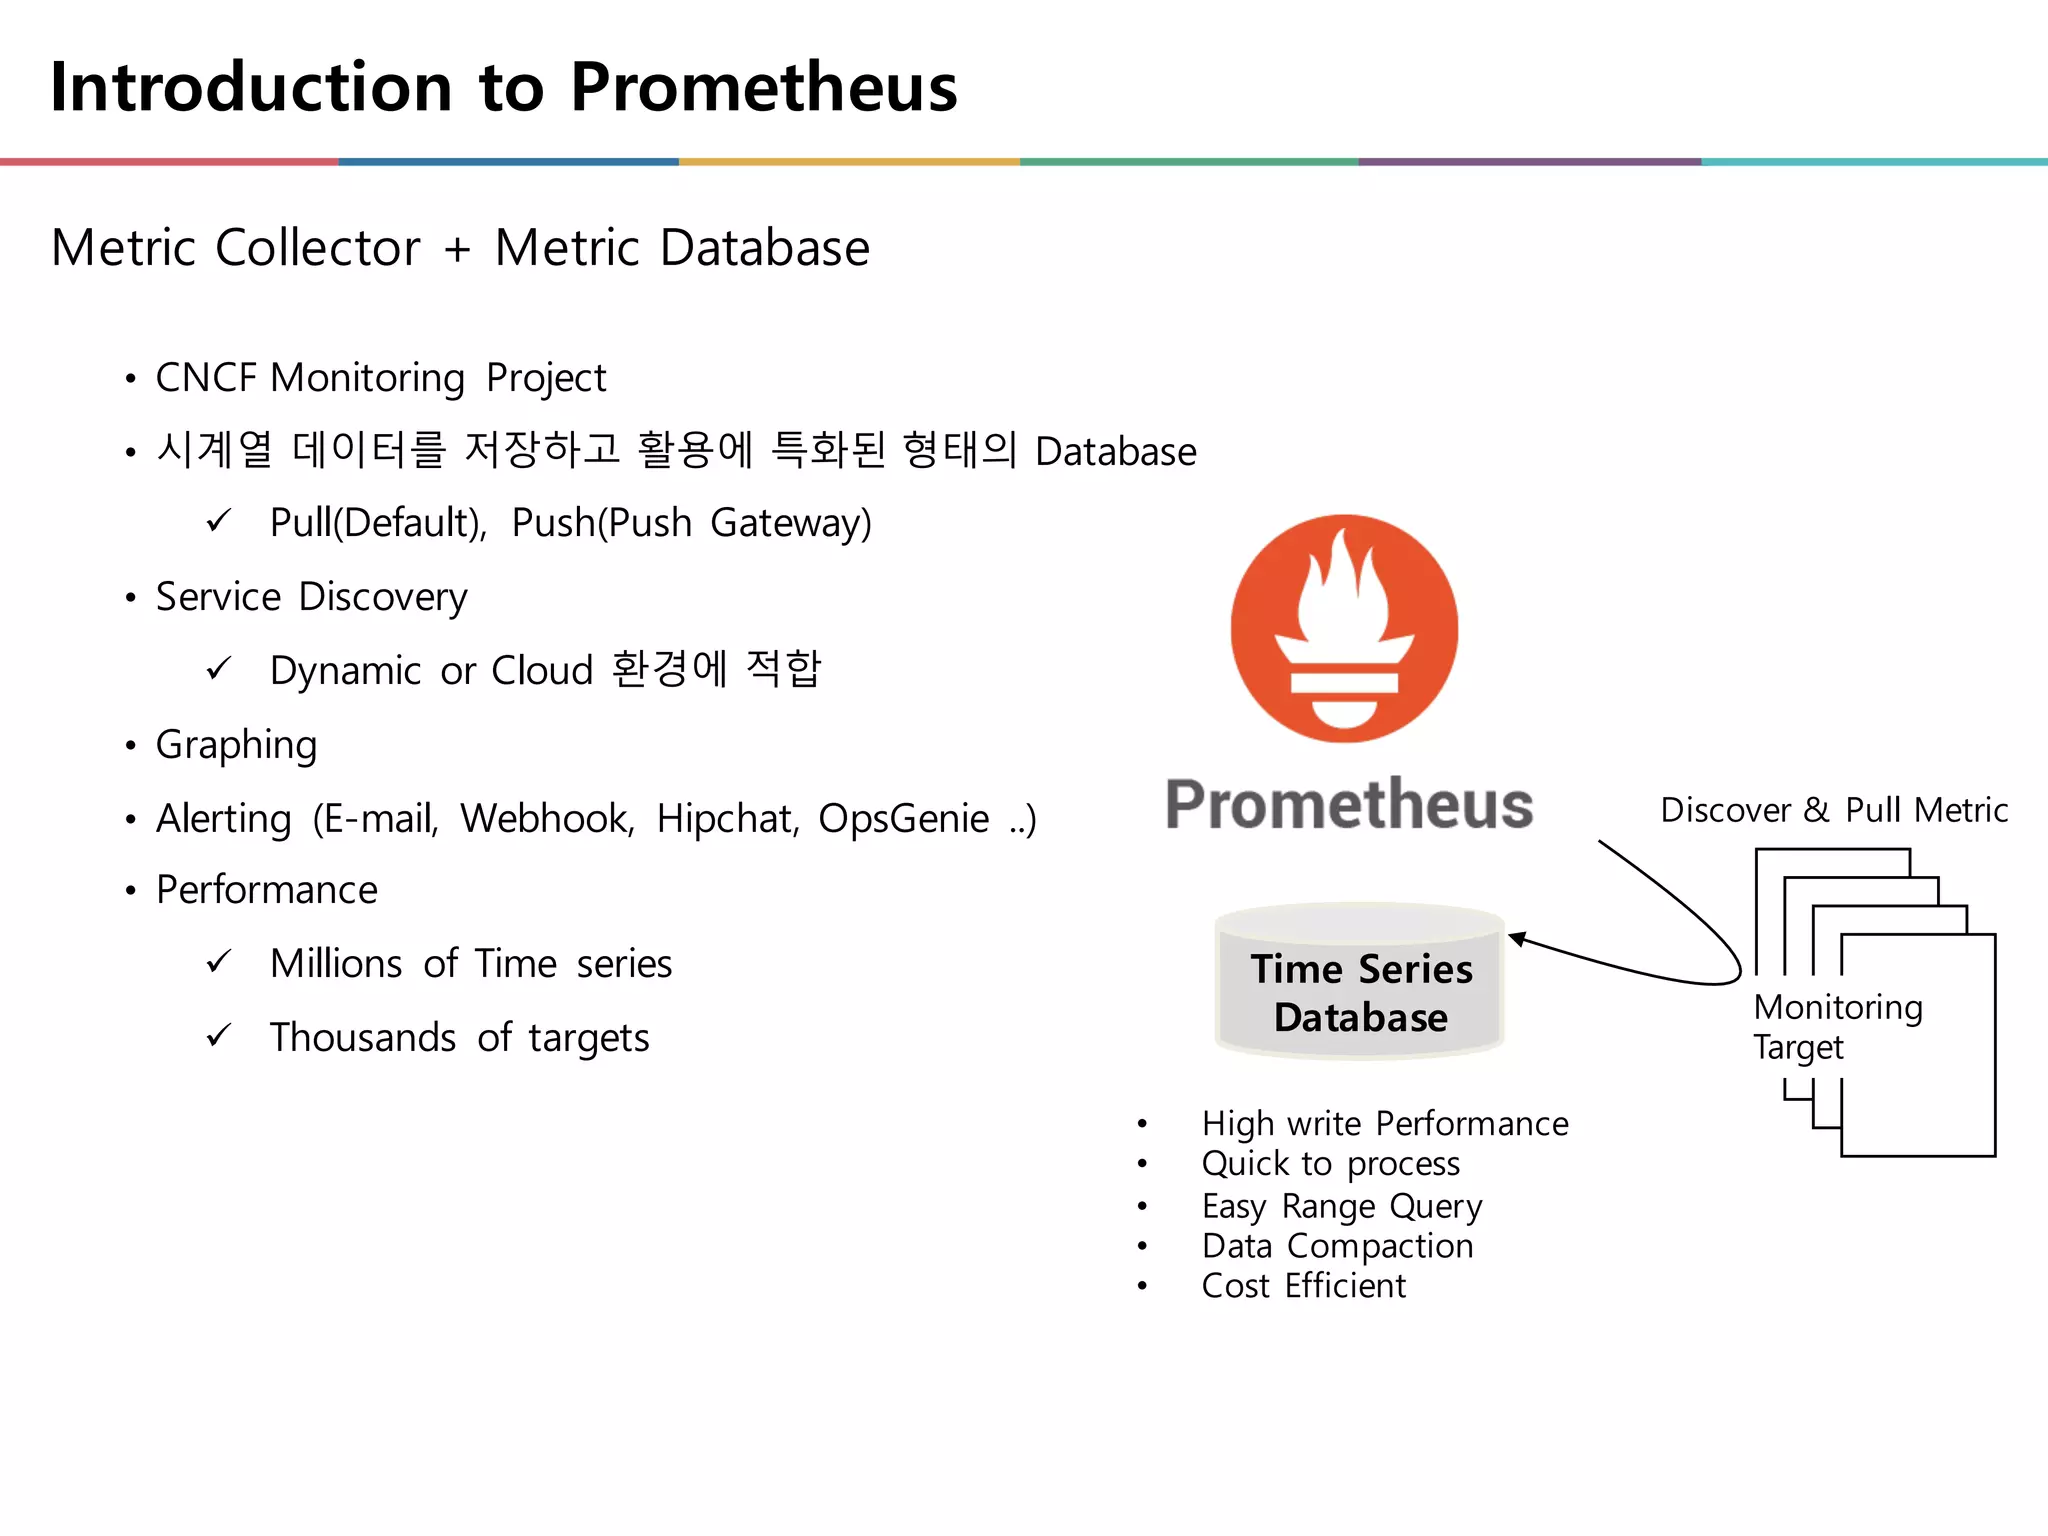
• CNCF MonitoringProject
• 시계열 데이터를 저장하고 활용에 특화된 형태의 Database
ü Pull(Default), Push(Push Gateway)
• Service Discovery
ü Dynamic or Cloud 환경에 적합
• Graphing
• Alerting (E-mail, Webhook, Hipchat, OpsGenie ..)
• Performance
ü Millions of Time series
ü Thousands of targets
Introduction to Prometheus
Time Series
Database
• High write Performance
• Quick to process
• Easy Range Query
• Data Compaction
• Cost Efficient
Metric Collector + Metric Database
Monitoring
Target
Discover & Pull Metric
5.
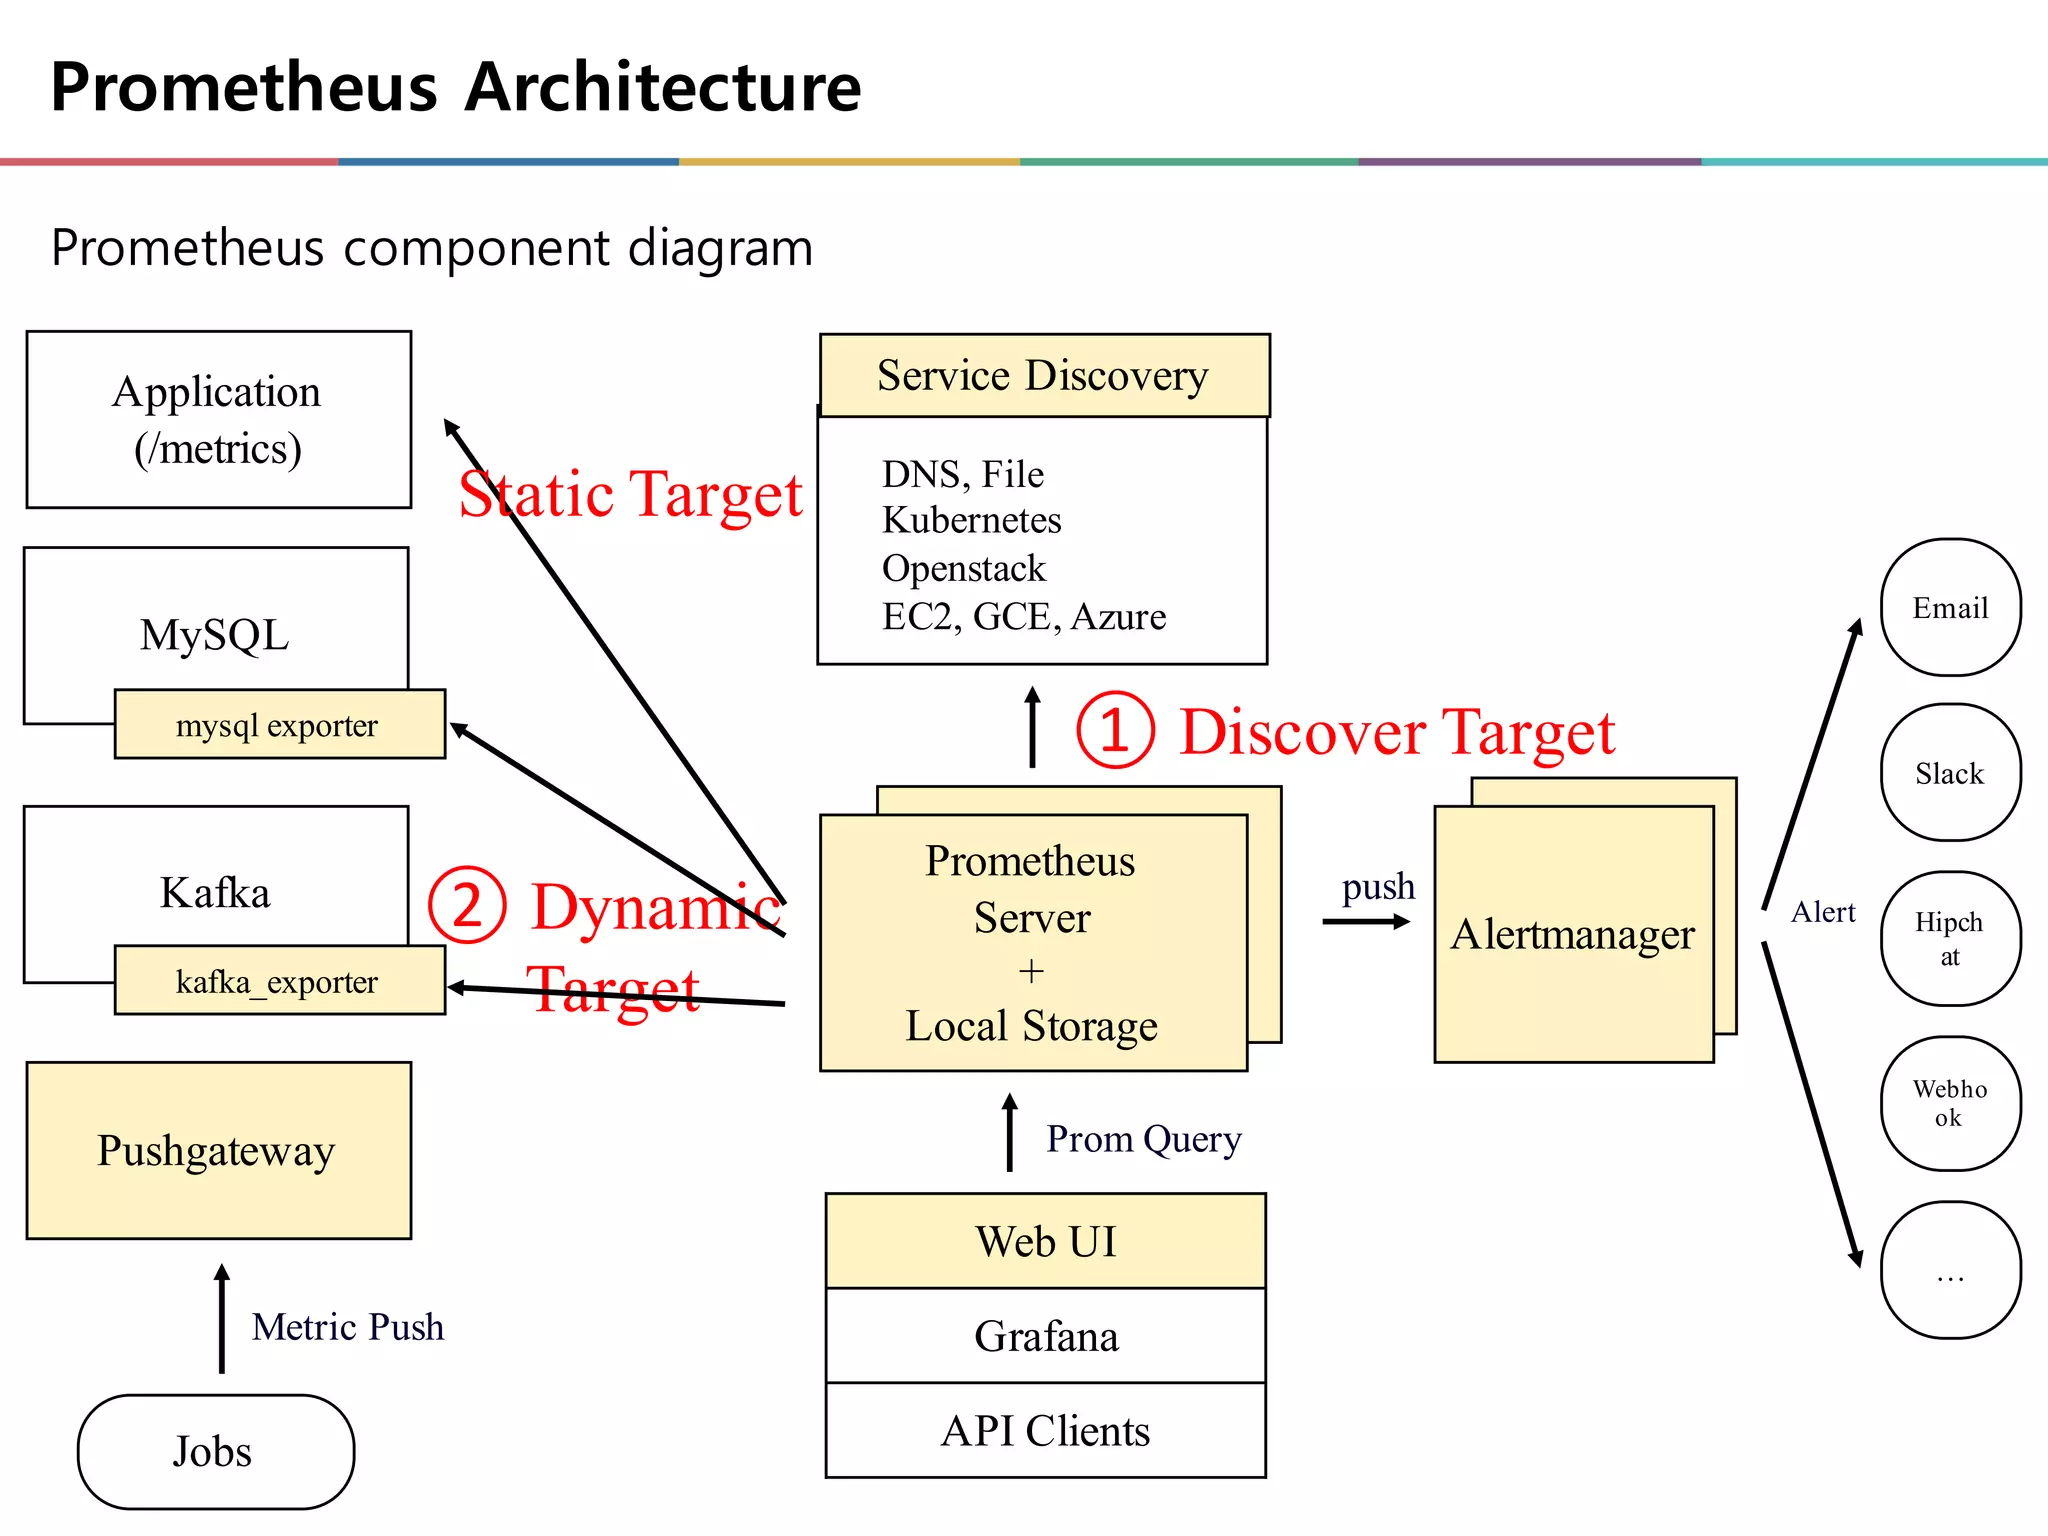
Prometheus component diagram
Prometheus
Server
+
LocalStorage
Email
Slack
…
Alertmanager Hipch
at
Webho
ok
push
Alert
Service Discovery
DNS, File
Kubernetes
Openstack
EC2, GCE, Azure
② Dynamic
Target
① Discover Target
Application
(/metrics)
MySQL
Kafka
Pushgateway
Jobs
mysql exporter
kafka_exporter
Metric Push
Web UI
Grafana
API Clients
Prom Query
Static Target
Prometheus Architecture
6.
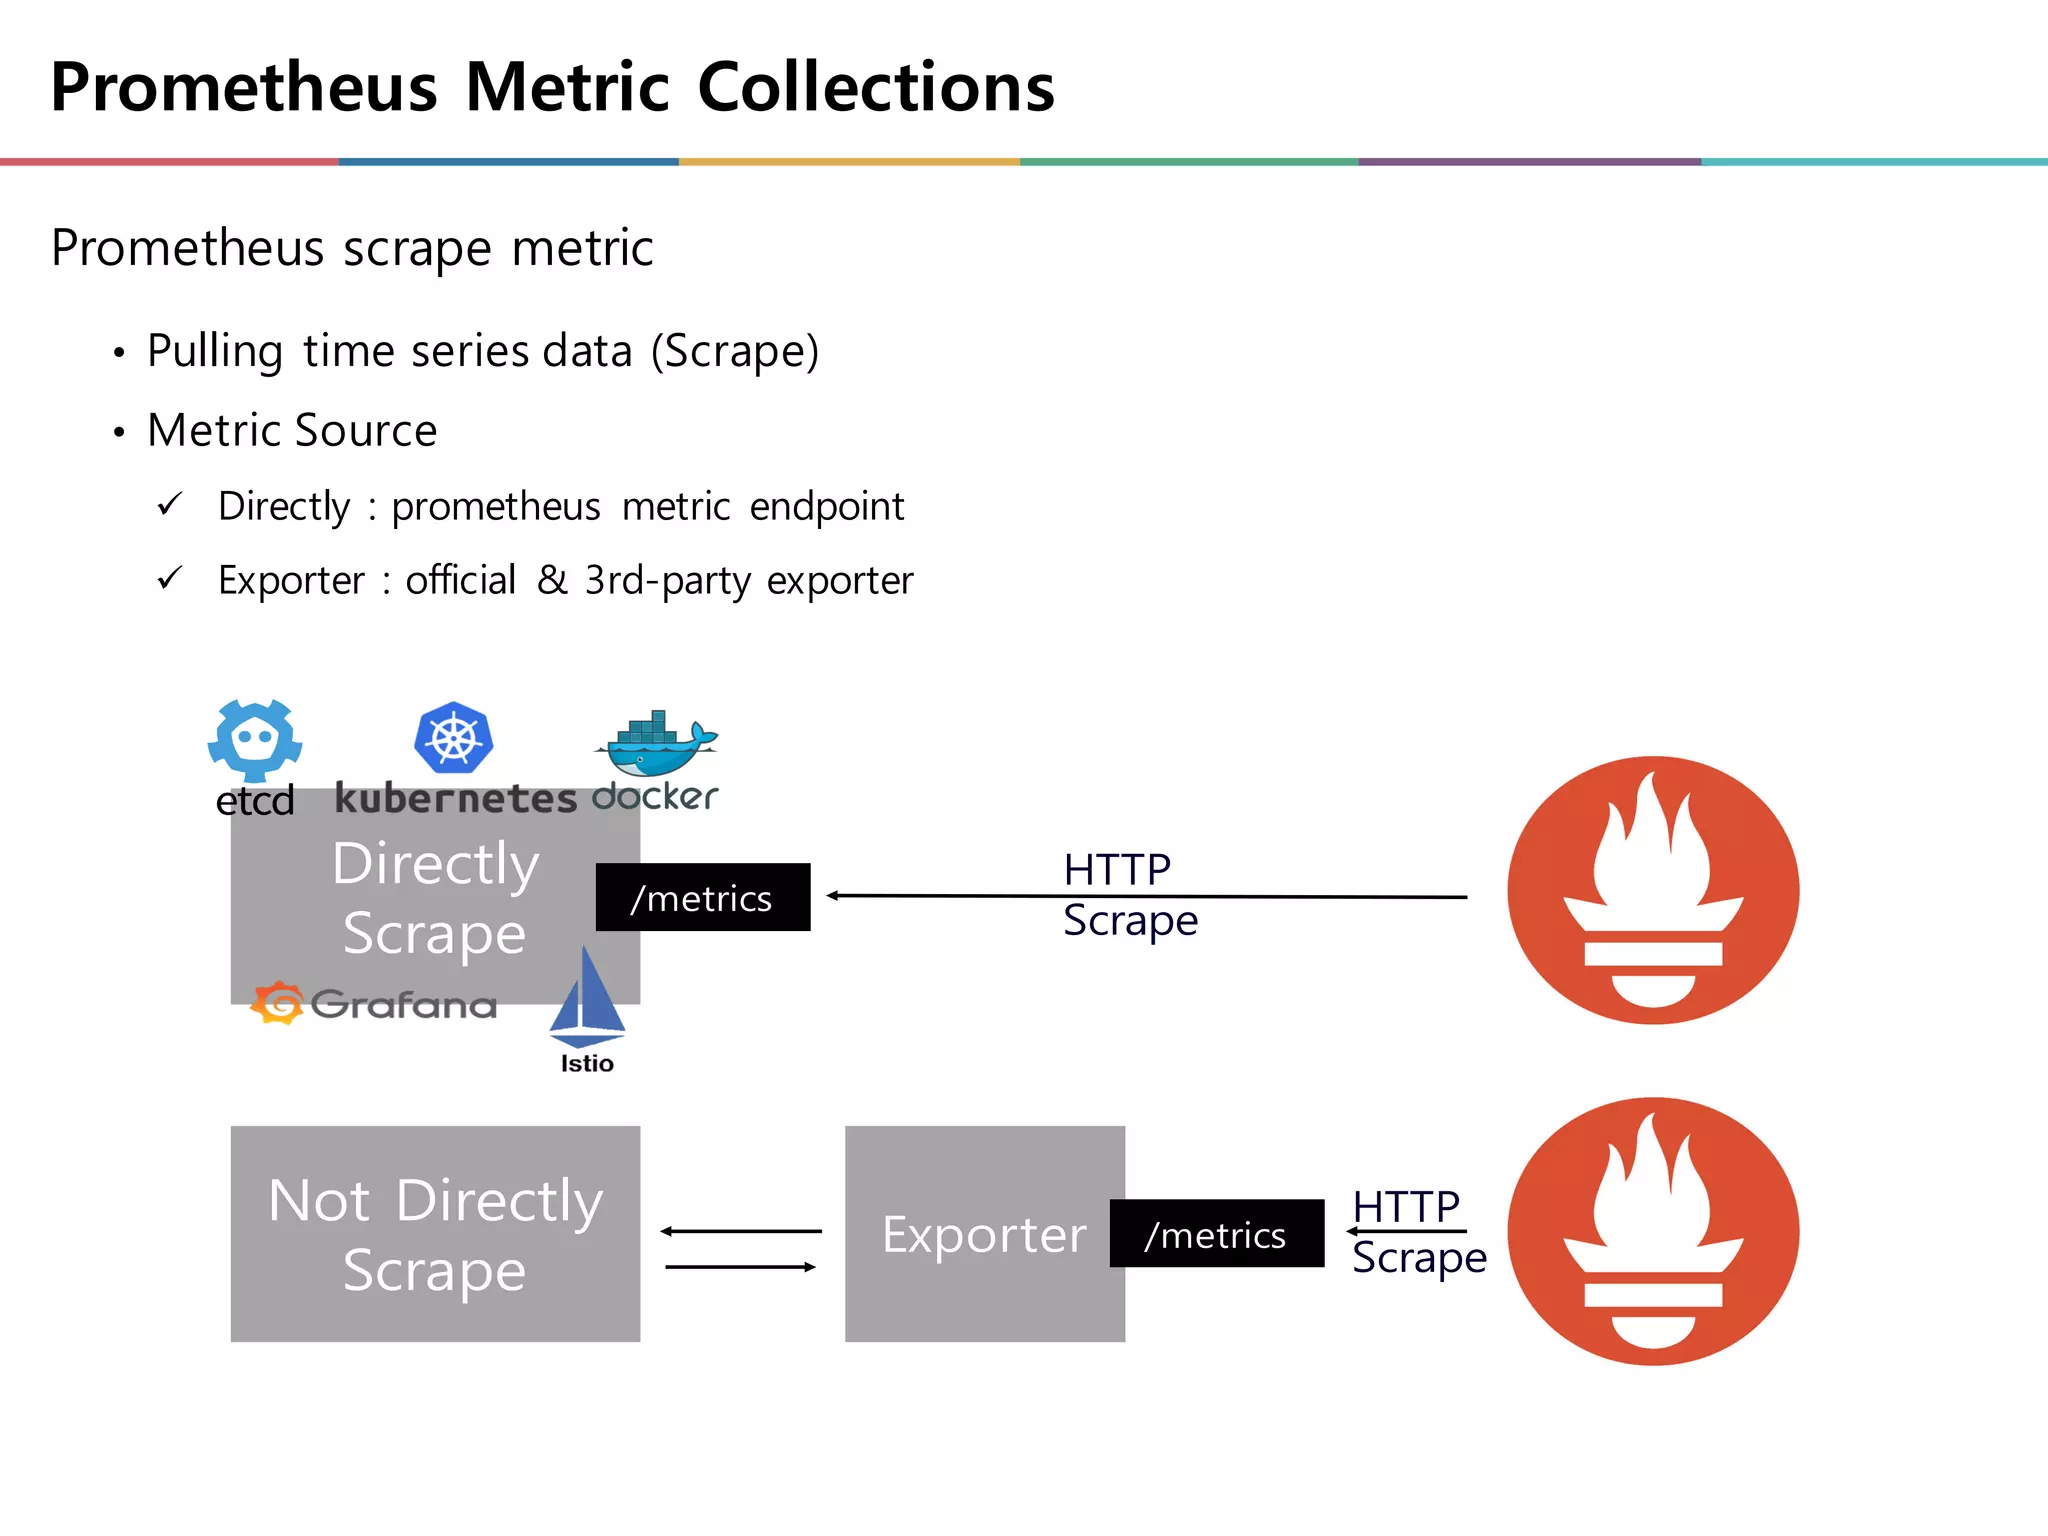
Prometheus Metric Collections
Prometheusscrape metric
• Pulling time series data (Scrape)
• Metric Source
ü Directly : prometheus metric endpoint
ü Exporter : official & 3rd-party exporter
Directly
Scrape
Not Directly
Scrape
Exporter
/metrics
/metrics
HTTP
Scrape
HTTP
Scrape
7.
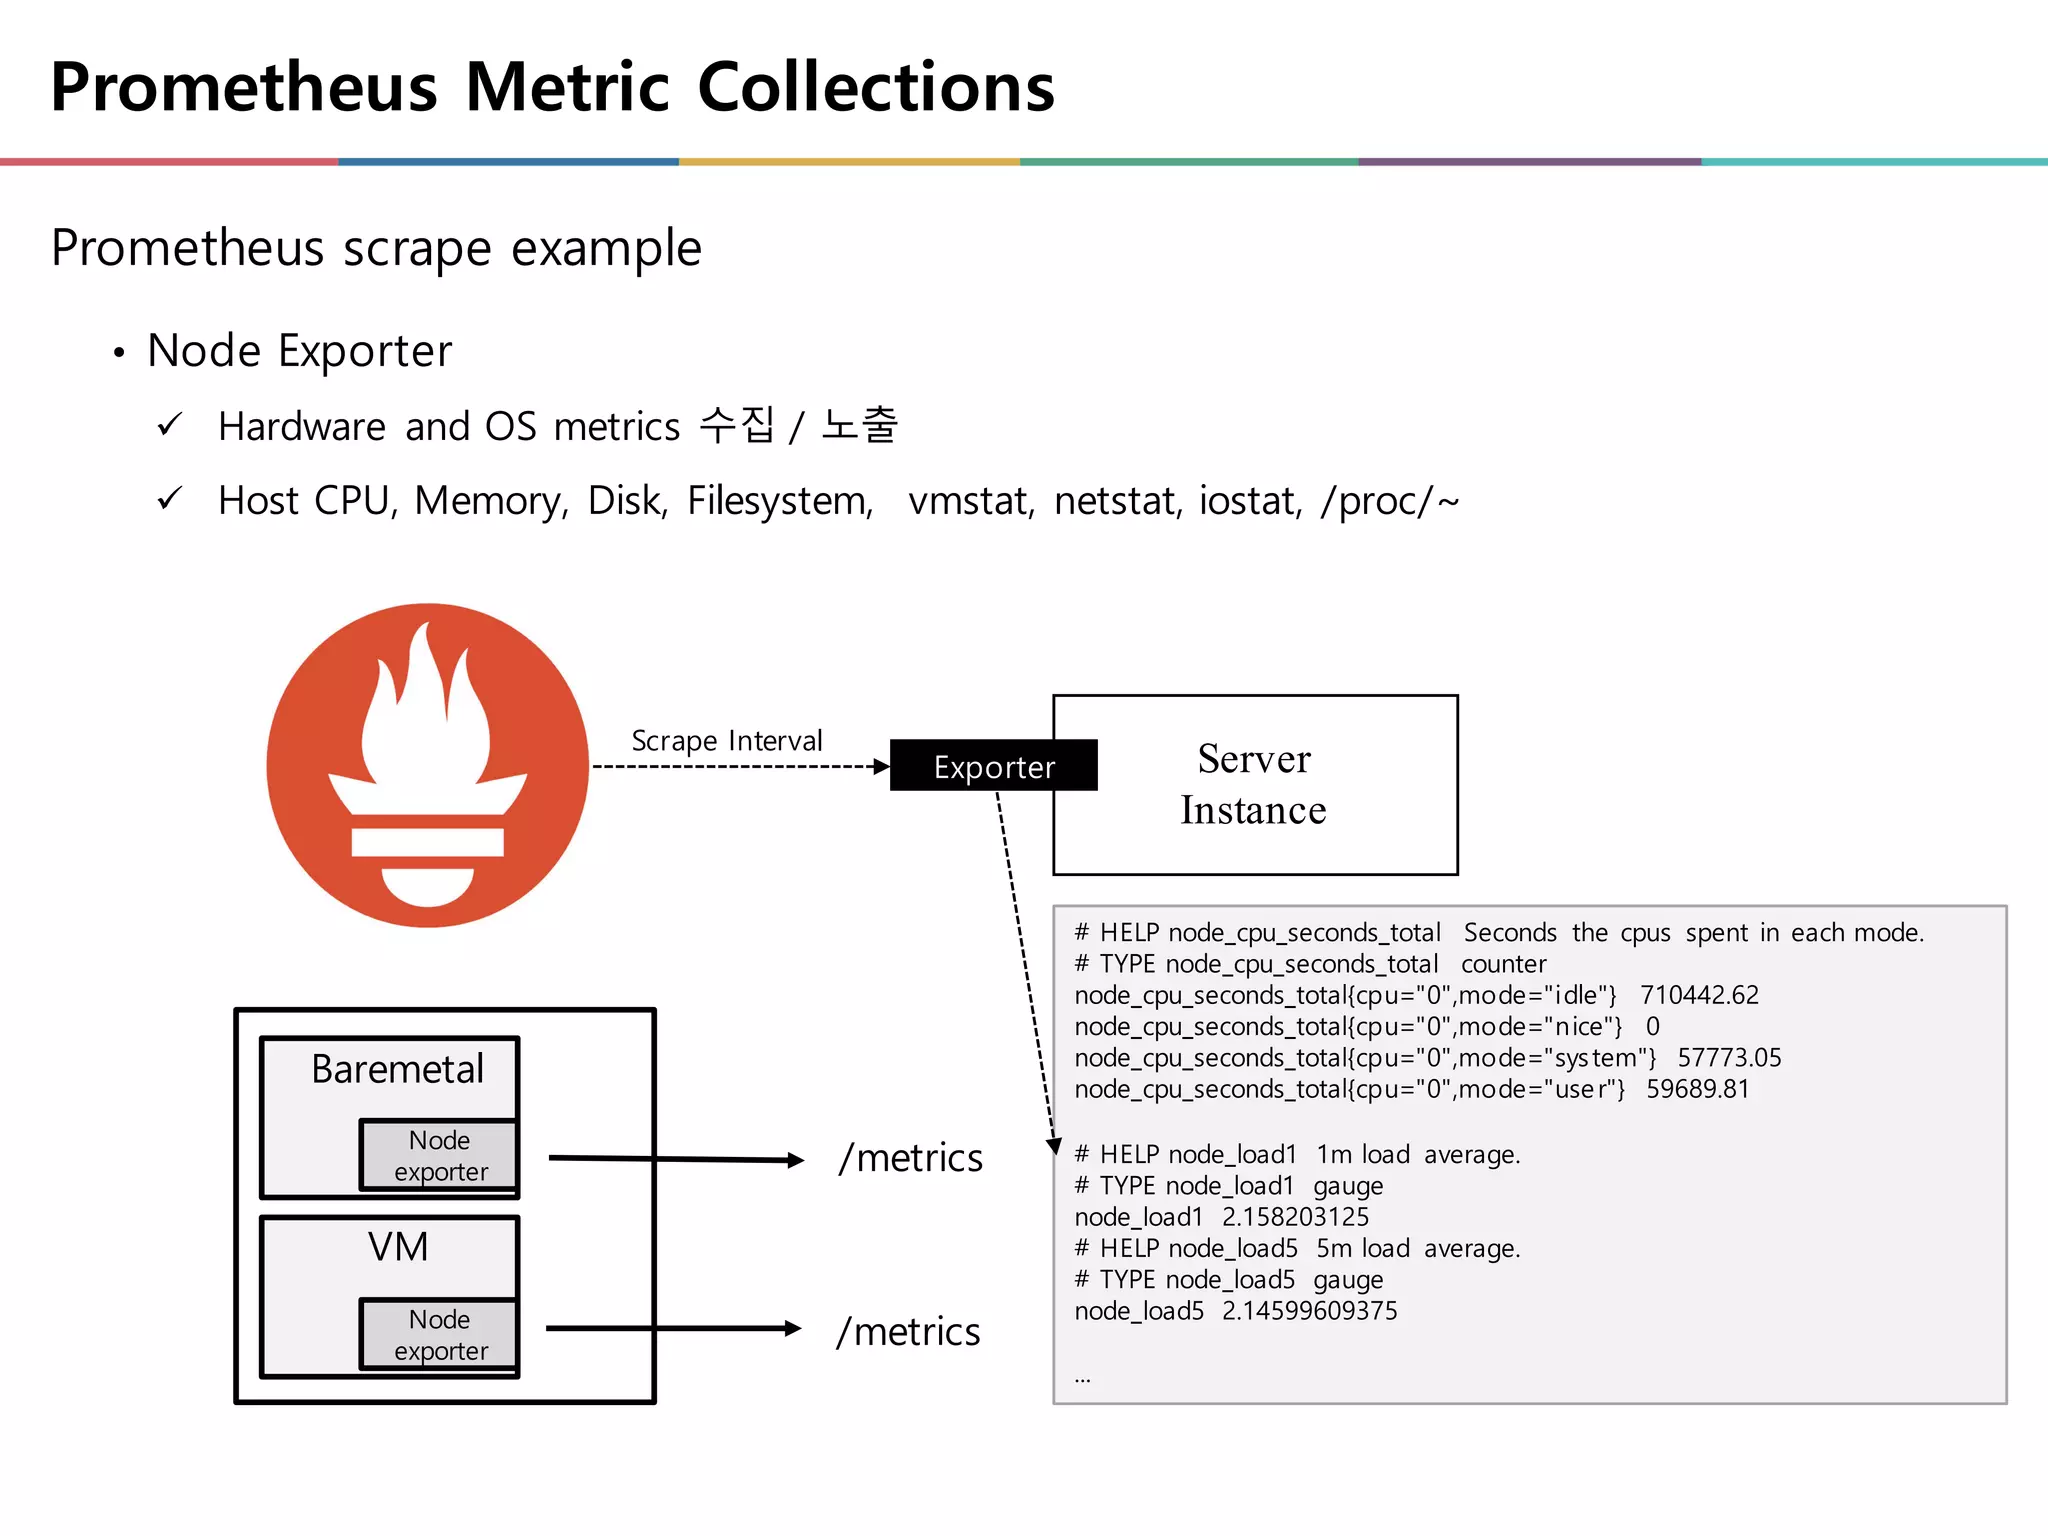
Prometheus Metric Collections
Prometheusscrape example
• Node Exporter
ü Hardware and OS metrics 수집 / 노출
ü Host CPU, Memory, Disk, Filesystem, vmstat, netstat, iostat, /proc/~
Server
Instance
Exporter
# HELP node_cpu_seconds_total Seconds the cpus spent in each mode.
# TYPE node_cpu_seconds_total counter
node_cpu_seconds_total{cpu="0",mode="idle"} 710442.62
node_cpu_seconds_total{cpu="0",mode="nice"} 0
node_cpu_seconds_total{cpu="0",mode="system"} 57773.05
node_cpu_seconds_total{cpu="0",mode="user"} 59689.81
# HELP node_load1 1m load average.
# TYPE node_load1 gauge
node_load1 2.158203125
# HELP node_load5 5m load average.
# TYPE node_load5 gauge
node_load5 2.14599609375
...
Scrape Interval
/metrics
Baremetal
VM
/metrics
Node
exporter
Node
exporter
8.
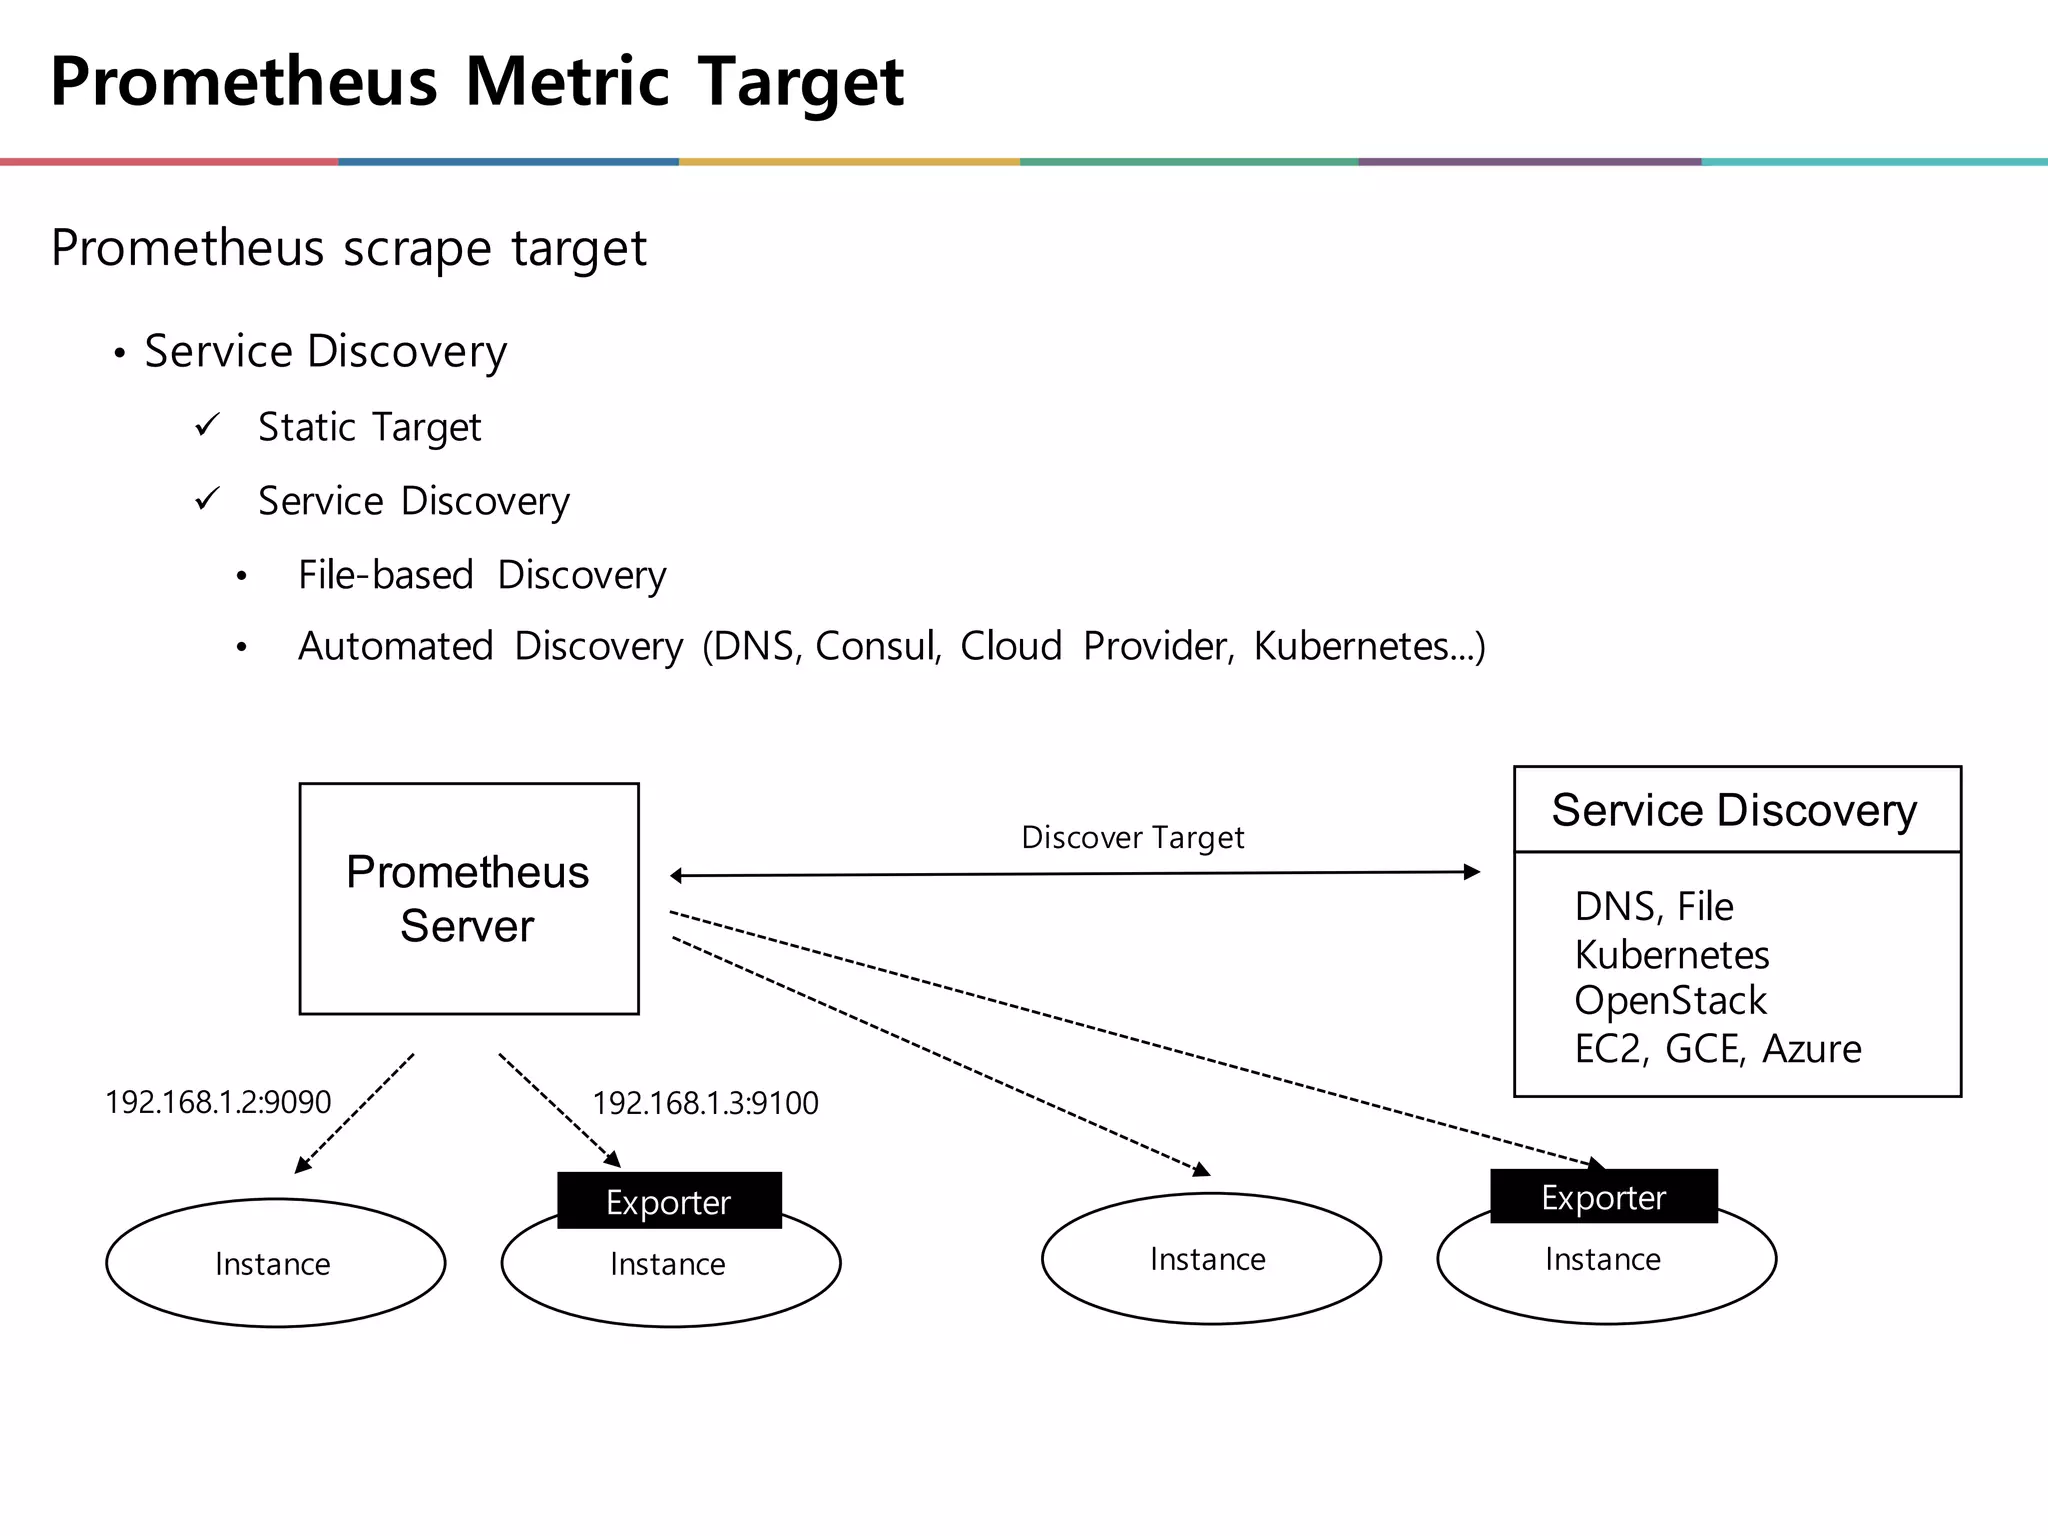
Prometheus Metric Target
Prometheusscrape target
Prometheus
Server
Instance Instance
Service Discovery
DNS, File
Kubernetes
OpenStack
EC2, GCE, Azure
Exporter
192.168.1.2:9090 192.168.1.3:9100
Instance Instance
Exporter
Discover Target
• Service Discovery
ü Static Target
ü Service Discovery
• File-based Discovery
• Automated Discovery (DNS, Consul, Cloud Provider, Kubernetes...)
9.
Prometheus Alerting &Alertmanager
Prometheus & Alertmanager 간 Alert Rule & Notification 연계 기능 제공
Alertmanager
Prometheus
Alert Rules
Prometheus
Alert Rules
• Alert Rules setting
• Alert Trigger
Prometheus
• Notification Channel Integration
• Send to Notification Channel
• Alert De-Duplication
• Alert Routing
• Silence
Alertmanager
- name: node.rules
rules:
- alert: NodeCPUUsage
expr: (100 - avg by (instance,mode) (irate(node_cpu_seconds_total{mode="idle"}[1m])) * 100) > 75
for: 2m
labels:
severity: warning
annotations:
message: CPU Usage HIGH
ü node_alerts.rules
Native Monitoring
1) KubernetesComponents Metrics
• Host/Kubernetes/Container/Application 까지다양한Metric 수집
ü All Components Expose Metrics (/metrics) + kube-state-metrics(exporter)
ü Ready to Monitoring with Prometheus
etcd
cluster
K-V Store
K8S Master
Kube-apiserver
Kube-scheduler
…
Kube-contoller-manager
K8S Master
kube-apiserver
kube-scheduler
…
kube-contoller-manager
K8S Worker Node
kubelet
kube-proxy
node exporter cAdvisor
POD
POD
kubelet
kube-proxy
node exporter cAdvisor
POD
POD
kubelet
kube-proxy
node exporter cAdvisor
POD
POD
Prometheus
kube-state-metri
cs
Grafana
Alertmanager
① k8s Service Discovery
② Pull component metric
Target Endpoint
kube-apiservers https://[Master]:443/metrics
kube-contoller-manager https://[Master]:10252/metrics
kube-scheduler https://[Master]:10251/metrics
kubelet https://[Master]:10250/metrics
etcd https://[Master]:2379/metrics
cadvisor https://[ALL]:4194/metrics
Node Exporter https://[ALL]:9100/metrics
kube-state-metric
(exporter)
https://[kube-state-metric-
pod]:8080/metrics
[Target Config][Metric Scrape]
12.
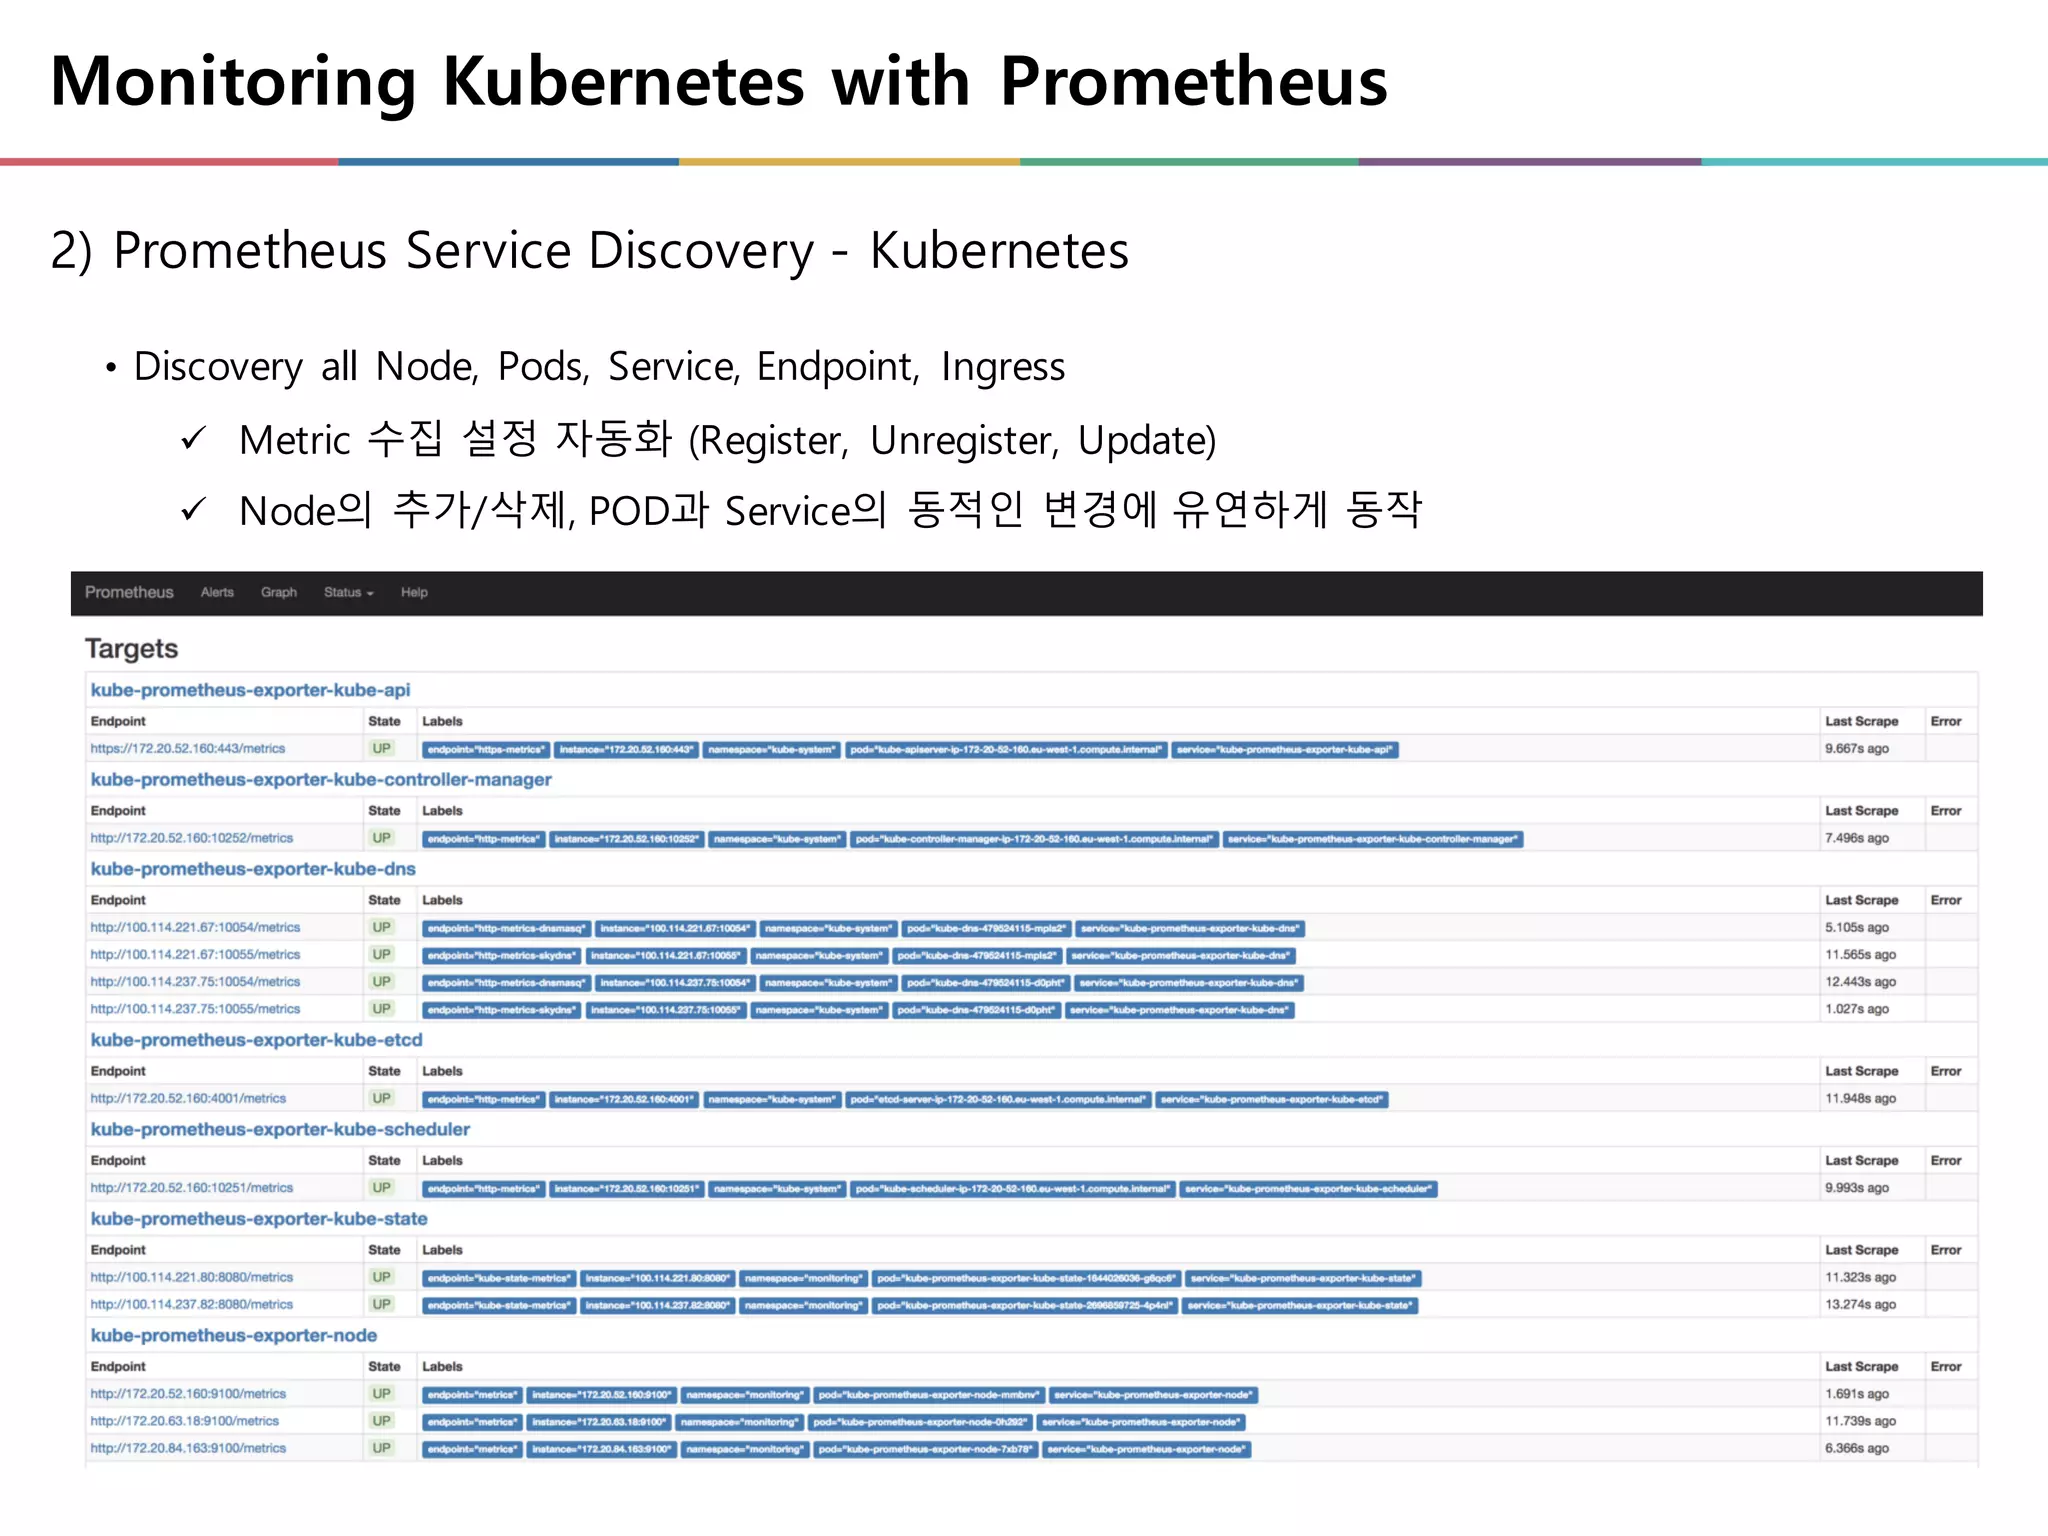
Monitoring Kubernetes withPrometheus
2) Prometheus Service Discovery - Kubernetes
• Discovery all Node, Pods, Service, Endpoint, Ingress
ü Metric 수집 설정 자동화 (Register, Unregister, Update)
ü Node의 추가/삭제, POD과 Service의 동적인 변경에 유연하게 동작
13.
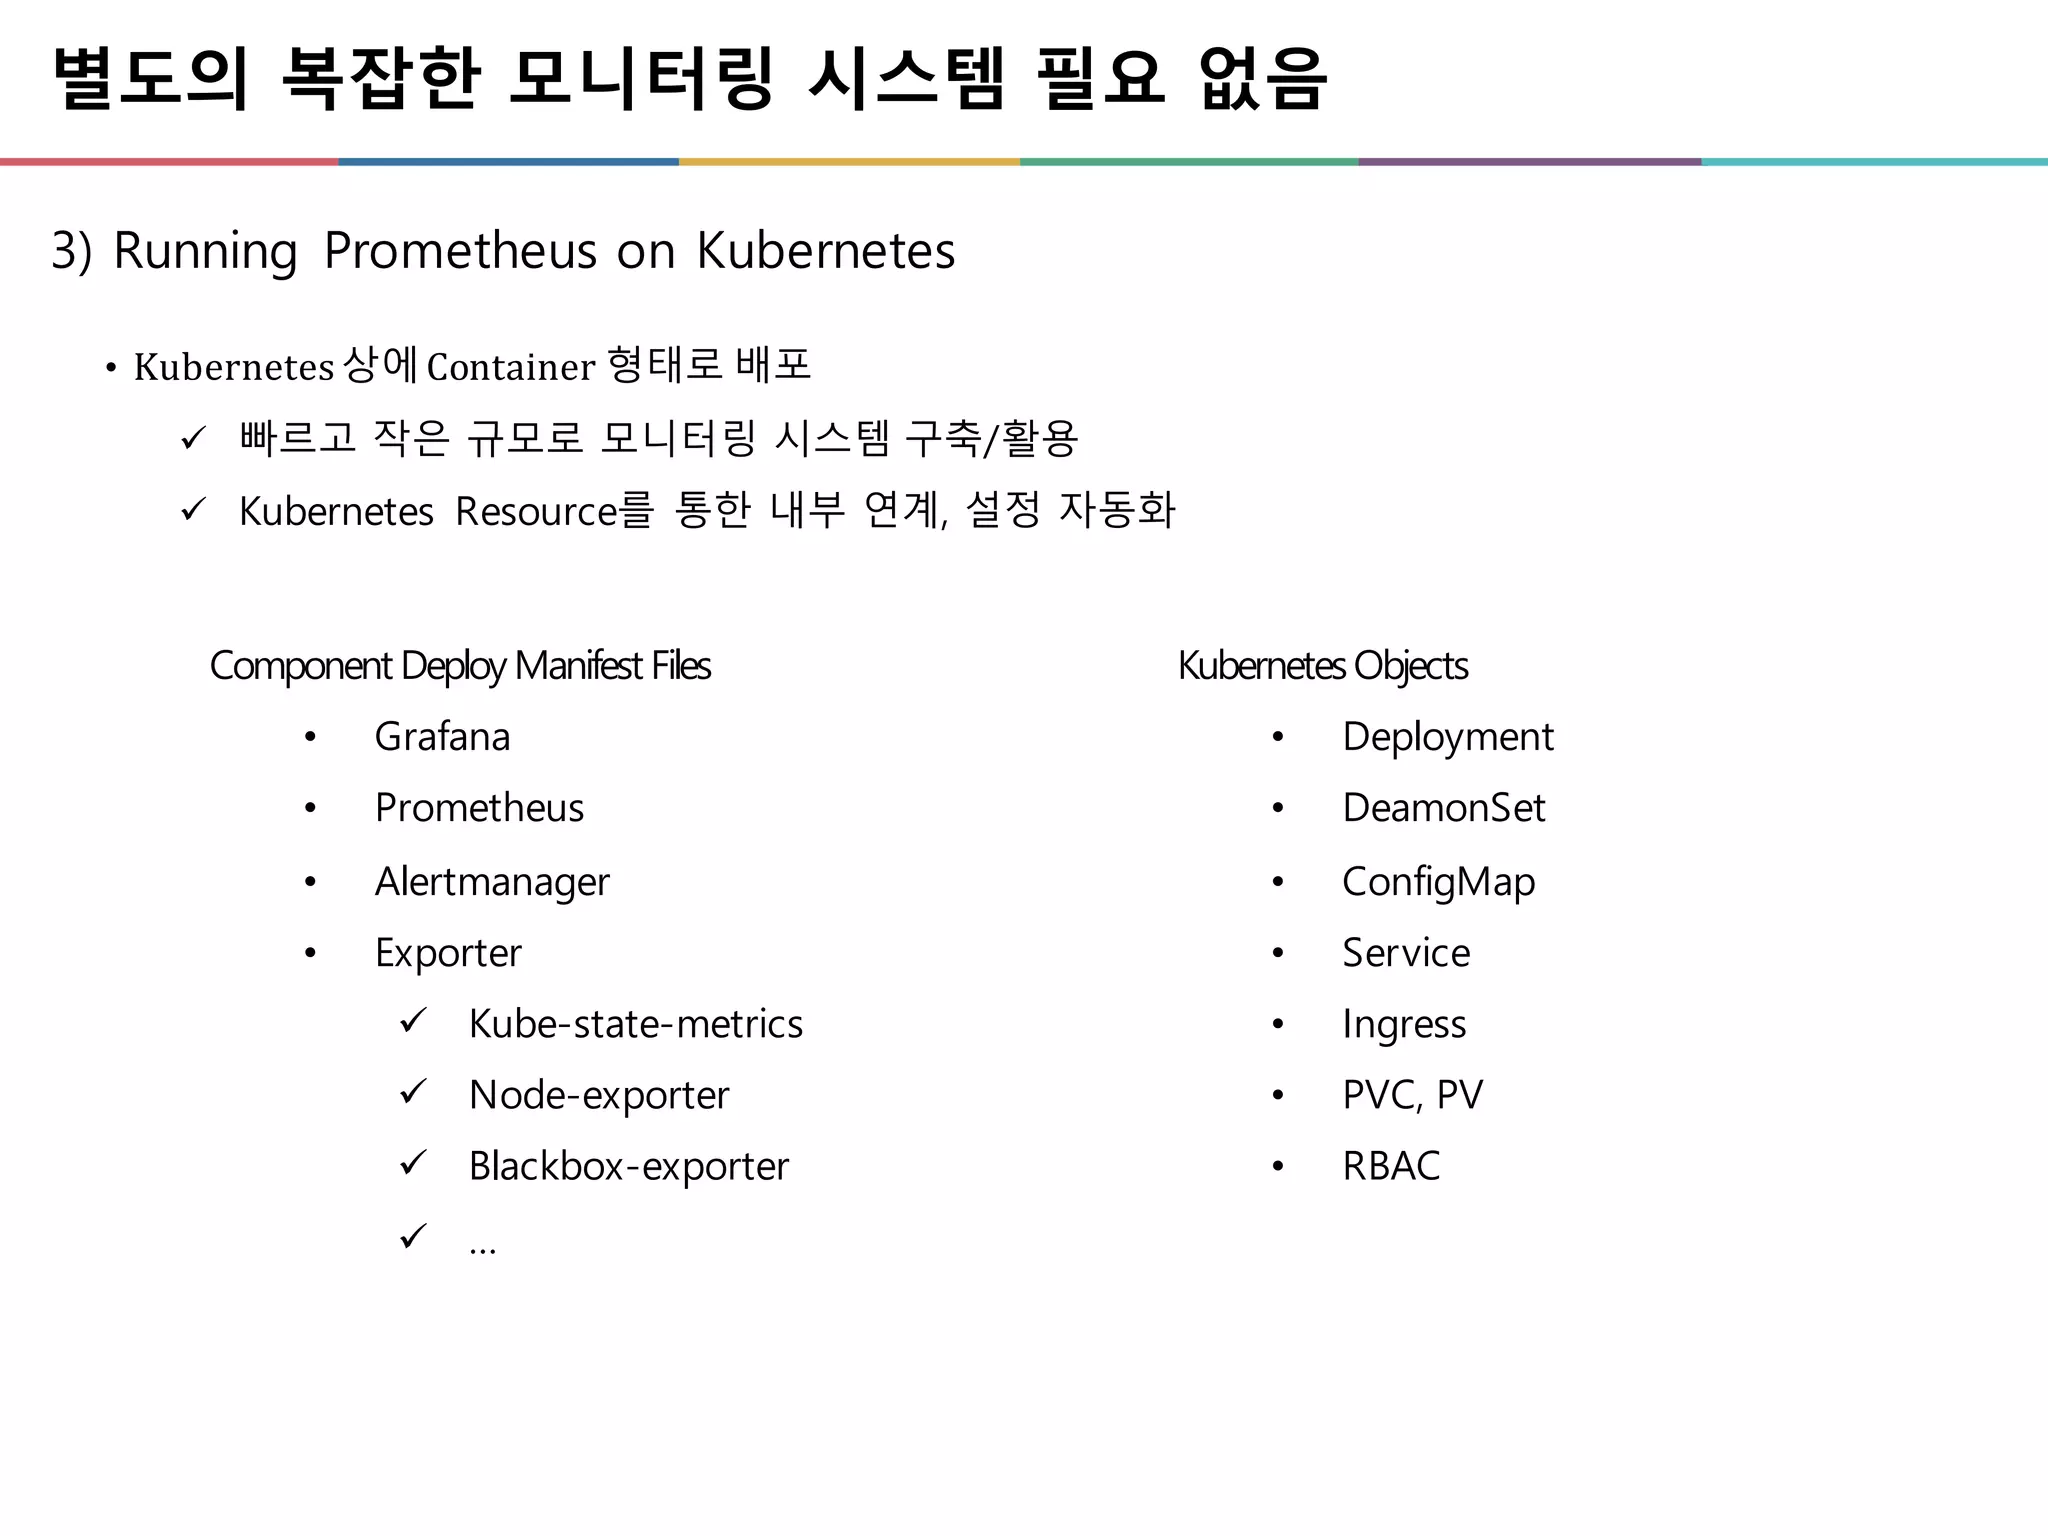
별도의 복잡한 모니터링시스템 필요 없음
3) Running Prometheus on Kubernetes
• Kubernetes 상에Container 형태로 배포
ü 빠르고 작은 규모로 모니터링 시스템 구축/활용
ü Kubernetes Resource를 통한 내부 연계, 설정 자동화
Component DeployManifest Files
• Grafana
• Prometheus
• Alertmanager
• Exporter
ü Kube-state-metrics
ü Node-exporter
ü Blackbox-exporter
ü …
KubernetesObjects
• Deployment
• DeamonSet
• ConfigMap
• Service
• Ingress
• PVC, PV
• RBAC
Prometheus Type ofMetrics
• Gauges
ü current state : snapshot of a specific measurement
ü Memory, Disk Usage 등 실시간 형태로 Metric 측정 Type
Gauges, Counter, Histogram
16.
Prometheus Type ofMetrics
• Counter
ü cumulative Metric Type, suffix : [xxx]_total, reset to zero on restart
ü rate()/irate() 함수를 통해 변화량/추이 분석에 유리
ü CPU, Request Count, Error Count, Network Usage 등
Gauges, Counter, Histogram
17.
Prometheus Type ofMetrics
• Histogram
ü 구간 별 데이터의 분포도 파악(Cumulative)
ü 데이터를 버킷으로 그룹화 - suffix : [xxx]_bucket
ü histogram_quantile() 함수를 통해 백분위 별 평균 집계에 용이
Gauges, Counter, Histogram
18.
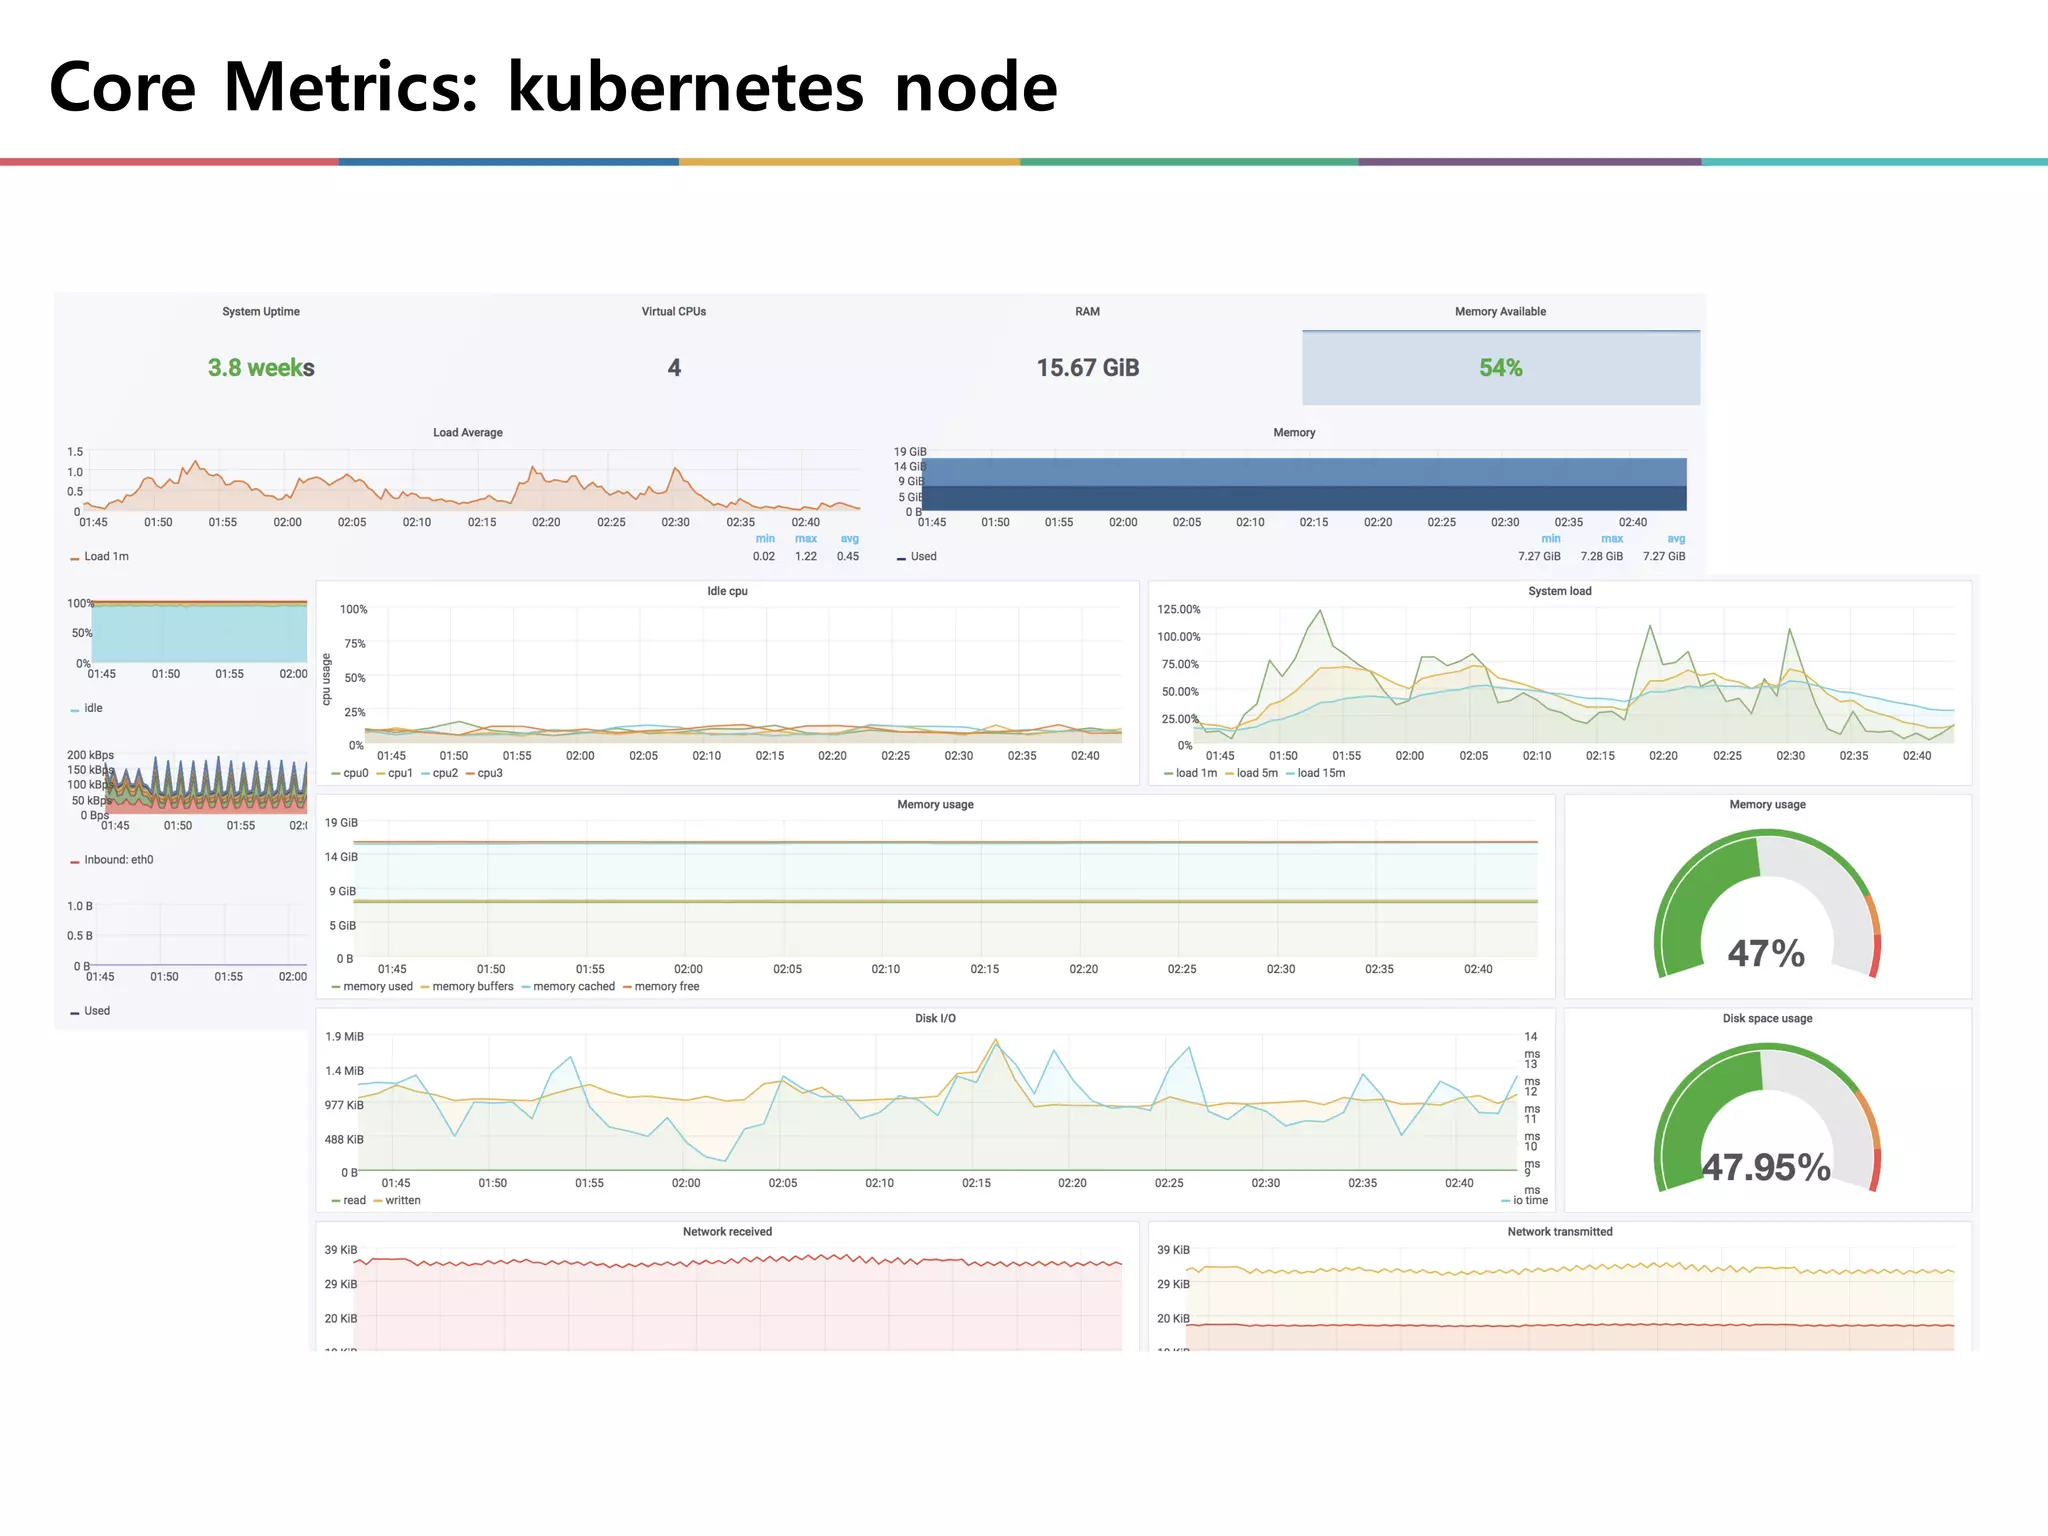
Core Metrics: kubernetesnode
• Physical machines (or VMs)
• Node-Exporter + DaemonSet 조합
ü prefix : node_[xxx]
Kubernetes All Node Level Metric 노출
구분 Metric Type Description
CPU node_cpu_seconds_total Count CPU Mode 별 점유 시간(per processor)
Load node_load1 / node_load5 /node_load15 Gauge System Load Average 1/5/15
Memory
node_memory_MemTotal
node_memory_MemeAvailable
node_memory_MemFree
node_memory_Buffers
node_memory_Cached
Gauge System Memory Information
Disk
node_filesystem_size
node_filesystem_avail
Gauge File System Info
node_disk_read_time_ms
node_disk_write_time_ms
node_disk_reads_completed
node_disk_writes_completed
Count Disk Latency & R/W Available
Network
node_network_receive_bytes
node_network_transmit_bytes
Gauge Network Information
System
node_time
node_boot_time
Gauge System Time
node_filefd_allocated
node_filed_maximum
Gauge File discriptor
Core Metrics: kubernetesContainer
• Container Resource Usage 중심 (CPU,Mem, Network, Disk..)
• Pod, Deployment, StatefulSet, DaemonSet 등 Replica controller 기준으로 조합 활용
ü prefix : container_[xxx]
cAdvisor : Docker Daemon 내 Running Container Metric 노출
구분 Metric Type Description
CPU
container_cpu_usage_seconds_total Counter Container CPU Usage (per processer)
container_cpu_cfs_throttled_seconds_total Counter Container CPU throttled Time
Memory
container_memory_usage_bytes Gauge
Current memory usage in bytes(all memory
regardless of when it was accessed)
container_memory_working_set_bytes Gauge Current working set in bytes
Network
container_network_receive_bytes_total Counter Cumulative count of bytes received.
container_network_transmit_bytes_total Counter Cumulative count of bytes transmitted.
System container_start_time_seconds Gauge Container start time
21.
Core Metrics: kubernetesmetric
Kube-state-metric : Generate metrics about k8s API
• Exporter로 Container 구동되어 Kubernetes Metric 수집
• kubectl get ~ : node, service, deployment, replicasets, pods, pv, pvc, configmap, quotas,
secret, etc…
ü prefix : kube_[xxx]
ü https://github.com/kubernetes/kube-state-metrics/tree/master/Documentation#exposed-
metrics
Node Metric
Pod Metric
Deployment
Metric
- Node Info IP (Name, IP, Version)
- Node Condition
- Node Capacity
- Pod / Container Info (Pod IP,
Namespace, Node IP)
- Pod / Container status
- Container Resource (Requests,limit)
Service Metric
- Service Info (Cluster IP, Name)
- Service Type
- Deployment Replica Count
- Replica Availables
Quota Metric
- Resource Quota 할당 정보
22.
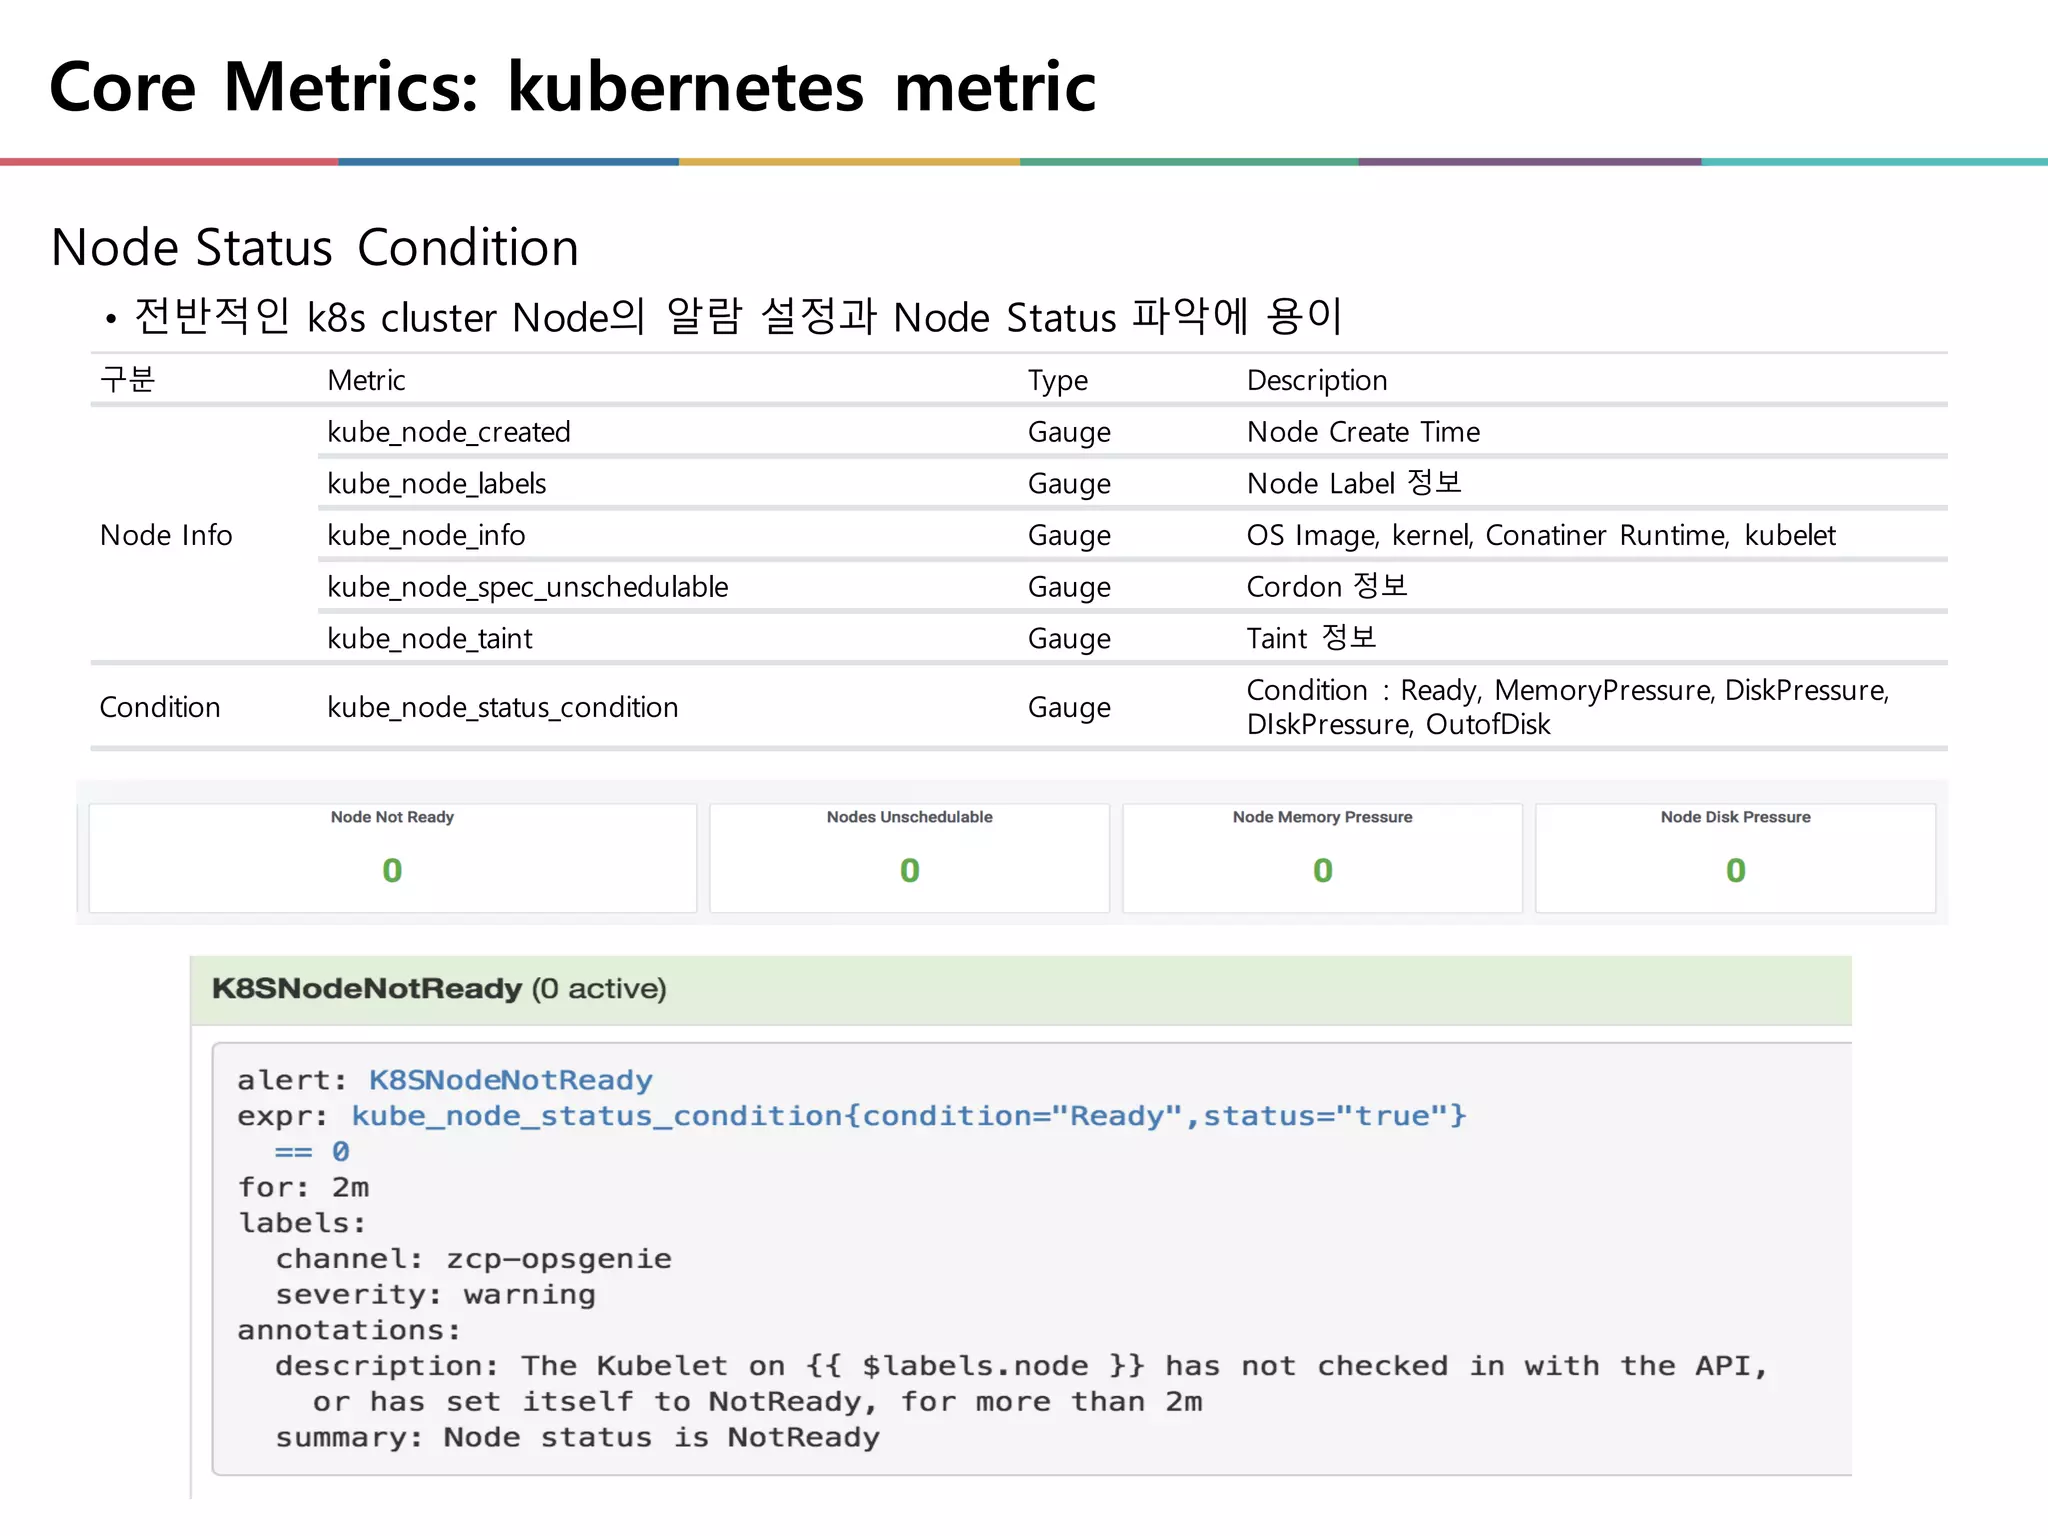
Core Metrics: kubernetesmetric
Node Status Condition
• 전반적인 k8s cluster Node의 알람 설정과 Node Status 파악에 용이
구분 Metric Type Description
Node Info
kube_node_created Gauge Node Create Time
kube_node_labels Gauge Node Label 정보
kube_node_info Gauge OS Image, kernel, Conatiner Runtime, kubelet
kube_node_spec_unschedulable Gauge Cordon 정보
kube_node_taint Gauge Taint 정보
Condition kube_node_status_condition Gauge
Condition : Ready, MemoryPressure, DiskPressure,
DIskPressure, OutofDisk
23.
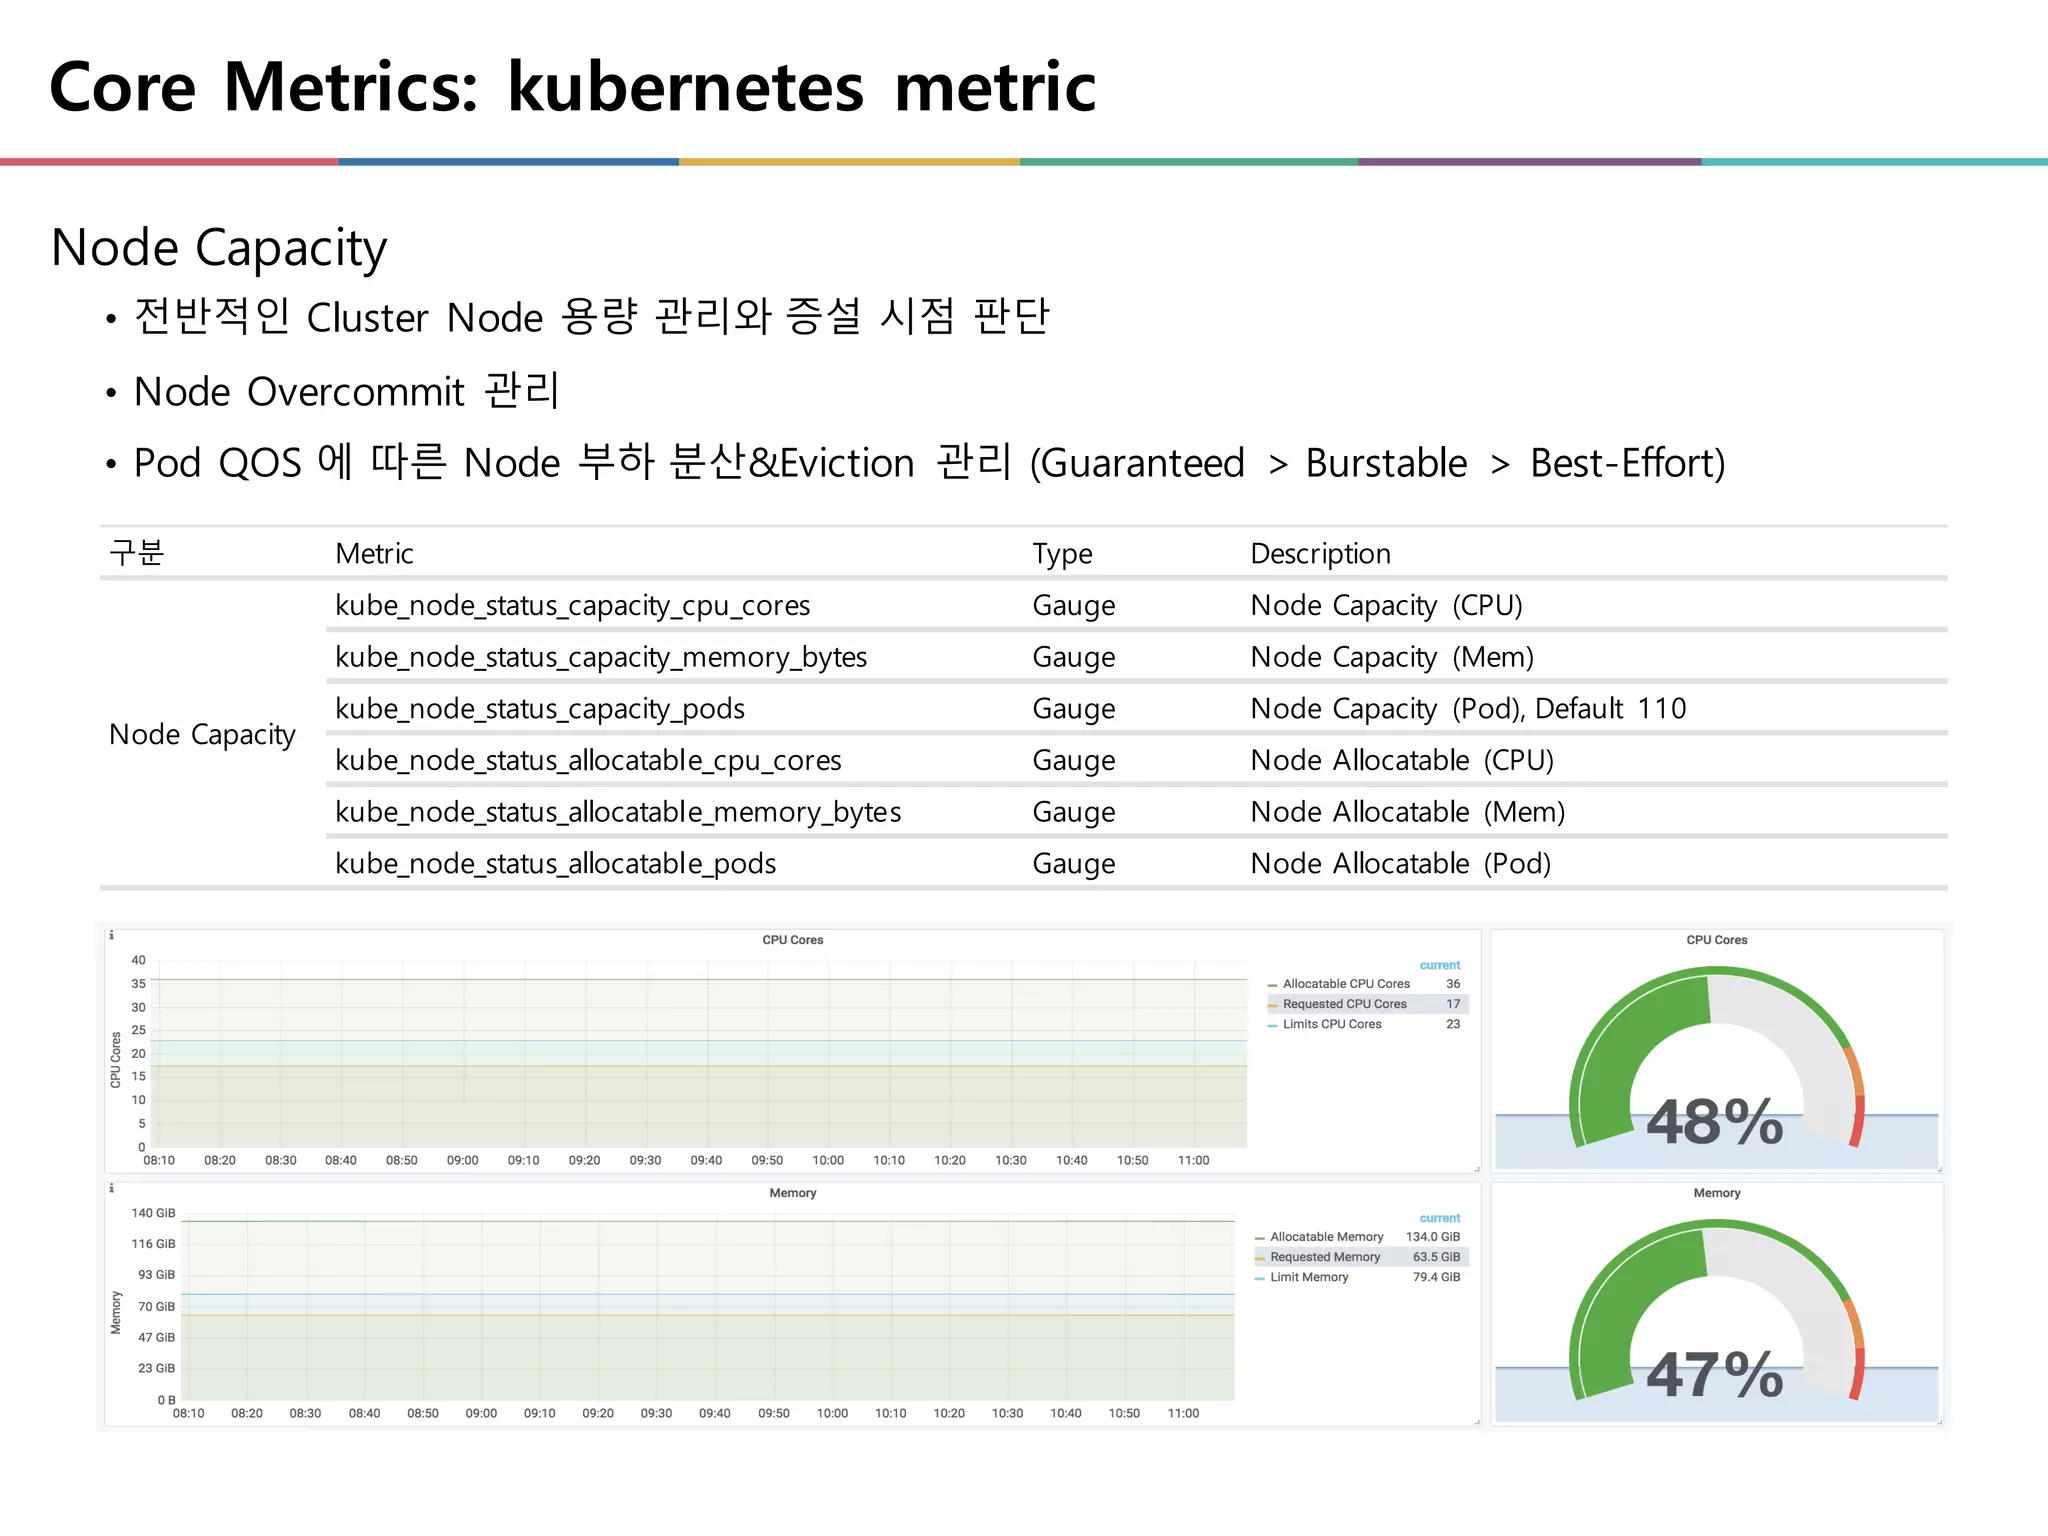
Core Metrics: kubernetesmetric
Node Capacity
• 전반적인 Cluster Node 용량 관리와 증설 시점 판단
• Node Overcommit 관리
• Pod QOS 에 따른 Node 부하 분산&Eviction 관리 (Guaranteed > Burstable > Best-Effort)
구분 Metric Type Description
Node Capacity
kube_node_status_capacity_cpu_cores Gauge Node Capacity (CPU)
kube_node_status_capacity_memory_bytes Gauge Node Capacity (Mem)
kube_node_status_capacity_pods Gauge Node Capacity (Pod), Default 110
kube_node_status_allocatable_cpu_cores Gauge Node Allocatable (CPU)
kube_node_status_allocatable_memory_bytes Gauge Node Allocatable (Mem)
kube_node_status_allocatable_pods Gauge Node Allocatable (Pod)
24.
Core Metrics: kubernetesmetric
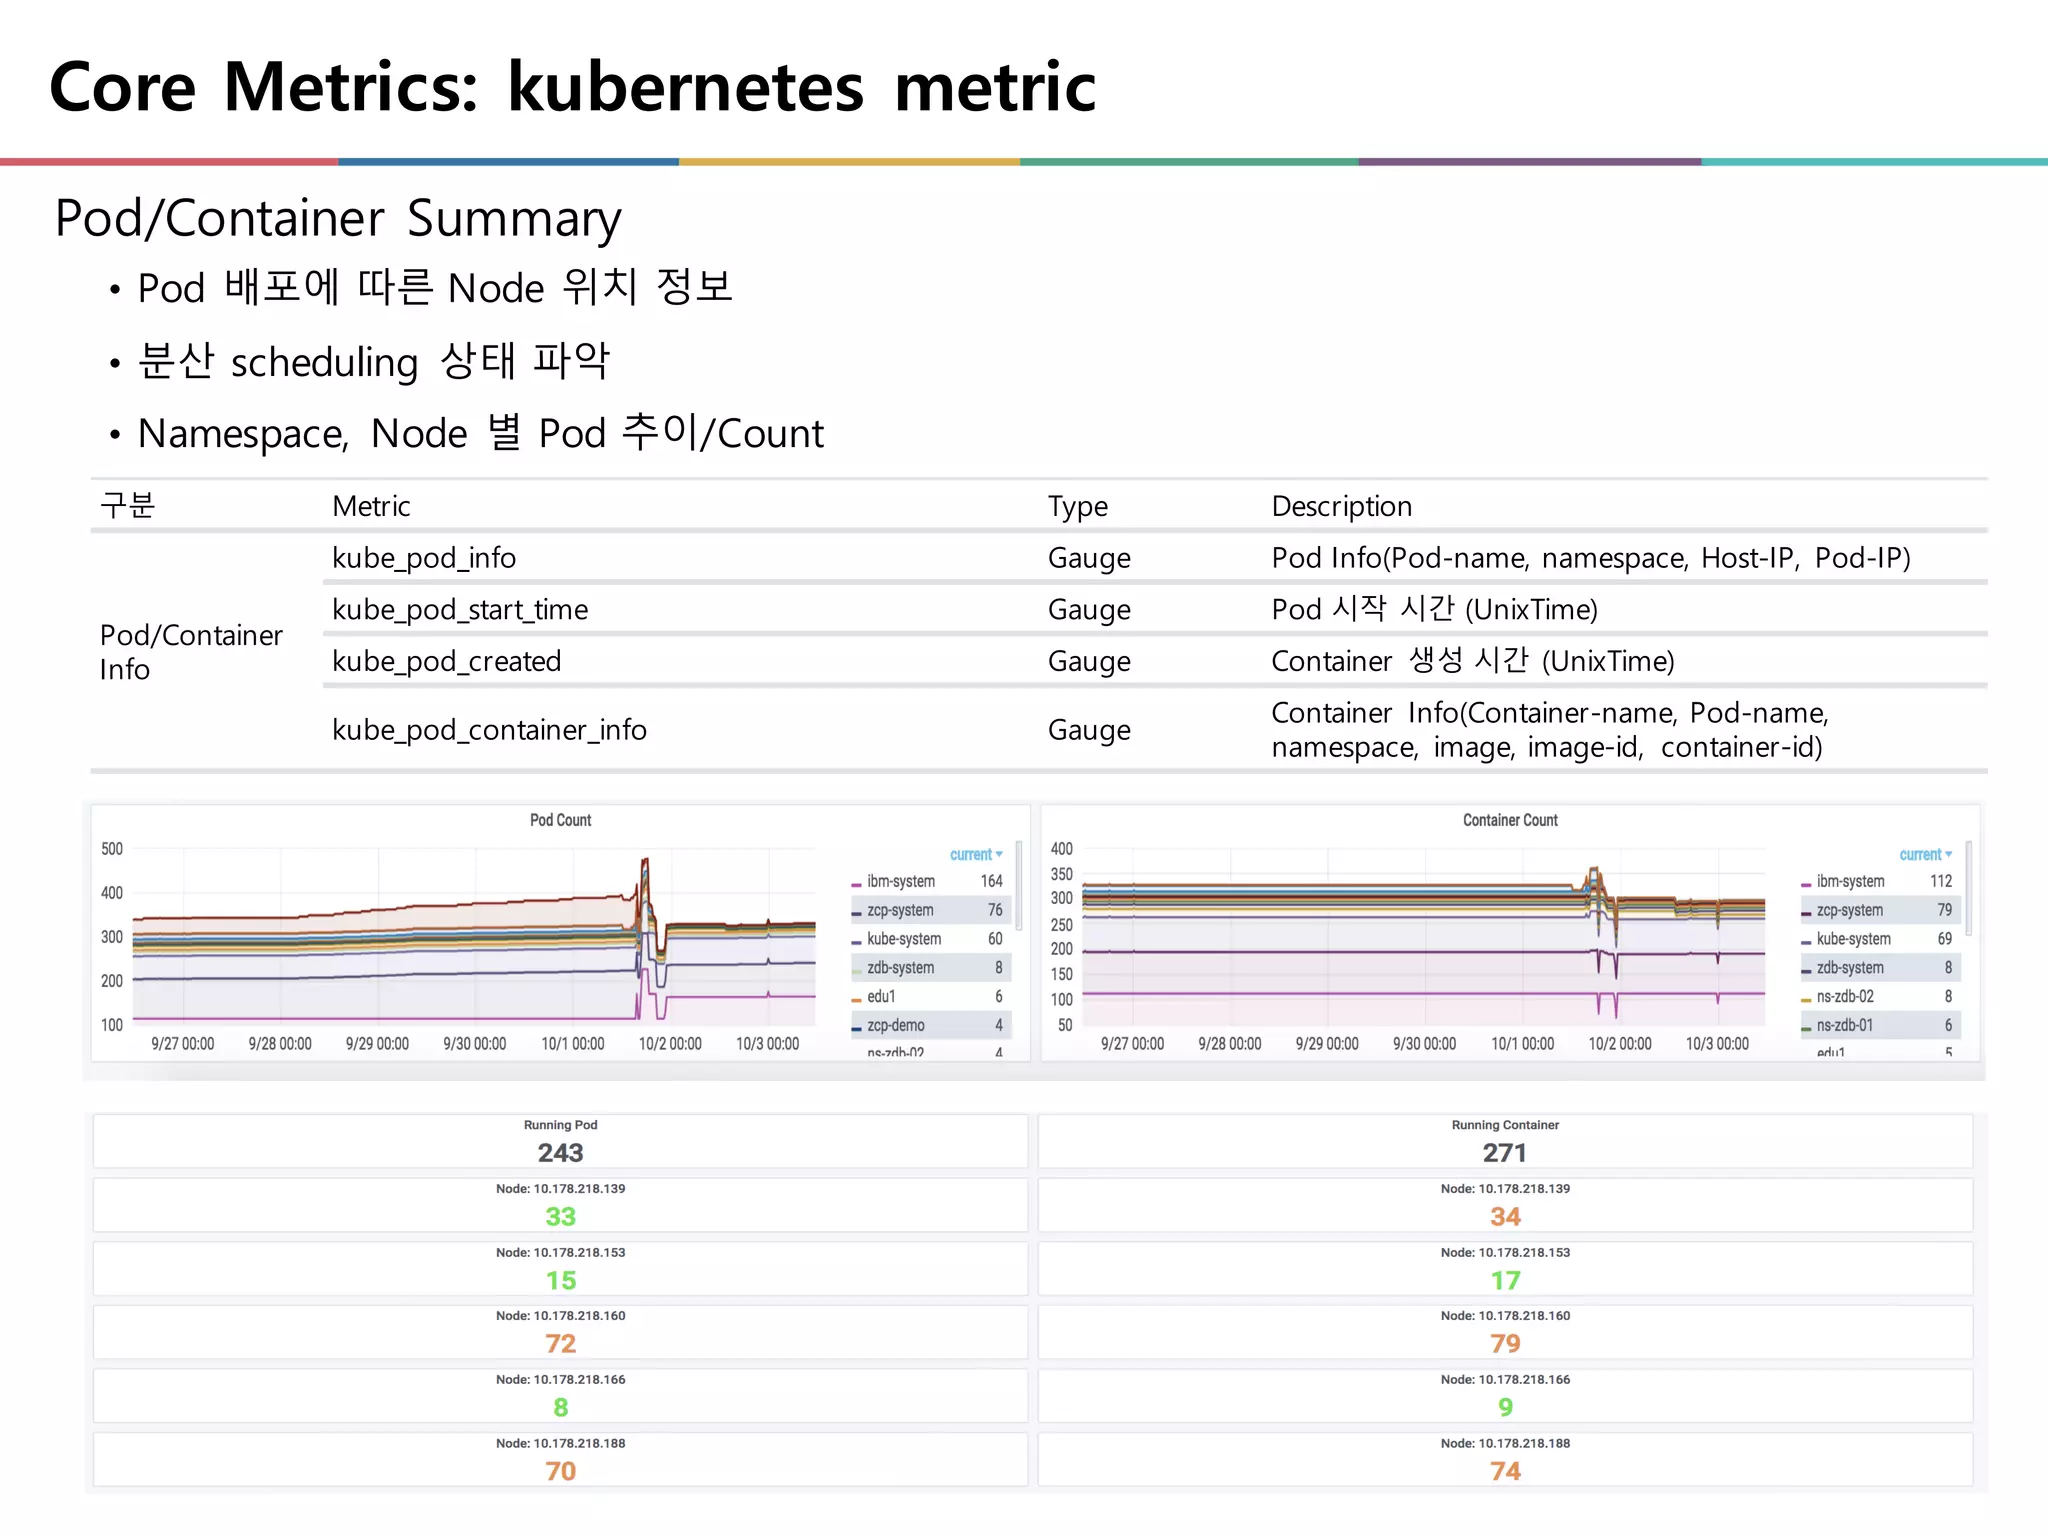
Pod/Container Summary
• Pod 배포에 따른 Node 위치 정보
• 분산 scheduling 상태 파악
• Namespace, Node 별 Pod 추이/Count
구분 Metric Type Description
Pod/Container
Info
kube_pod_info Gauge Pod Info(Pod-name, namespace, Host-IP, Pod-IP)
kube_pod_start_time Gauge Pod 시작 시간 (UnixTime)
kube_pod_created Gauge Container 생성 시간 (UnixTime)
kube_pod_container_info Gauge
Container Info(Container-name, Pod-name,
namespace, image, image-id, container-id)
25.
Core Metrics: kubernetesmetric
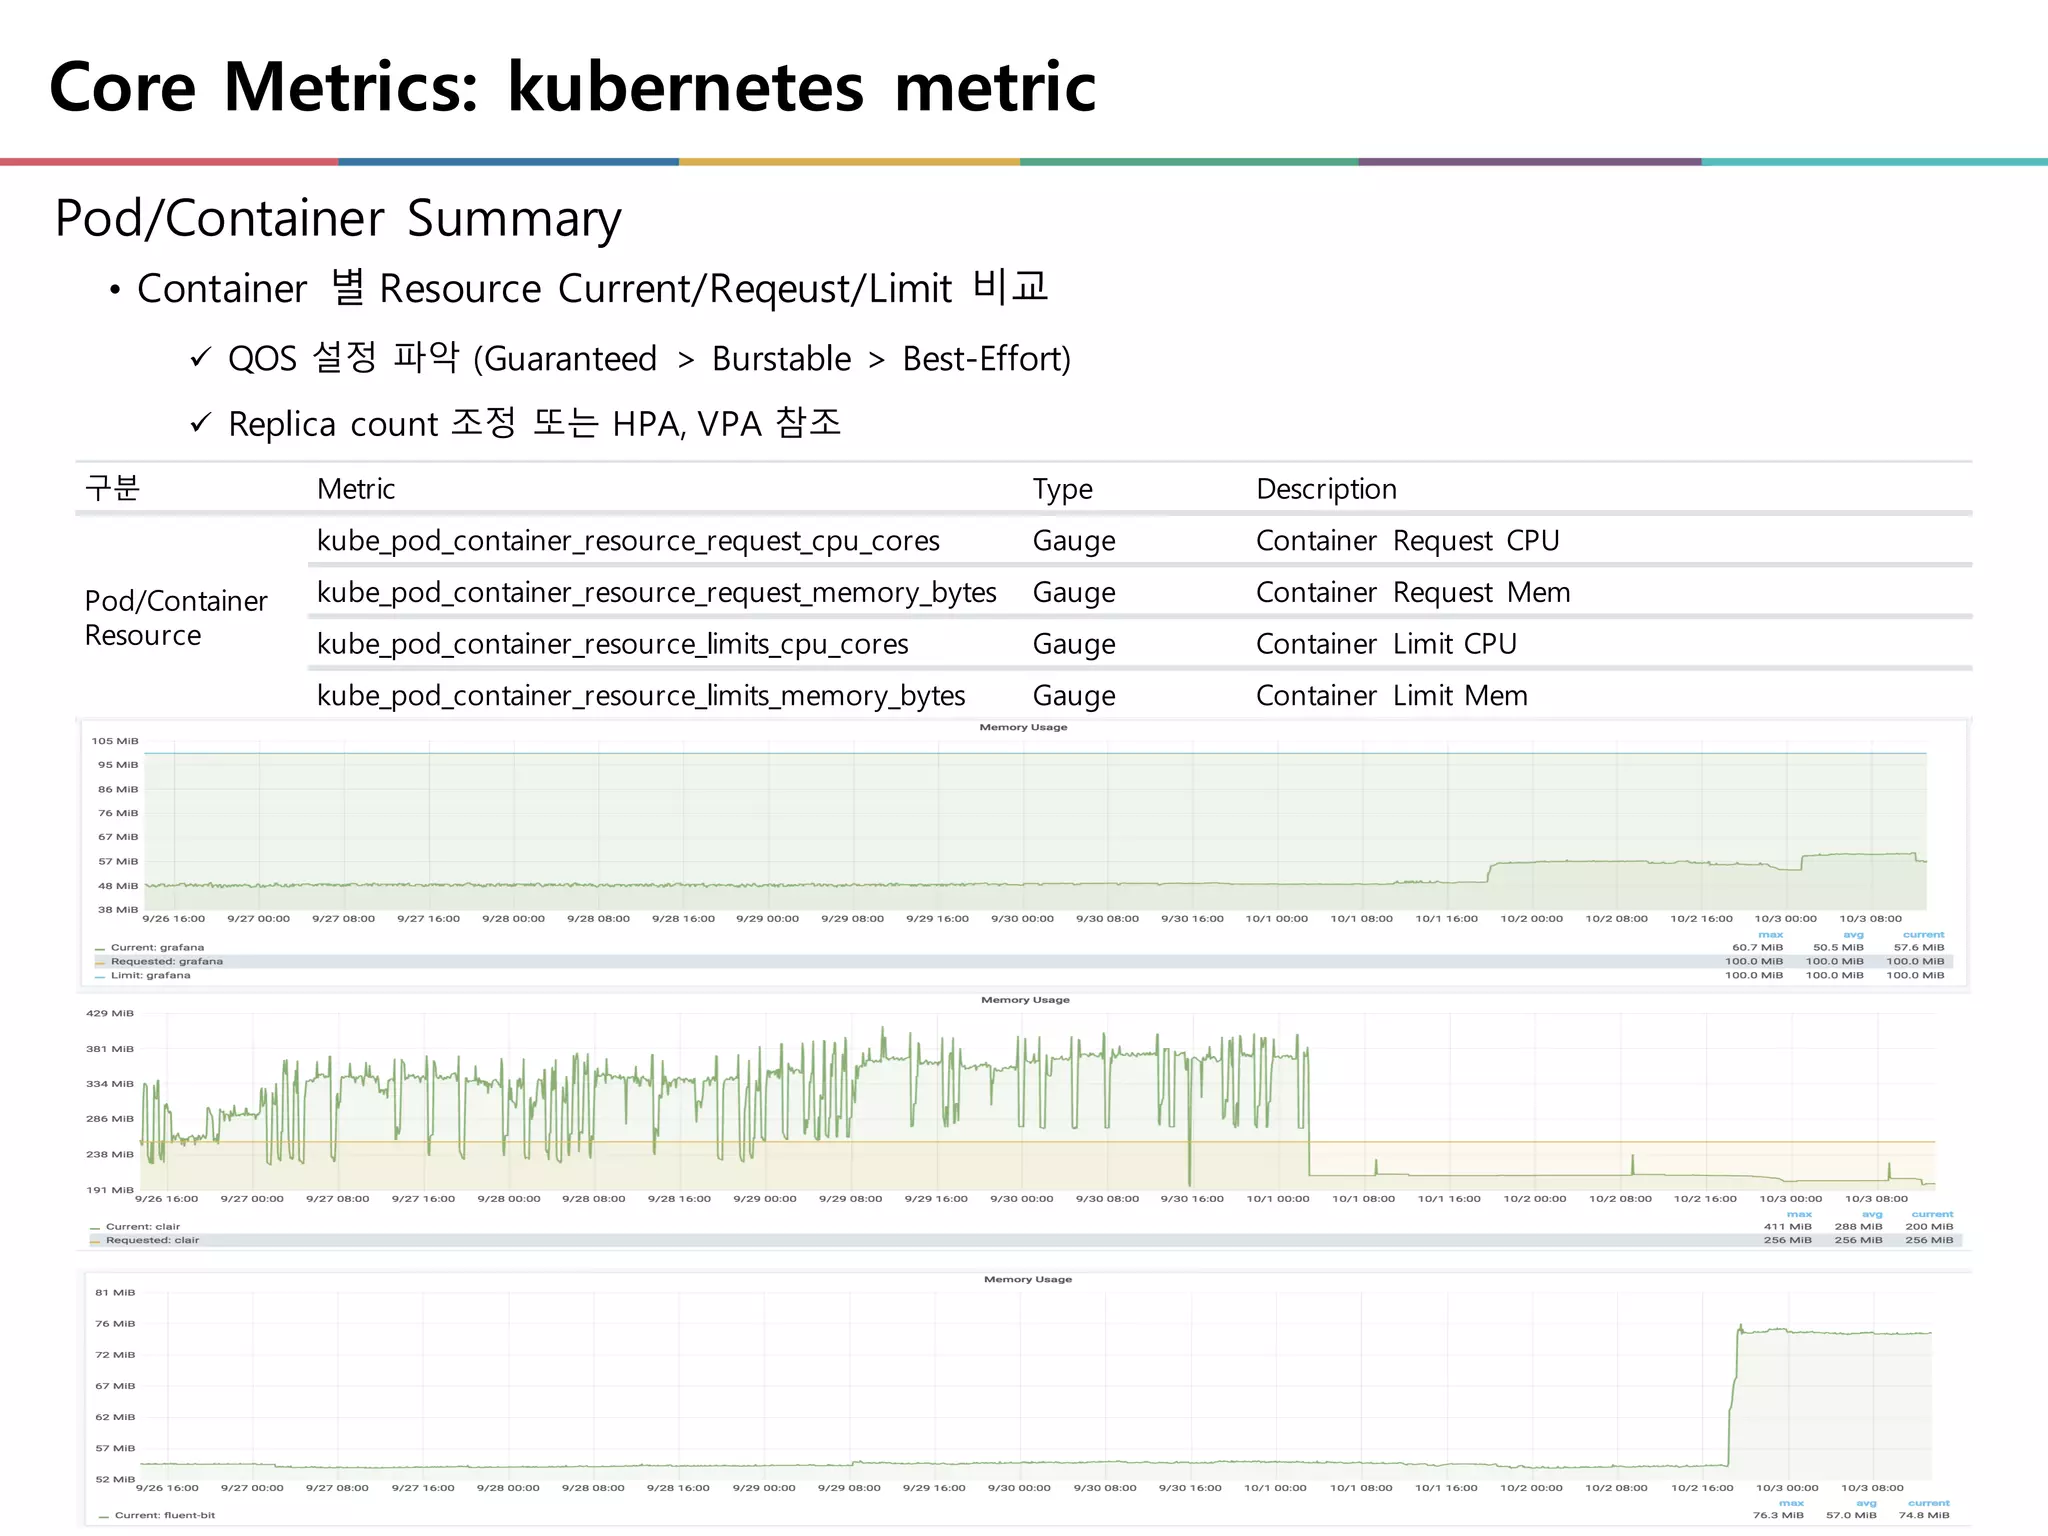
Pod/Container Summary
• Container 별 Resource Current/Reqeust/Limit 비교
ü QOS 설정 파악 (Guaranteed > Burstable > Best-Effort)
ü Replica count 조정 또는 HPA, VPA 참조
구분 Metric Type Description
Pod/Container
Resource
kube_pod_container_resource_request_cpu_cores Gauge Container Request CPU
kube_pod_container_resource_request_memory_bytes Gauge Container Request Mem
kube_pod_container_resource_limits_cpu_cores Gauge Container Limit CPU
kube_pod_container_resource_limits_memory_bytes Gauge Container Limit Mem
26.
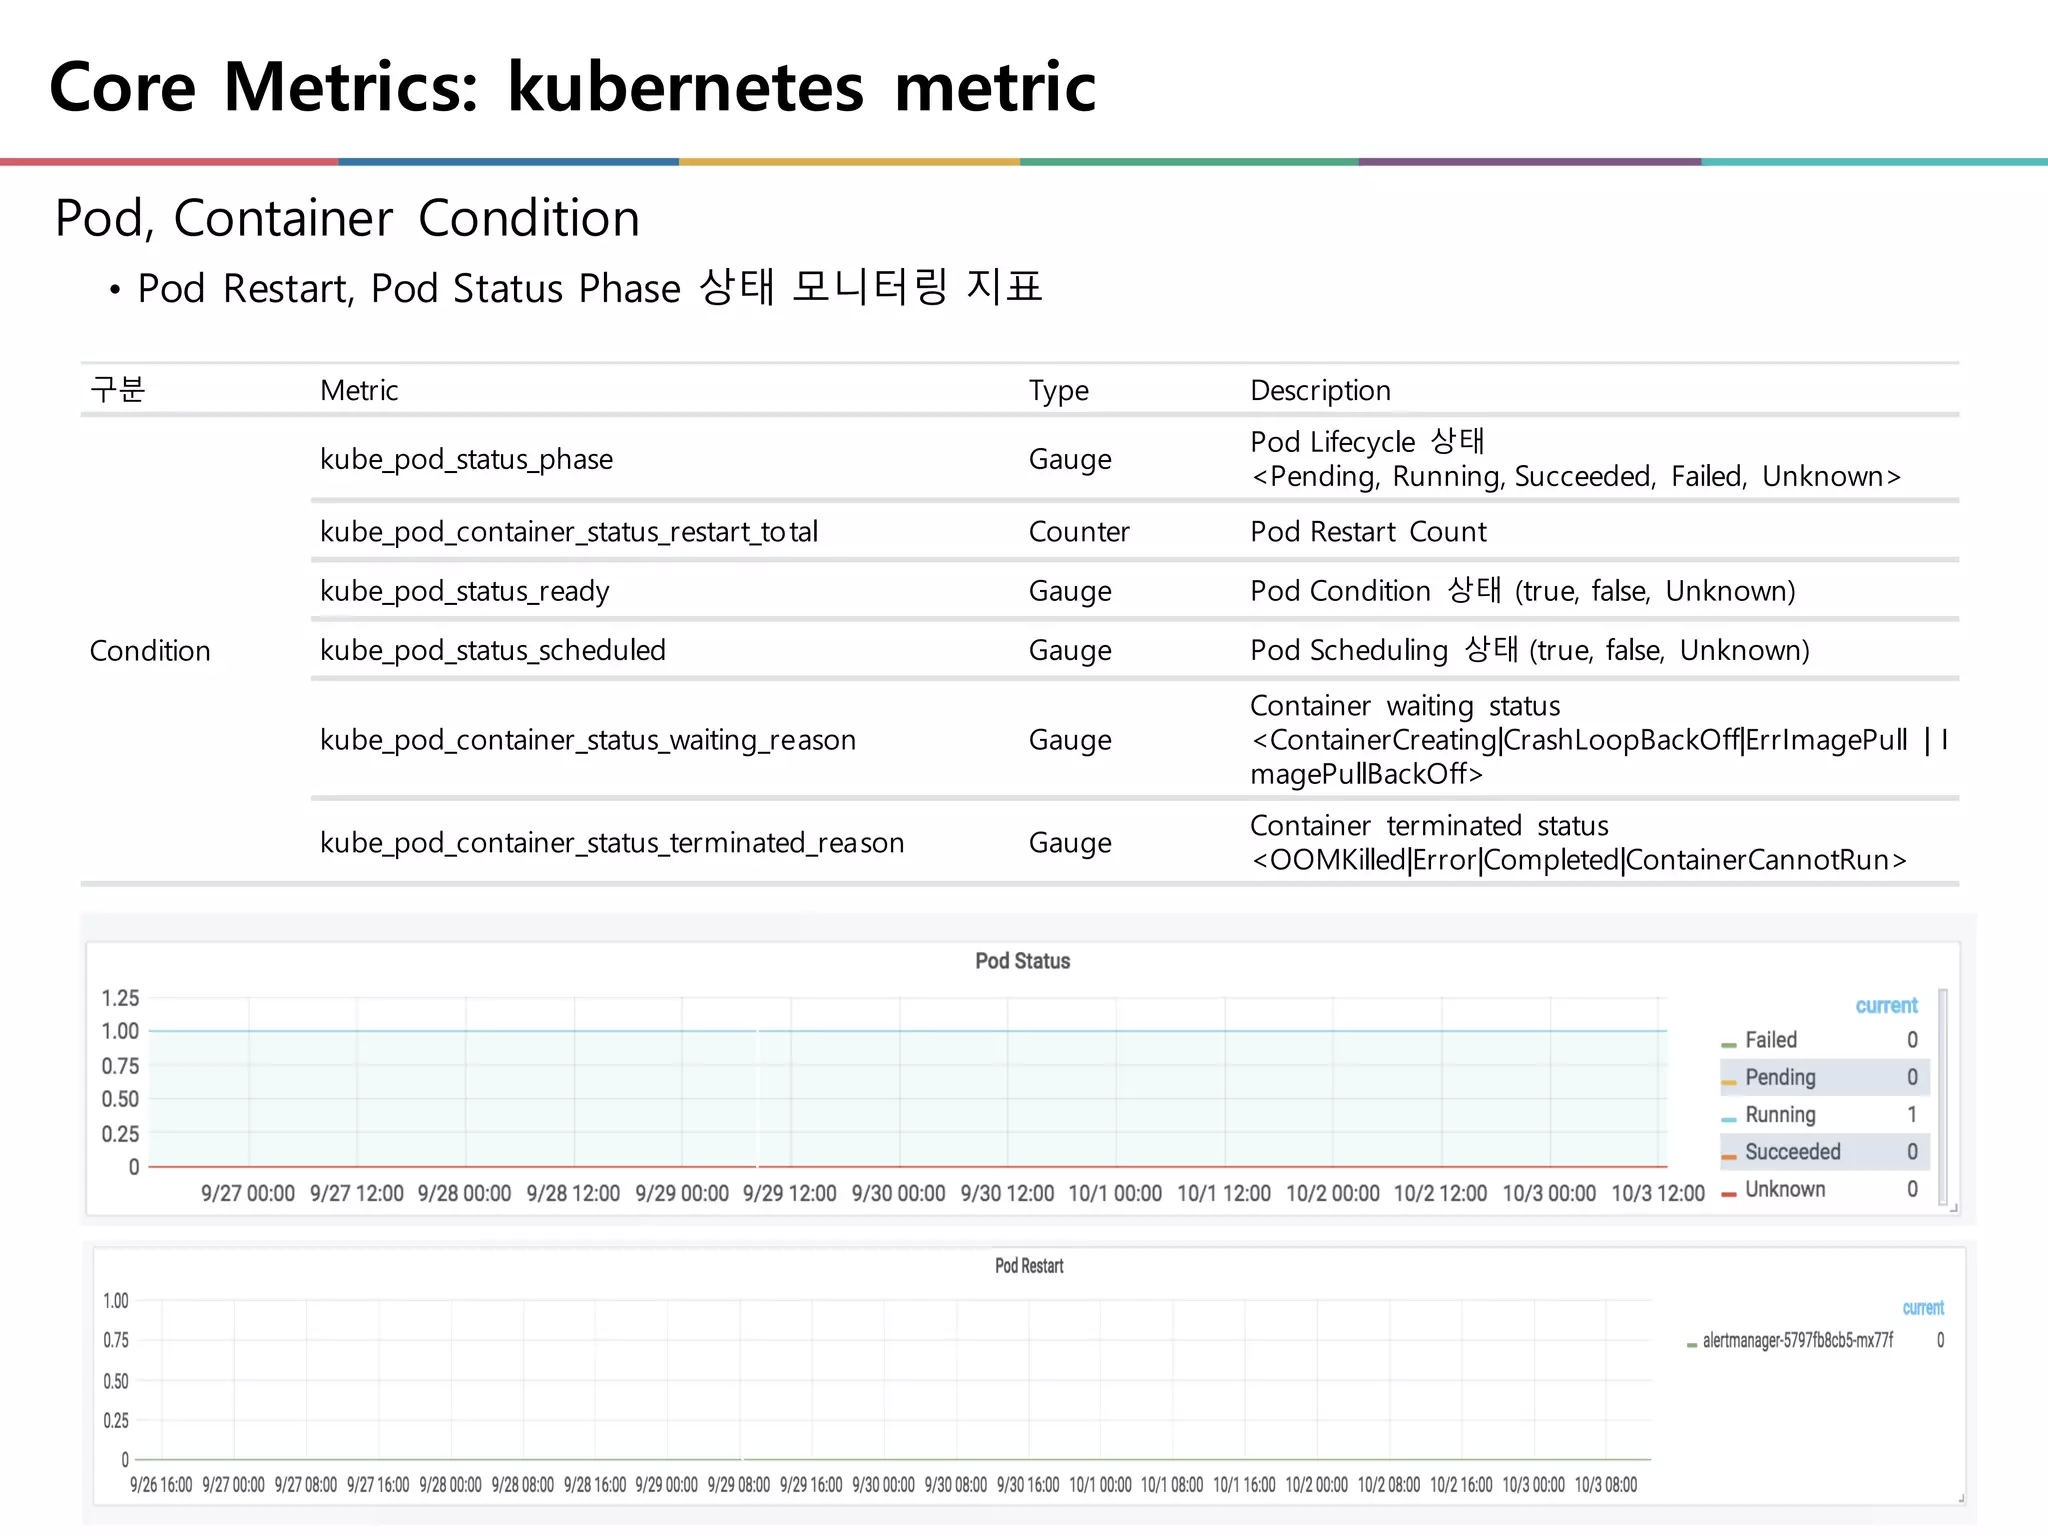
Core Metrics: kubernetesmetric
Pod, Container Condition
• Pod Restart, Pod Status Phase 상태 모니터링 지표
구분 Metric Type Description
Condition
kube_pod_status_phase Gauge
Pod Lifecycle 상태
<Pending, Running, Succeeded, Failed, Unknown>
kube_pod_container_status_restart_total Counter Pod Restart Count
kube_pod_status_ready Gauge Pod Condition 상태 (true, false, Unknown)
kube_pod_status_scheduled Gauge Pod Scheduling 상태 (true, false, Unknown)
kube_pod_container_status_waiting_reason Gauge
Container waiting status
<ContainerCreating|CrashLoopBackOff|ErrImagePull | I
magePullBackOff>
kube_pod_container_status_terminated_reason Gauge
Container terminated status
<OOMKilled|Error|Completed|ContainerCannotRun>
27.
Core Metrics: kubernetesmetric
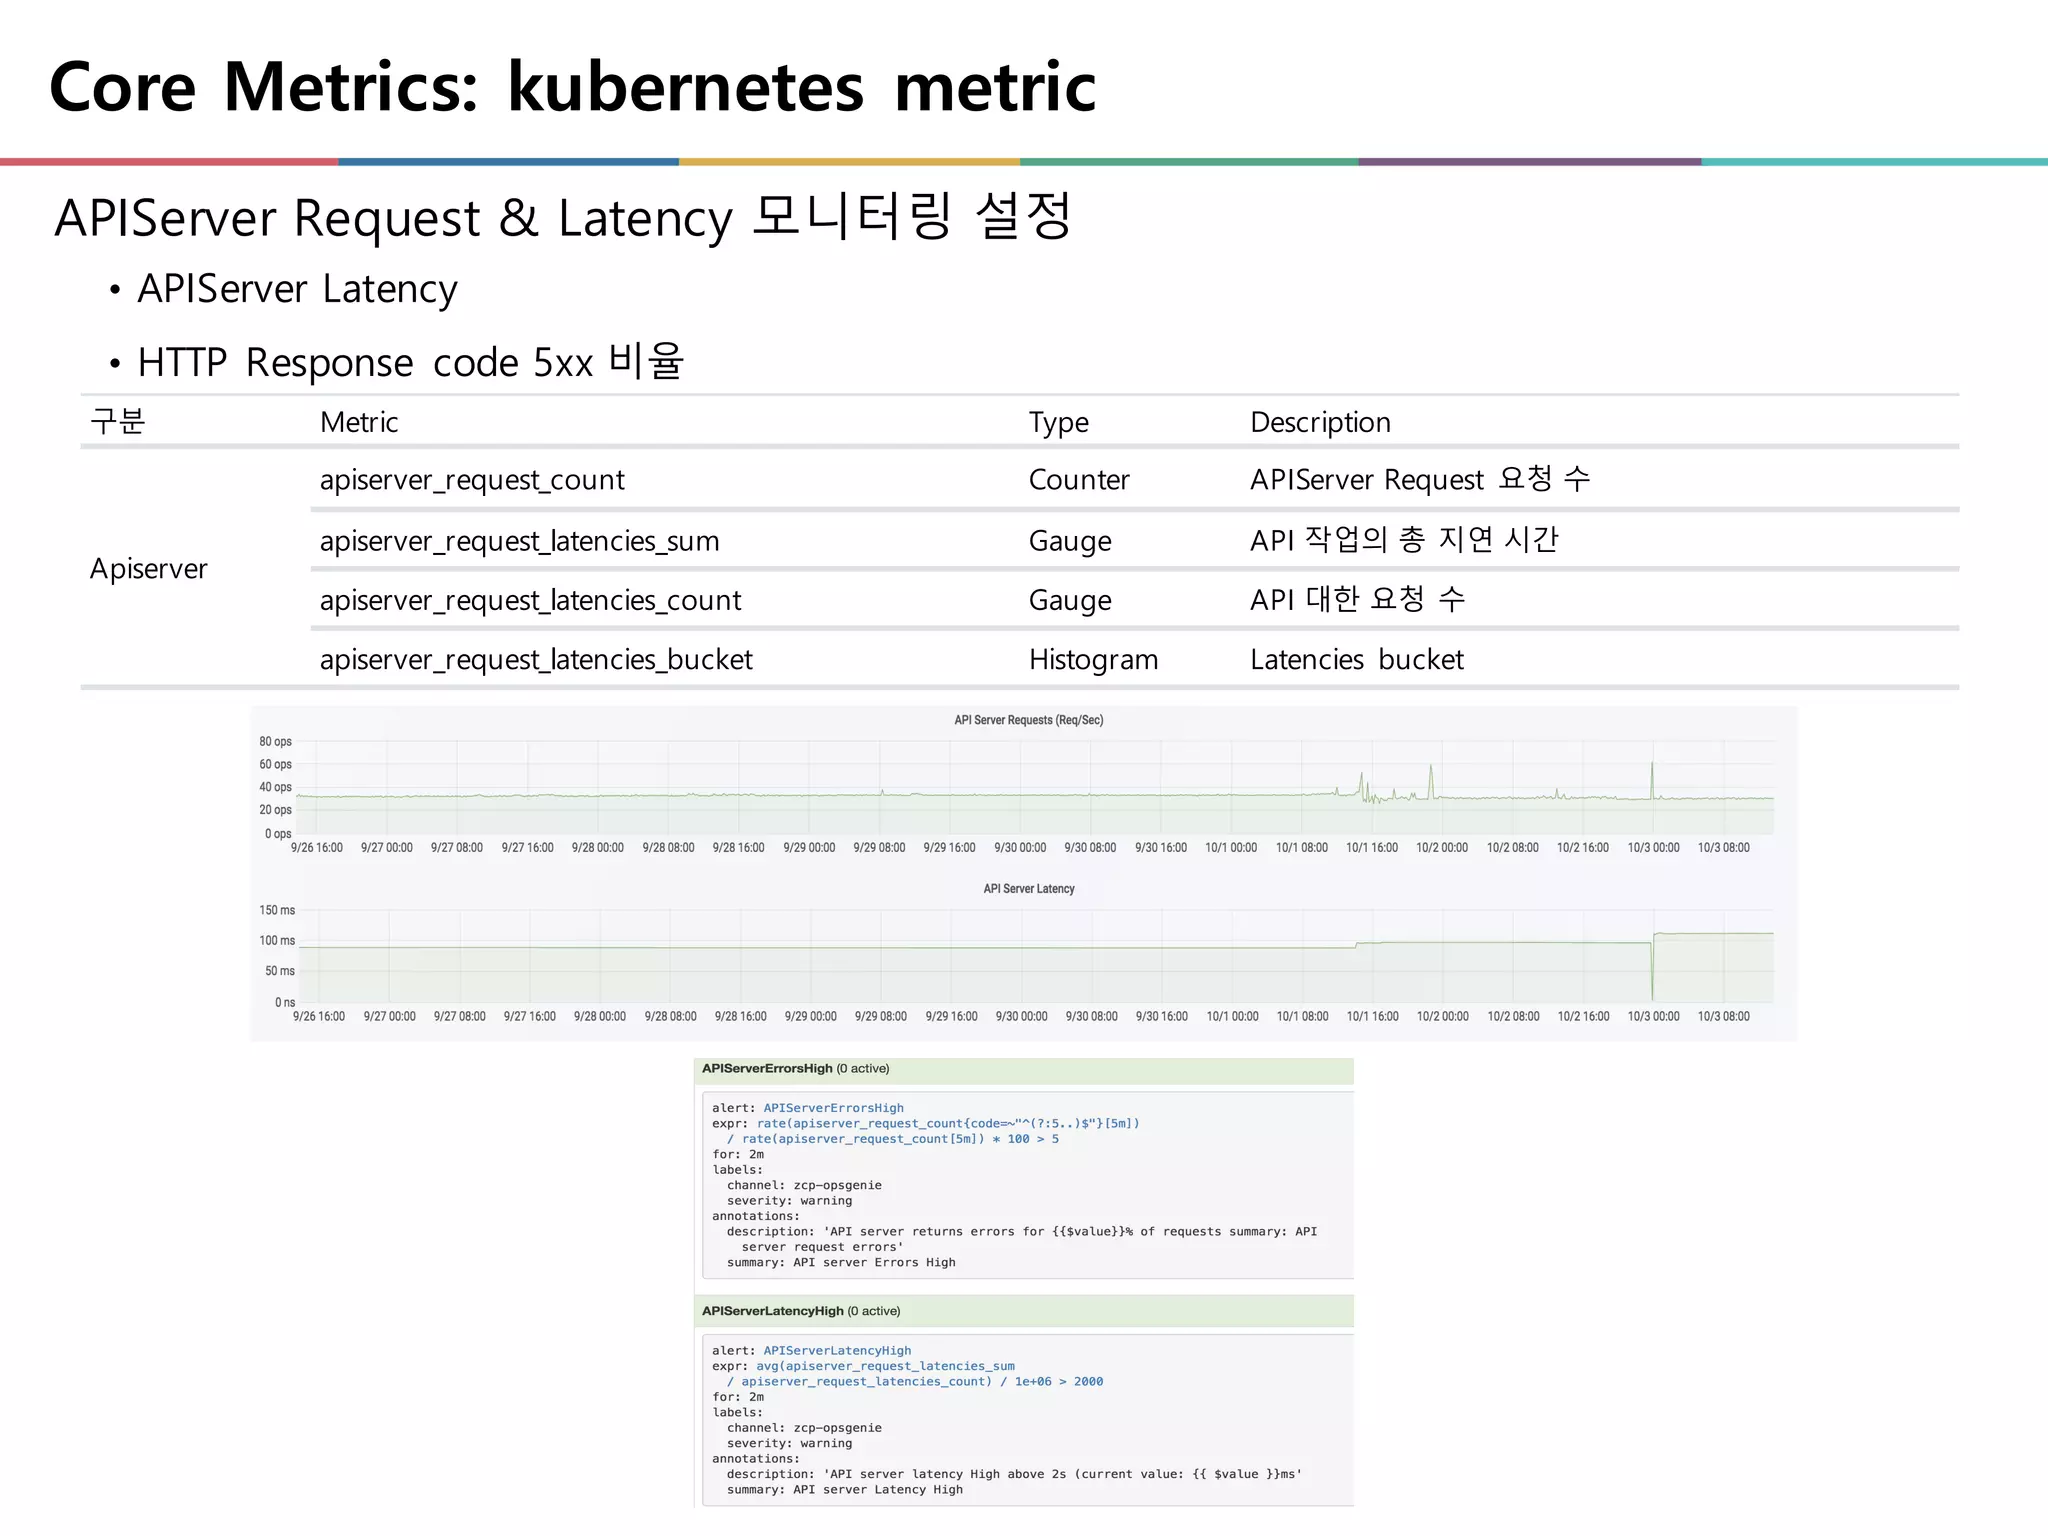
APIServer Request & Latency 모니터링 설정
• APIServer Latency
• HTTP Response code 5xx 비율
구분 Metric Type Description
Apiserver
apiserver_request_count Counter APIServer Request 요청 수
apiserver_request_latencies_sum Gauge API 작업의 총 지연 시간
apiserver_request_latencies_count Gauge API 대한 요청 수
apiserver_request_latencies_bucket Histogram Latencies bucket
28.
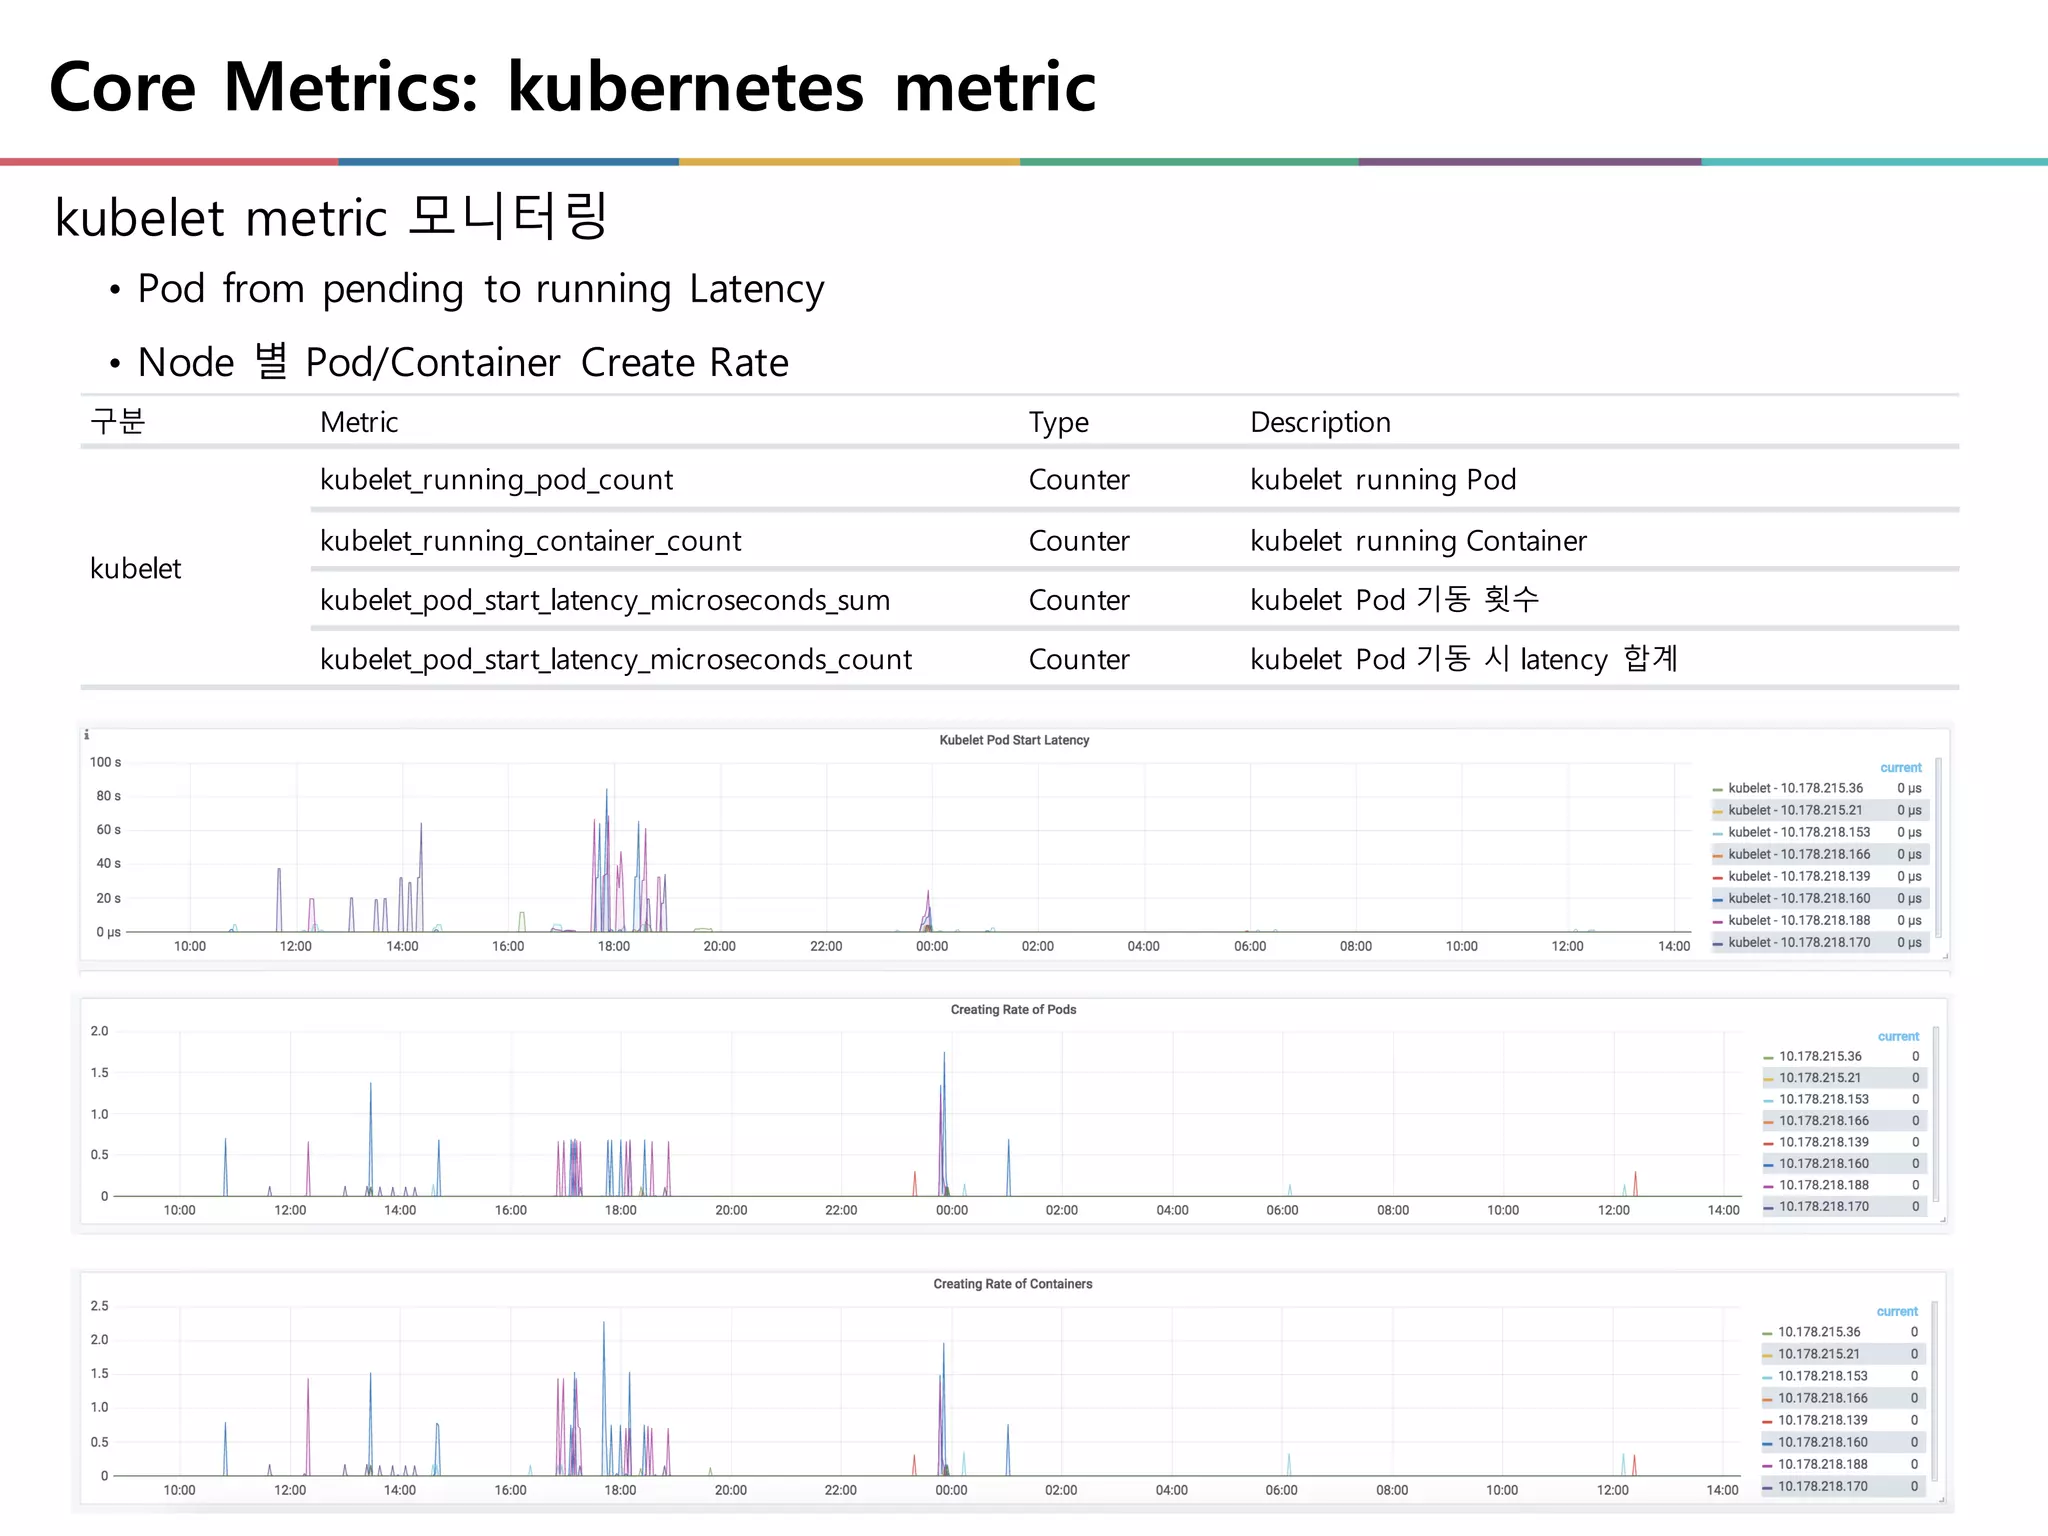
Core Metrics: kubernetesmetric
kubelet metric 모니터링
• Pod from pending to running Latency
• Node 별 Pod/Container Create Rate
구분 Metric Type Description
kubelet
kubelet_running_pod_count Counter kubelet running Pod
kubelet_running_container_count Counter kubelet running Container
kubelet_pod_start_latency_microseconds_sum Counter kubelet Pod 기동 횟수
kubelet_pod_start_latency_microseconds_count Counter kubelet Pod 기동 시 latency 합계
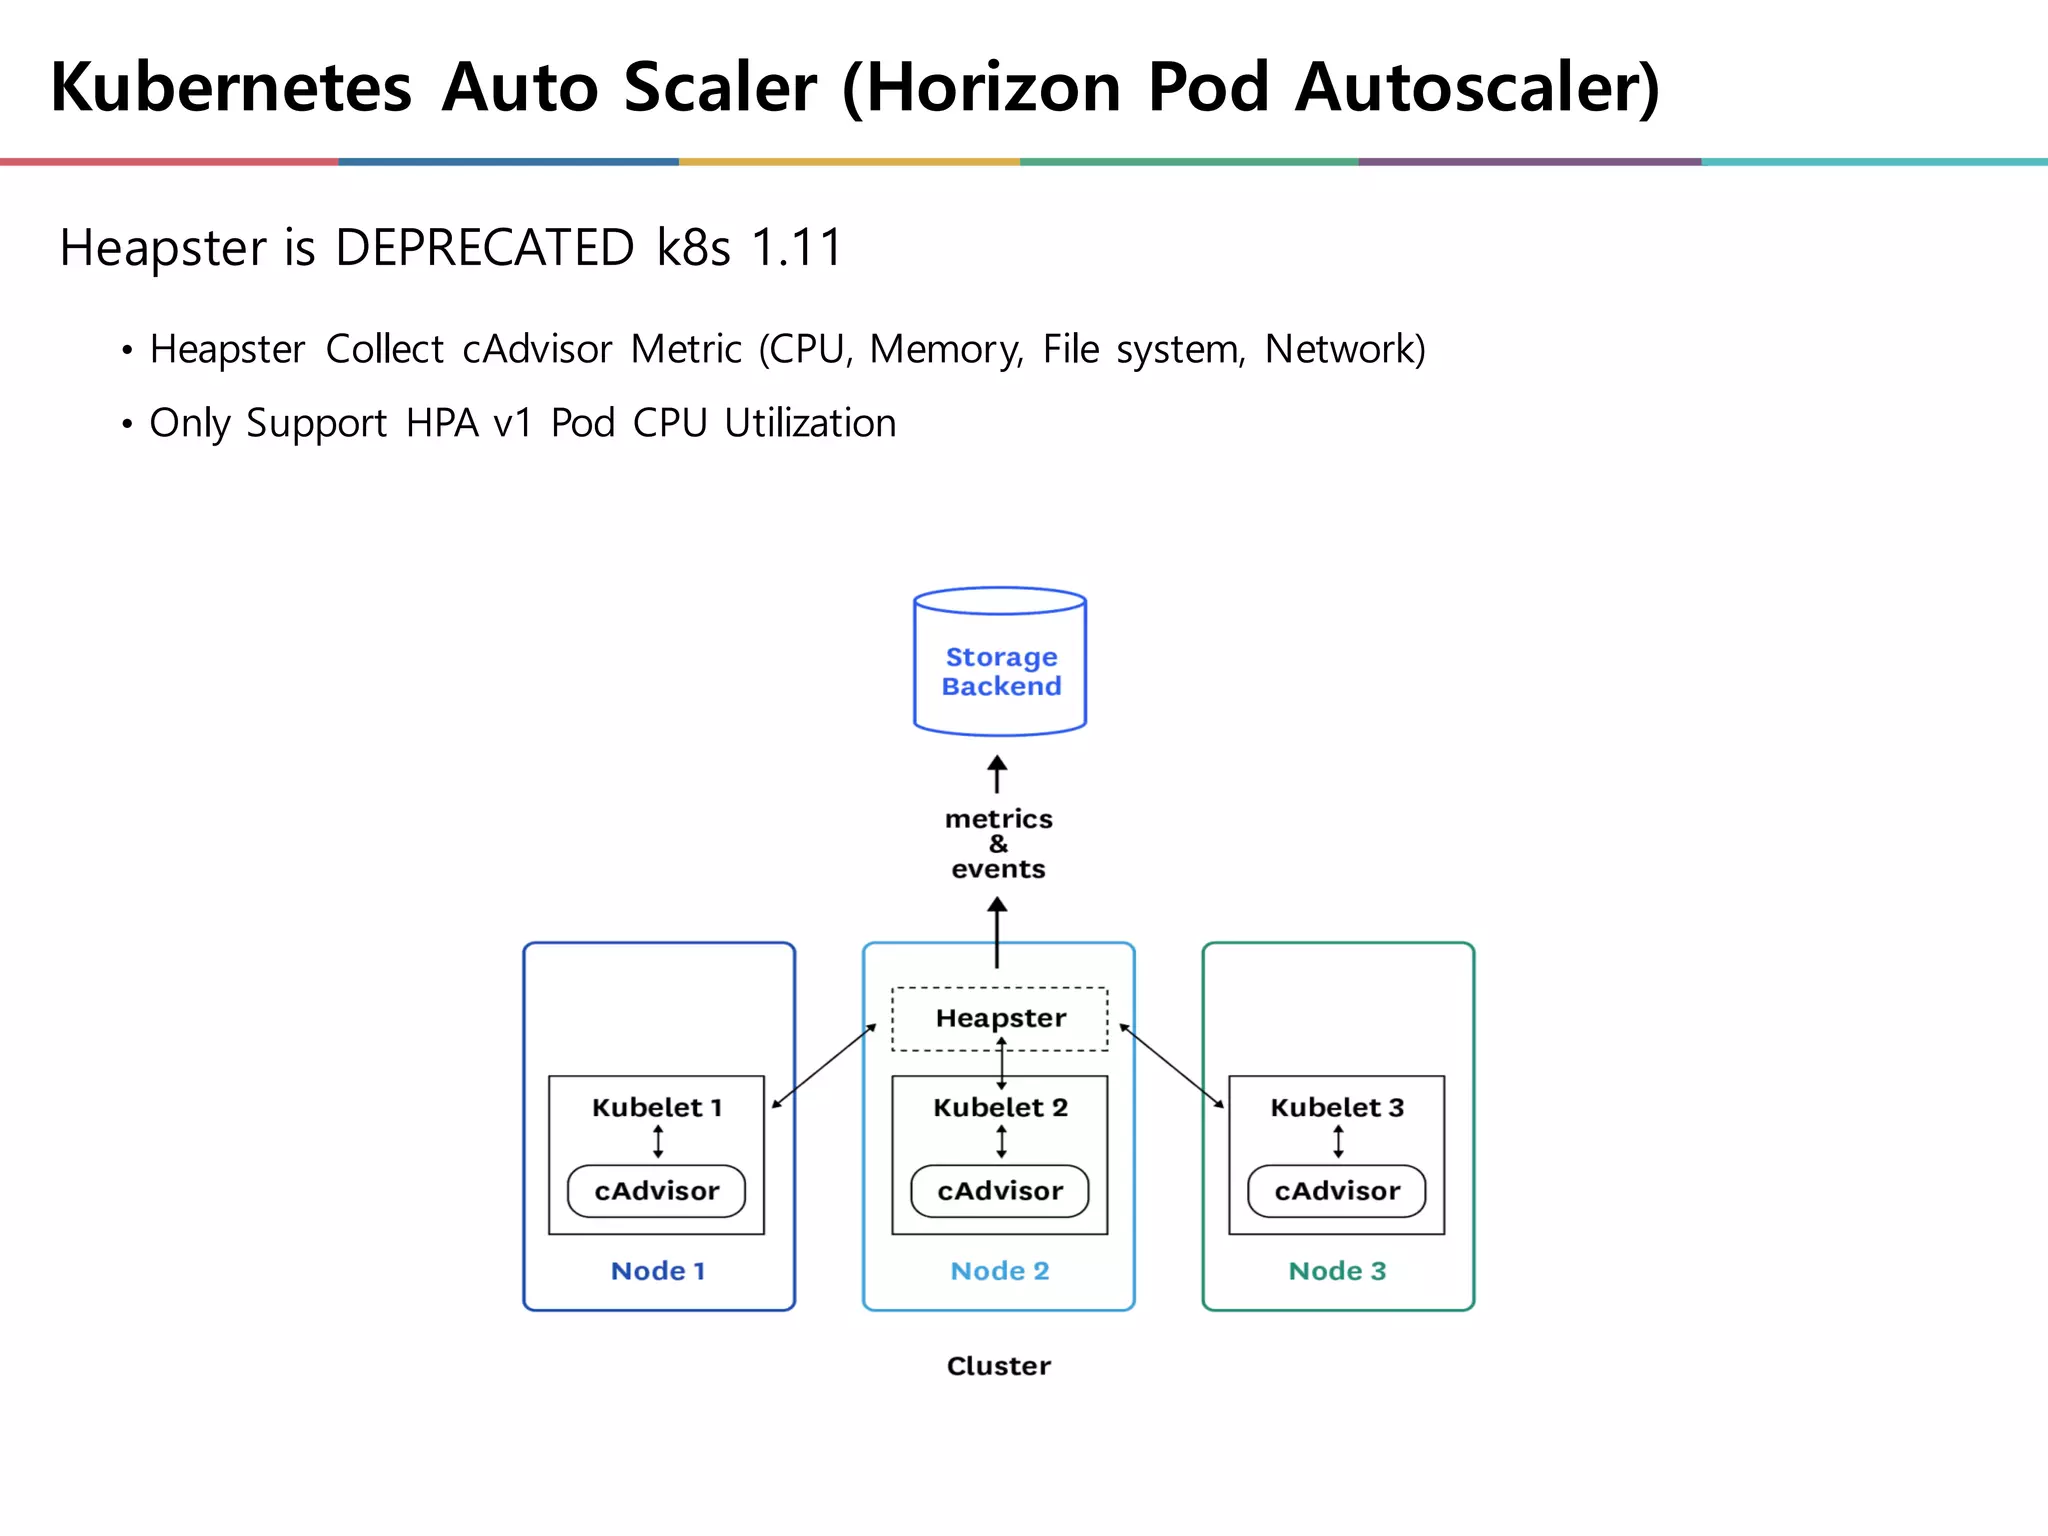
Kubernetes Auto Scaler(Horizon Pod Autoscaler)
• Heapster Collect cAdvisor Metric (CPU, Memory, File system, Network)
• Only Support HPA v1 Pod CPU Utilization
Heapster is DEPRECATED k8s 1.11
31.
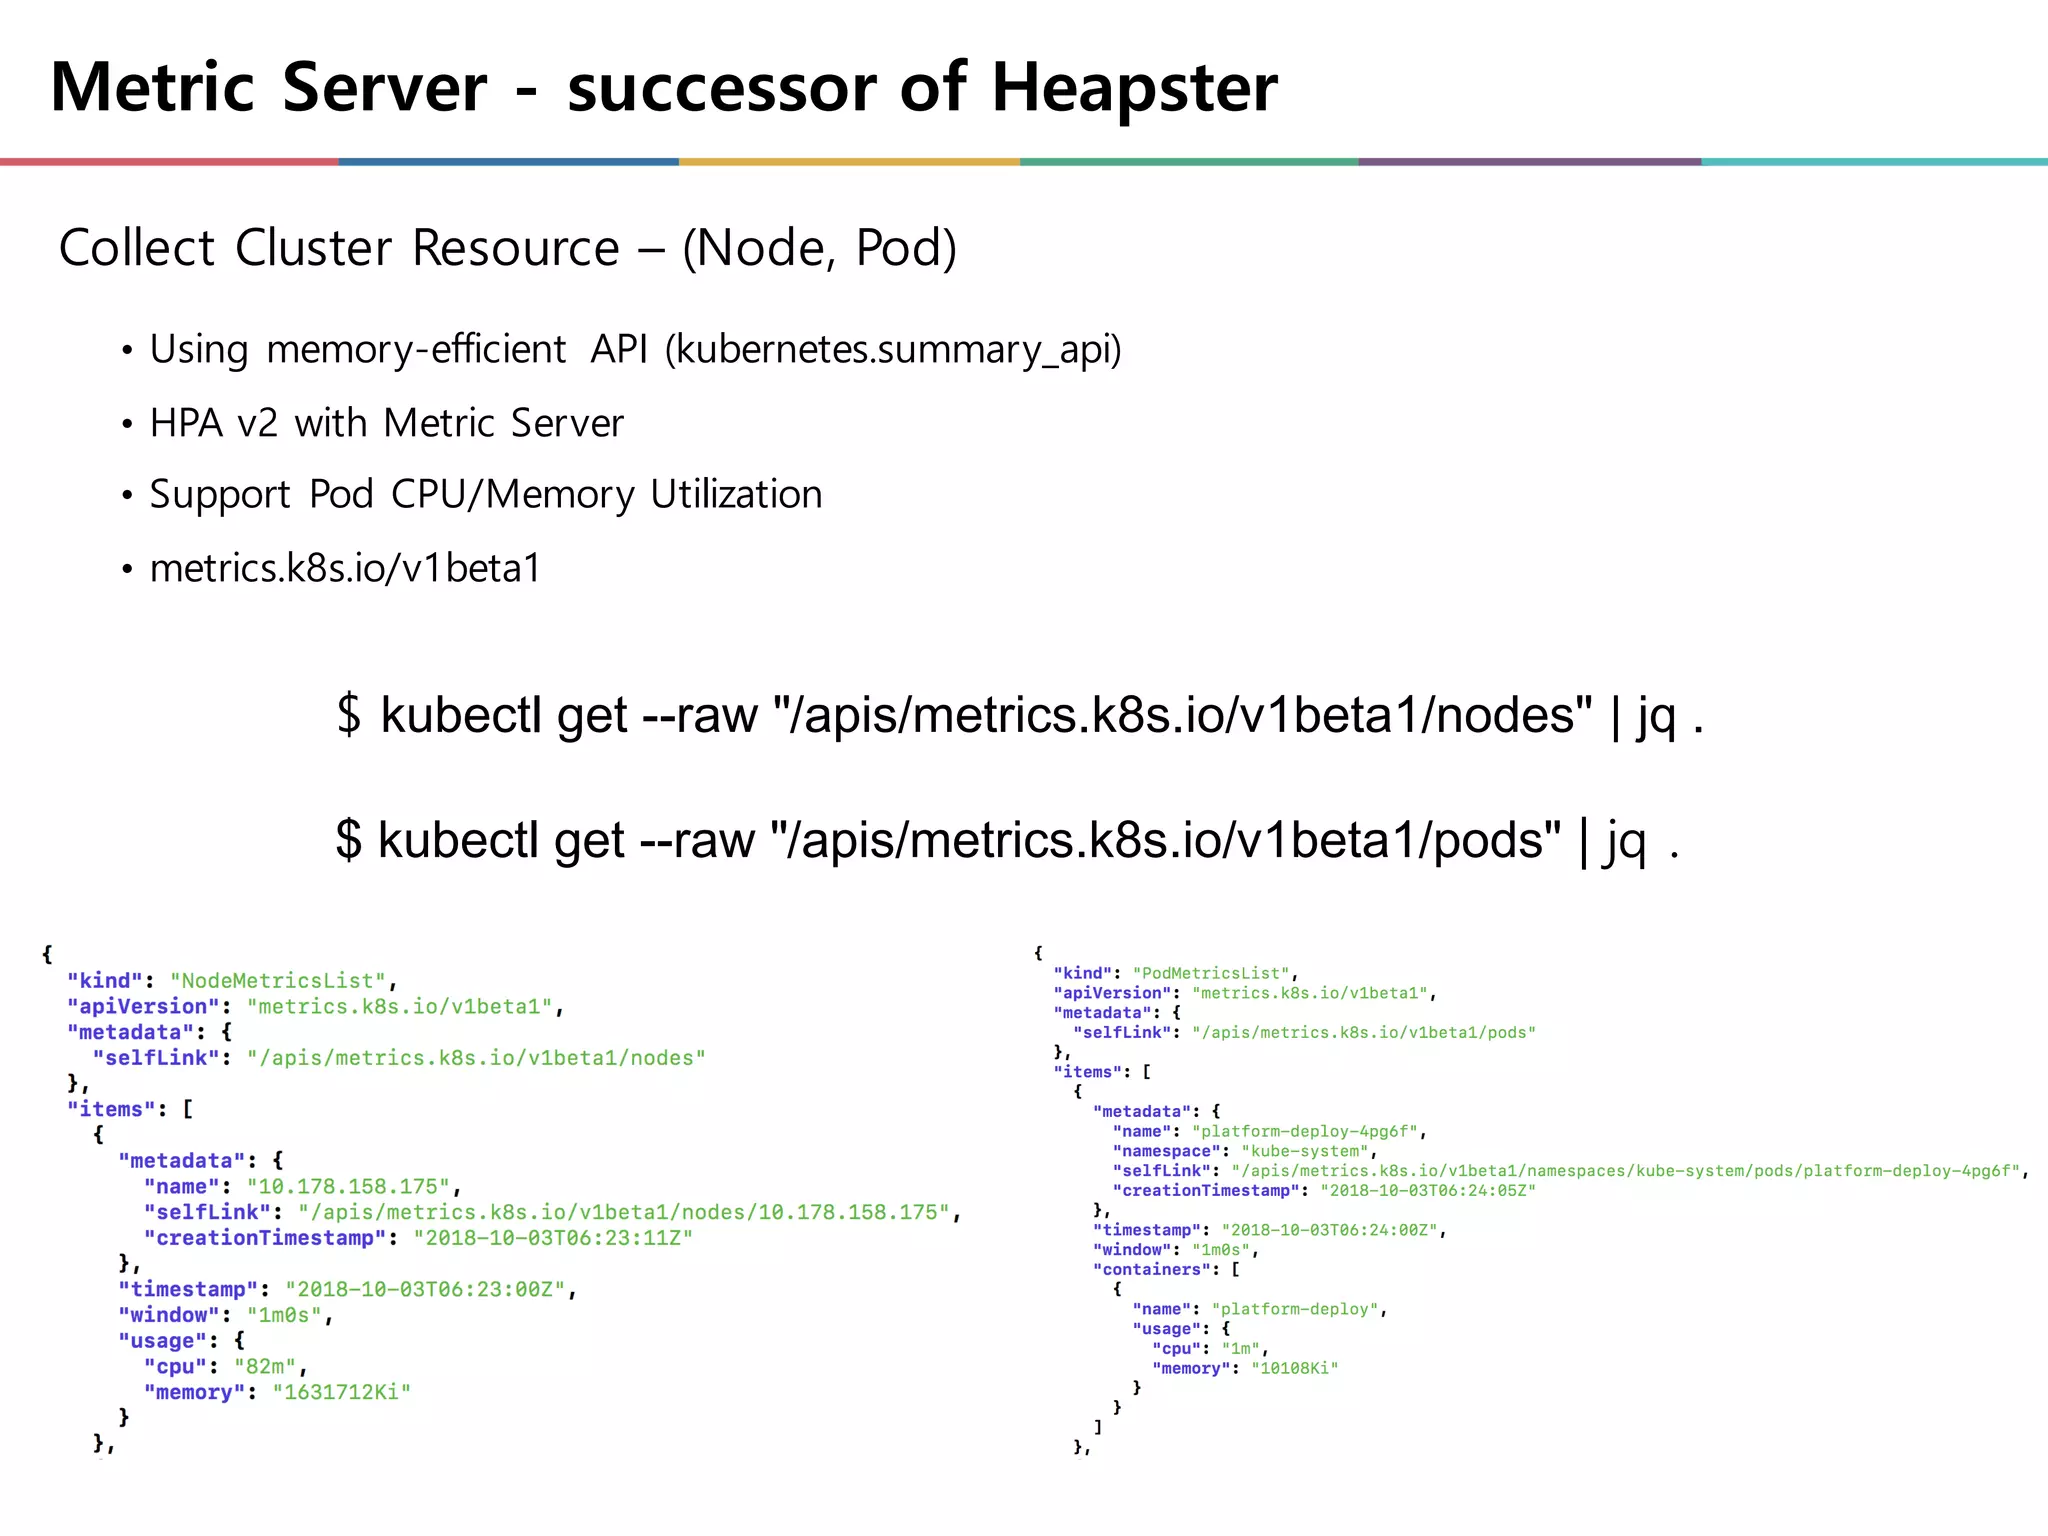
Metric Server -successor of Heapster
• Using memory-efficient API (kubernetes.summary_api)
• HPA v2 with Metric Server
• Support Pod CPU/Memory Utilization
• metrics.k8s.io/v1beta1
Collect Cluster Resource – (Node, Pod)
$ kubectl get --raw "/apis/metrics.k8s.io/v1beta1/nodes" | jq .
$ kubectl get --raw "/apis/metrics.k8s.io/v1beta1/pods" | jq .
32.
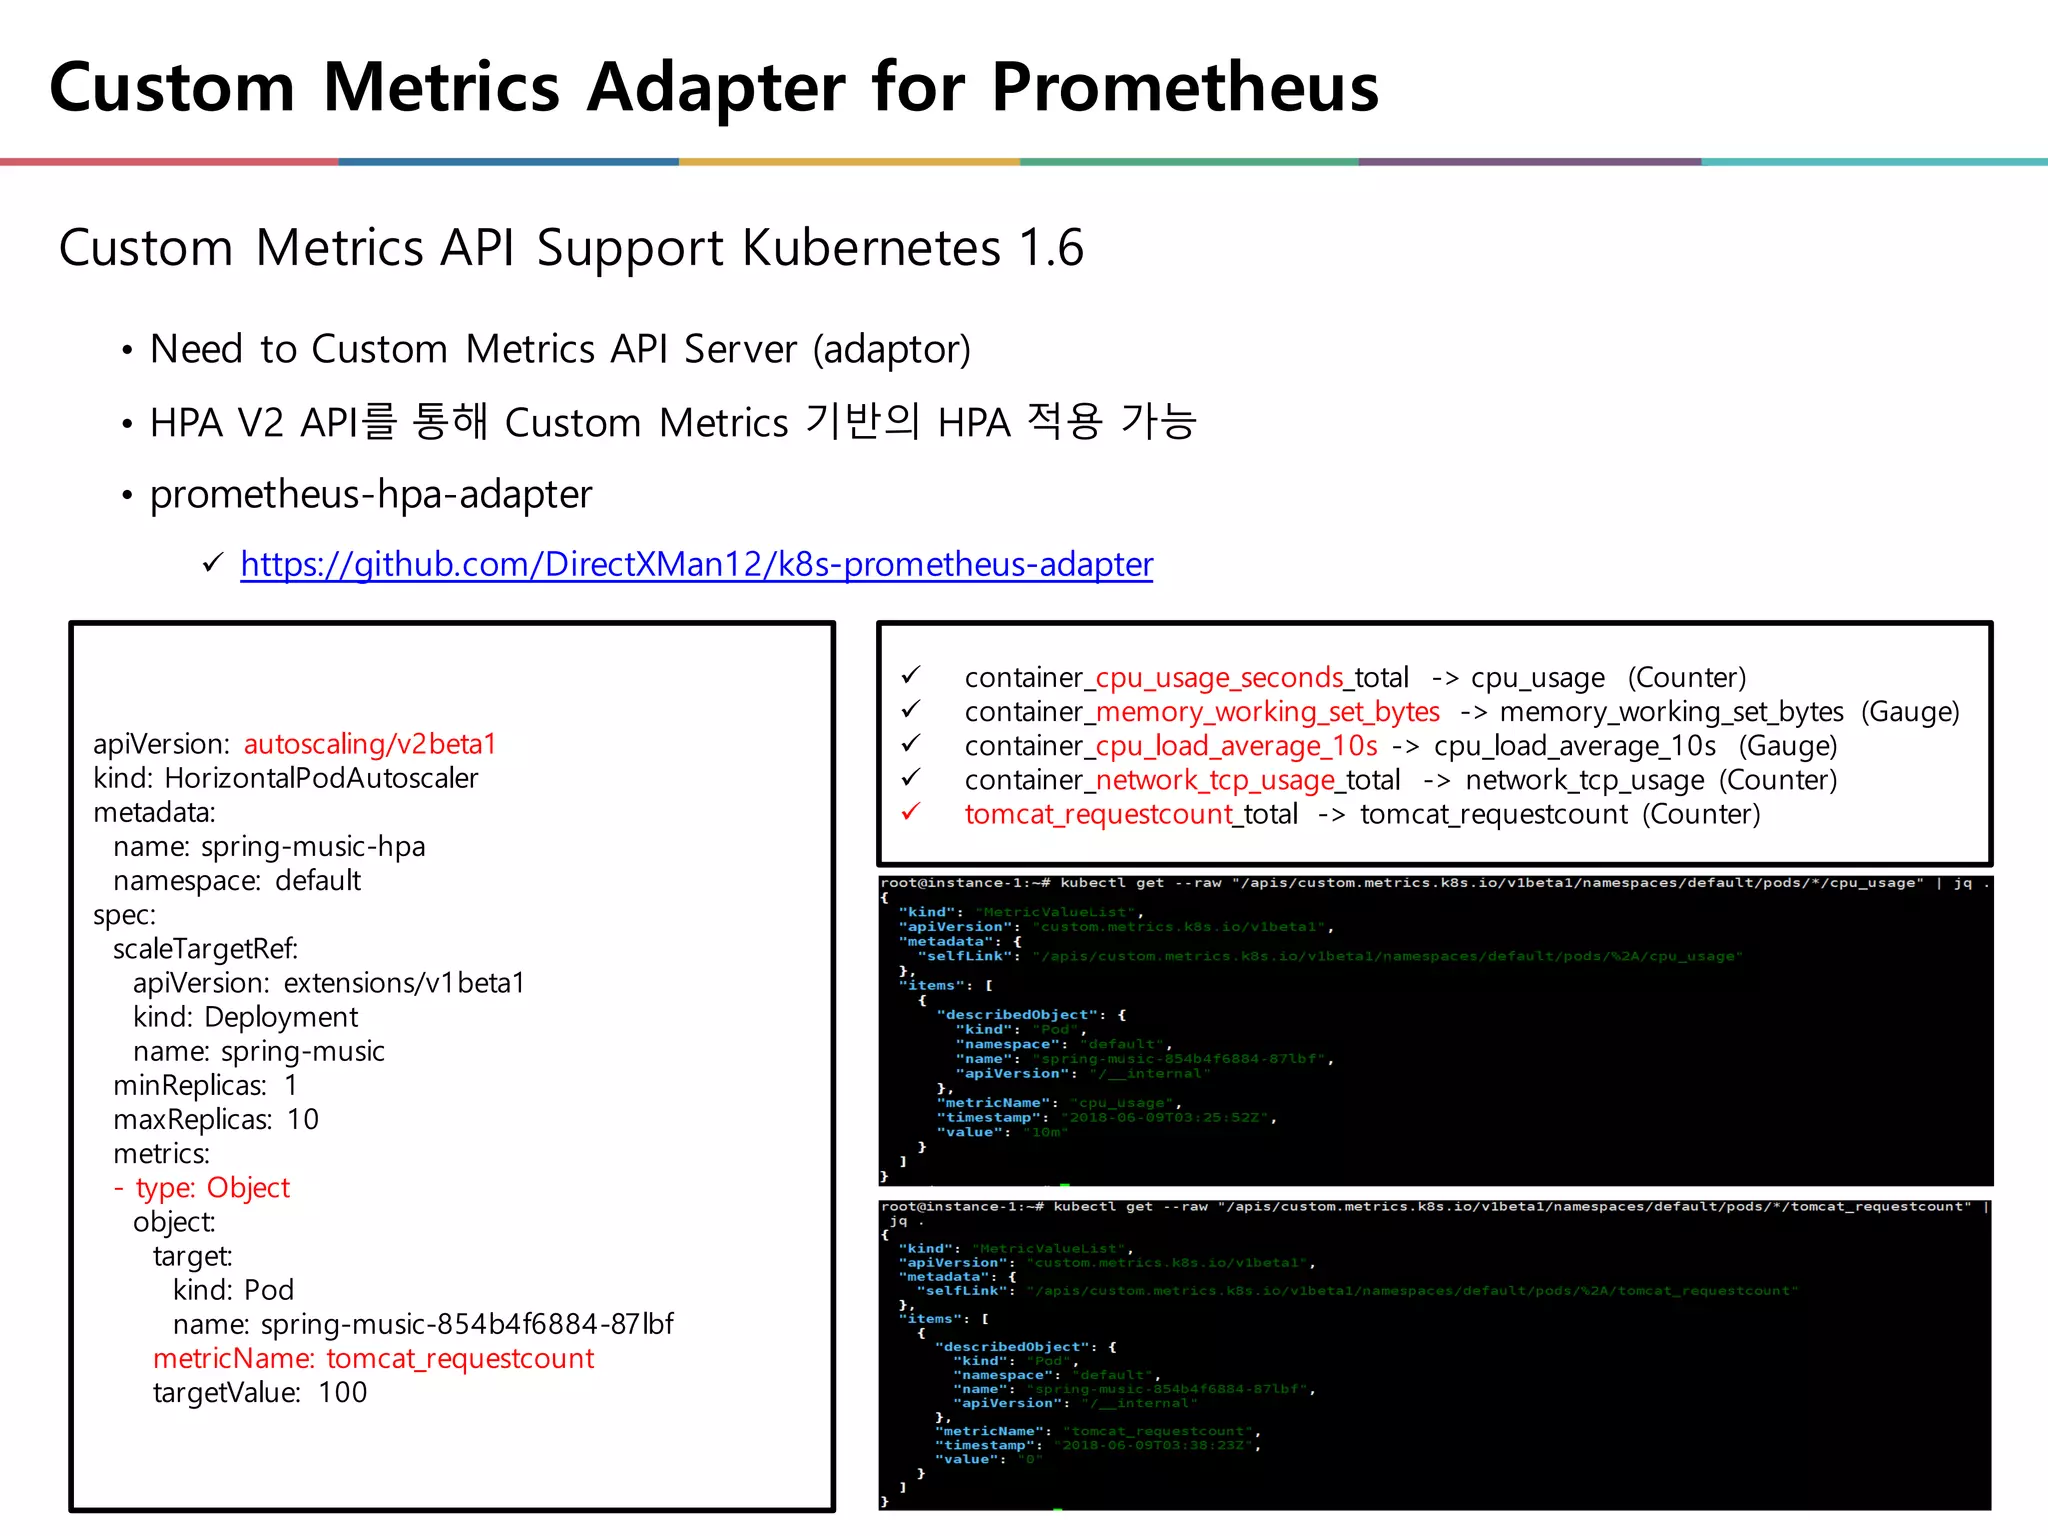
Custom Metrics Adapterfor Prometheus
• Need to Custom Metrics API Server (adaptor)
• HPA V2 API를 통해 Custom Metrics 기반의 HPA 적용 가능
• prometheus-hpa-adapter
ü https://github.com/DirectXMan12/k8s-prometheus-adapter
Custom Metrics API Support Kubernetes 1.6
ü container_cpu_usage_seconds_total -> cpu_usage (Counter)
ü container_memory_working_set_bytes -> memory_working_set_bytes (Gauge)
ü container_cpu_load_average_10s -> cpu_load_average_10s (Gauge)
ü container_network_tcp_usage_total -> network_tcp_usage (Counter)
ü tomcat_requestcount_total -> tomcat_requestcount (Counter)
apiVersion: autoscaling/v2beta1
kind: HorizontalPodAutoscaler
metadata:
name: spring-music-hpa
namespace: default
spec:
scaleTargetRef:
apiVersion: extensions/v1beta1
kind: Deployment
name: spring-music
minReplicas: 1
maxReplicas: 10
metrics:
- type: Object
object:
target:
kind: Pod
name: spring-music-854b4f6884-87lbf
metricName: tomcat_requestcount
targetValue: 100
33.
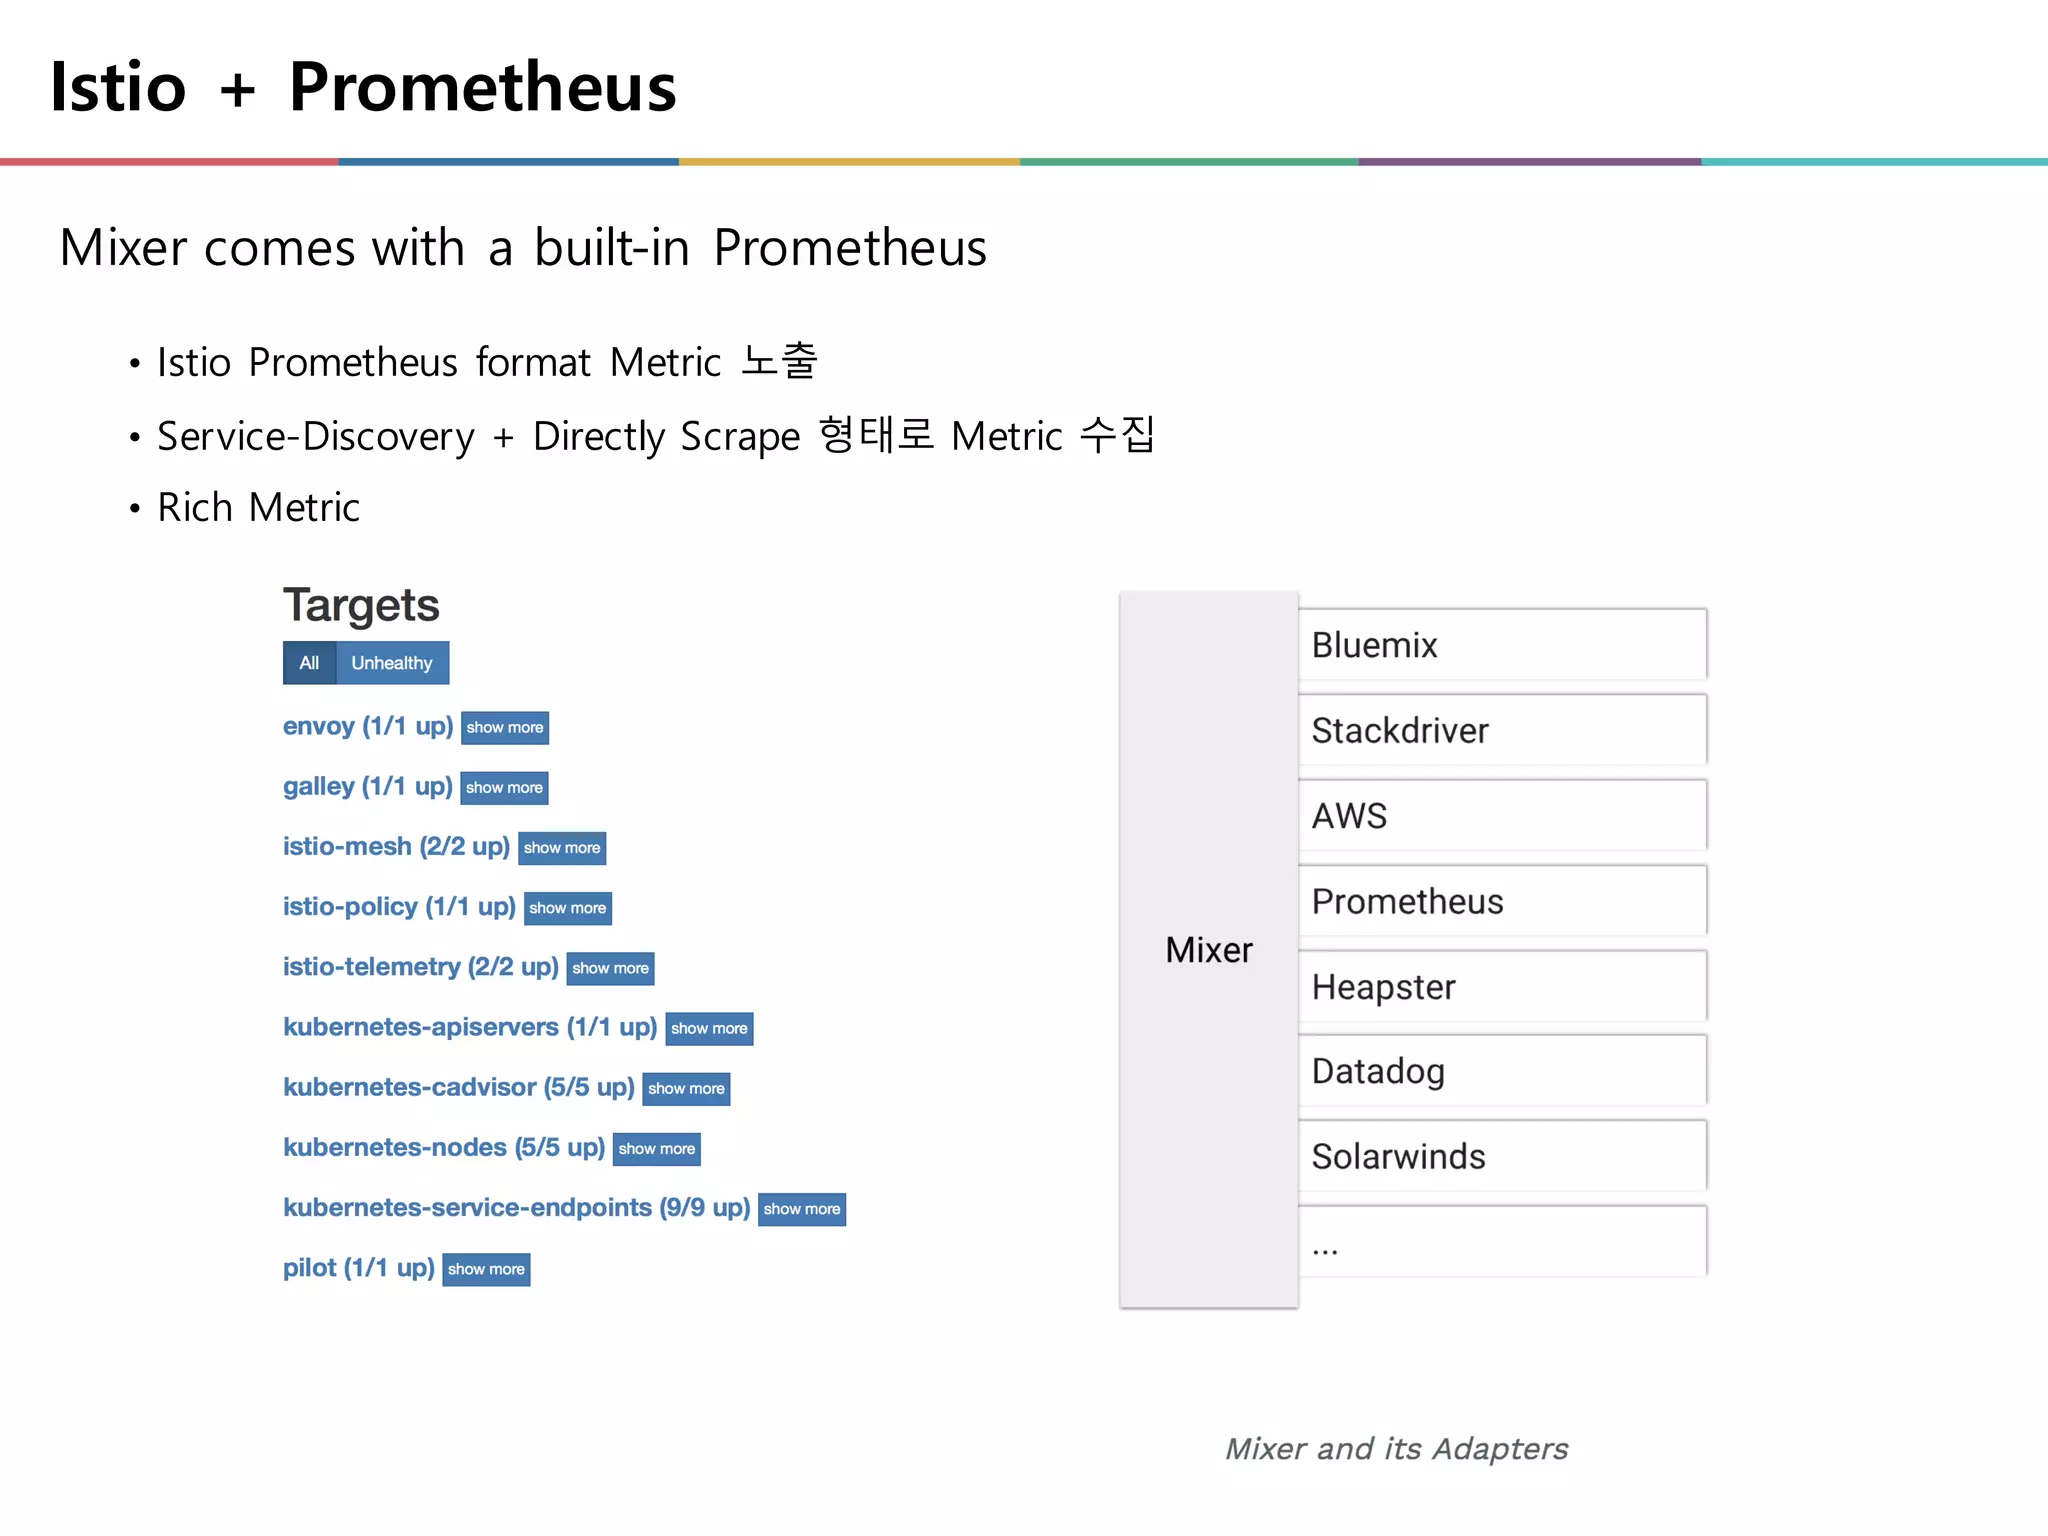
Istio + Prometheus
•Istio Prometheus format Metric 노출
• Service-Discovery + Directly Scrape 형태로 Metric 수집
• Rich Metric
Mixer comes with a built-in Prometheus
34.
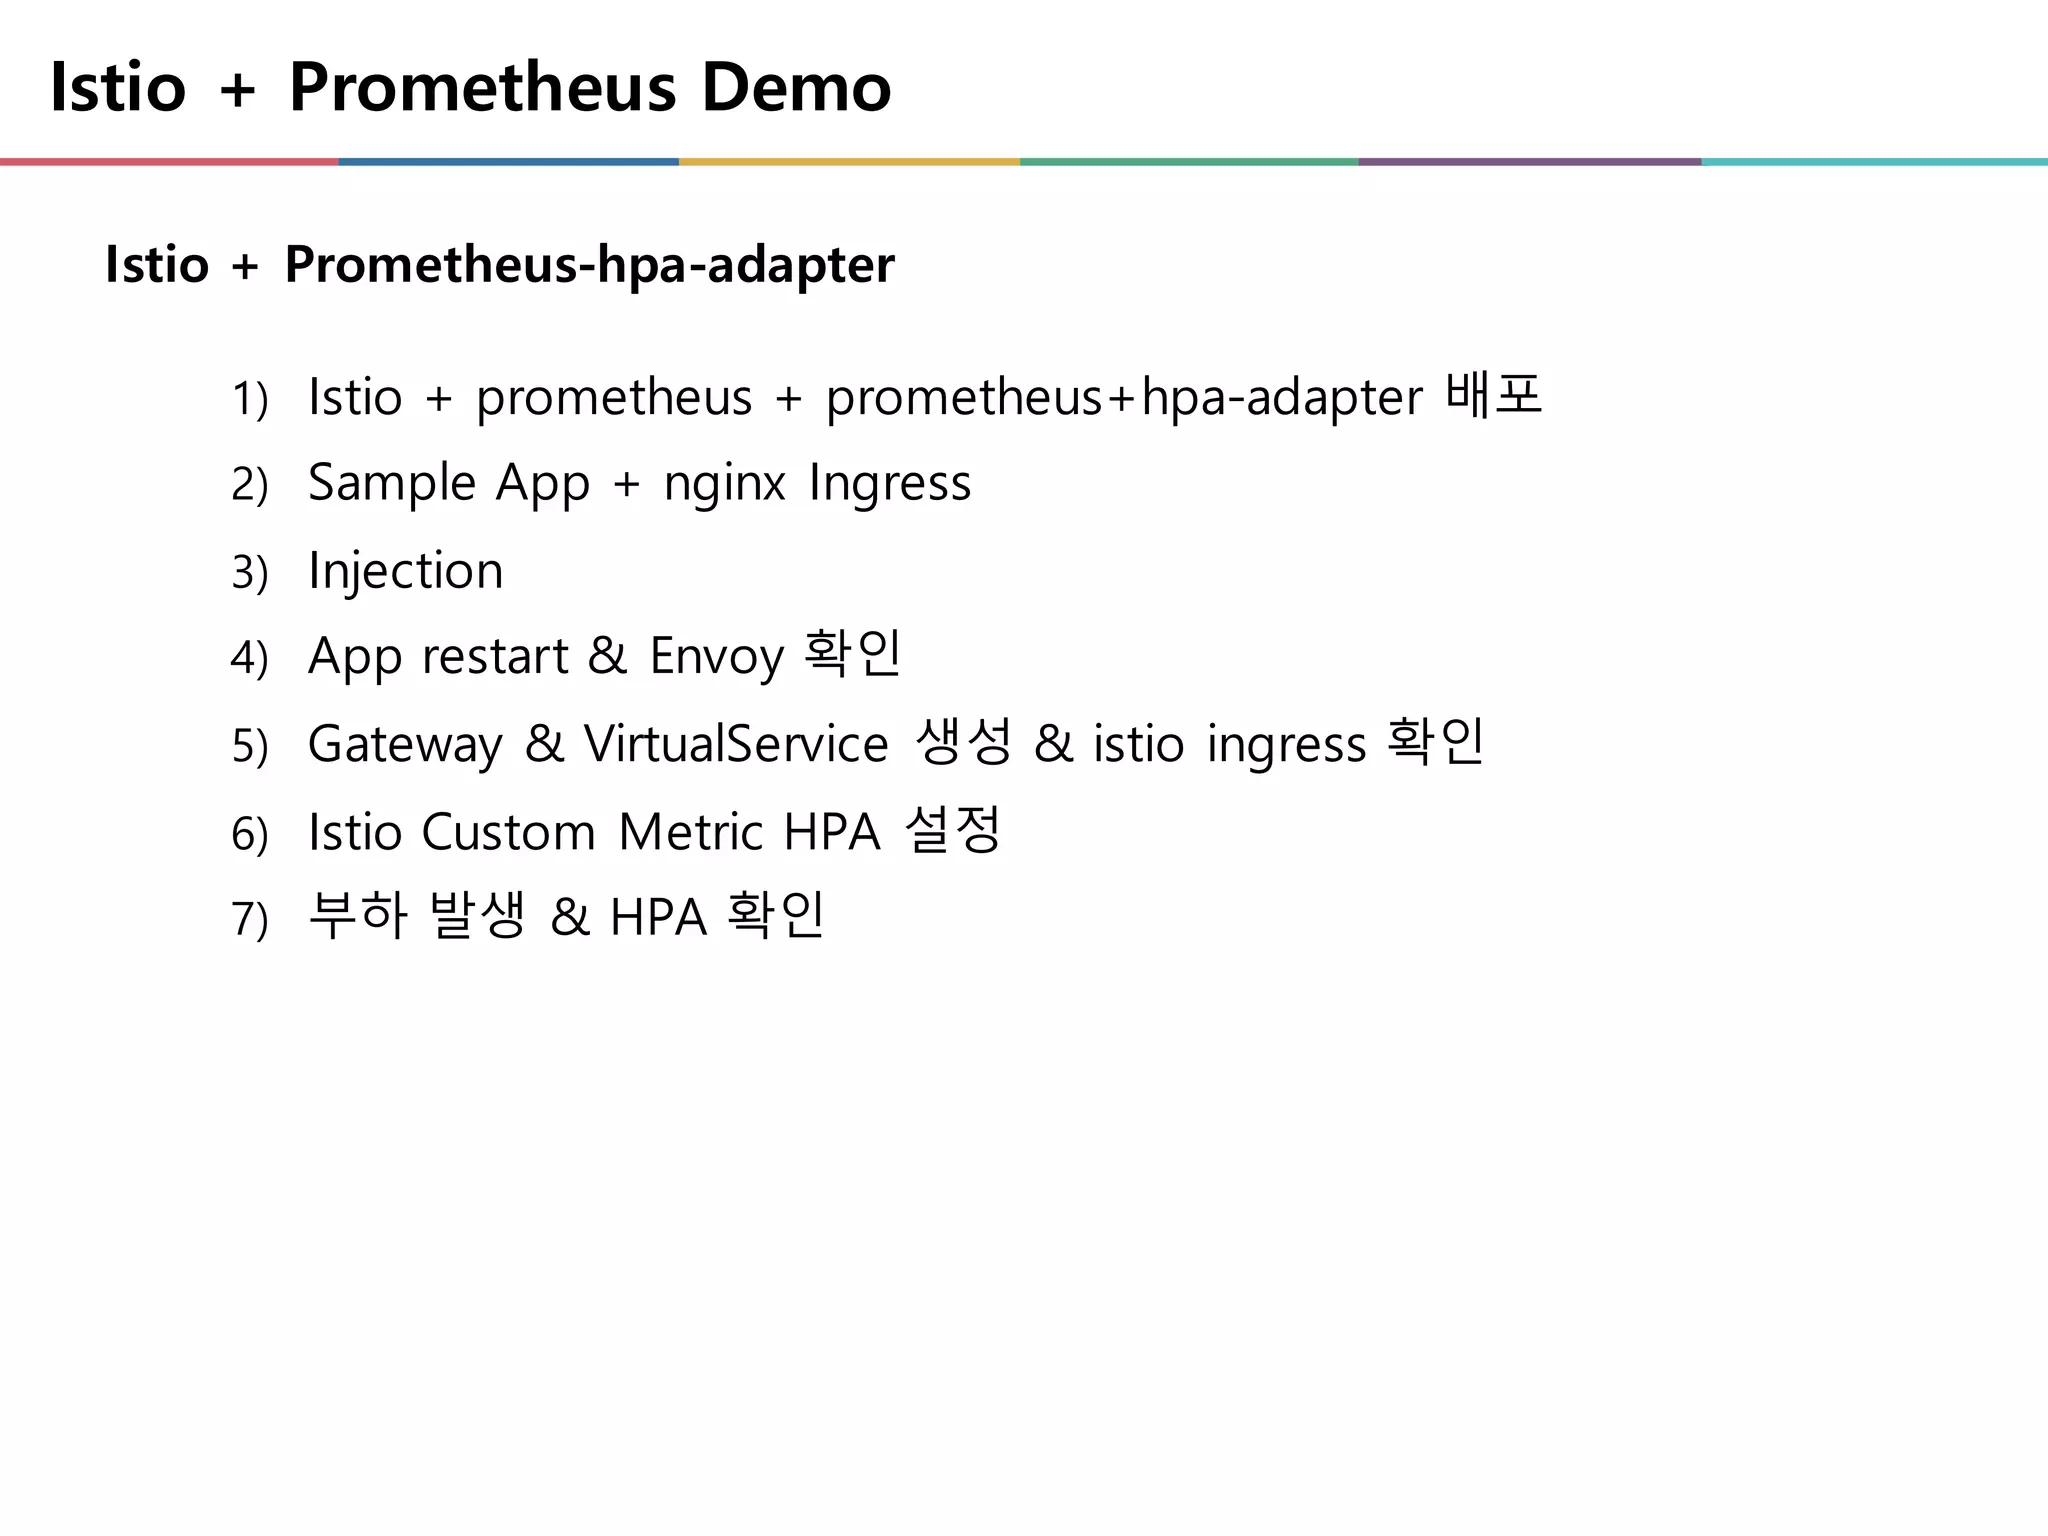
Istio + PrometheusDemo
1) Istio + prometheus + prometheus+hpa-adapter 배포
2) Sample App + nginx Ingress
3) Injection
4) App restart & Envoy 확인
5) Gateway & VirtualService 생성 & istio ingress 확인
6) Istio Custom Metric HPA 설정
7) 부하 발생 & HPA 확인
Istio + Prometheus-hpa-adapter
![Prometheus Alerting & Alertmanager
Prometheus & Alertmanager 간 Alert Rule & Notification 연계 기능 제공
Alertmanager
Prometheus
Alert Rules
Prometheus
Alert Rules
• Alert Rules setting
• Alert Trigger
Prometheus
• Notification Channel Integration
• Send to Notification Channel
• Alert De-Duplication
• Alert Routing
• Silence
Alertmanager
- name: node.rules
rules:
- alert: NodeCPUUsage
expr: (100 - avg by (instance,mode) (irate(node_cpu_seconds_total{mode="idle"}[1m])) * 100) > 75
for: 2m
labels:
severity: warning
annotations:
message: CPU Usage HIGH
ü node_alerts.rules](https://image.slidesharecdn.com/kuberneteswithprometheusmonitoring-181005042628/75/kubernetes-Prometheus-Monitoring-9-2048.jpg)
![Native Monitoring
1) Kubernetes Components Metrics
• Host/Kubernetes/Container/Application 까지다양한Metric 수집
ü All Components Expose Metrics (/metrics) + kube-state-metrics(exporter)
ü Ready to Monitoring with Prometheus
etcd
cluster
K-V Store
K8S Master
Kube-apiserver
Kube-scheduler
…
Kube-contoller-manager
K8S Master
kube-apiserver
kube-scheduler
…
kube-contoller-manager
K8S Worker Node
kubelet
kube-proxy
node exporter cAdvisor
POD
POD
kubelet
kube-proxy
node exporter cAdvisor
POD
POD
kubelet
kube-proxy
node exporter cAdvisor
POD
POD
Prometheus
kube-state-metri
cs
Grafana
Alertmanager
① k8s Service Discovery
② Pull component metric
Target Endpoint
kube-apiservers https://[Master]:443/metrics
kube-contoller-manager https://[Master]:10252/metrics
kube-scheduler https://[Master]:10251/metrics
kubelet https://[Master]:10250/metrics
etcd https://[Master]:2379/metrics
cadvisor https://[ALL]:4194/metrics
Node Exporter https://[ALL]:9100/metrics
kube-state-metric
(exporter)
https://[kube-state-metric-
pod]:8080/metrics
[Target Config][Metric Scrape]](https://image.slidesharecdn.com/kuberneteswithprometheusmonitoring-181005042628/75/kubernetes-Prometheus-Monitoring-11-2048.jpg)

![Prometheus Type of Metrics
• Counter
ü cumulative Metric Type, suffix : [xxx]_total, reset to zero on restart
ü rate()/irate() 함수를 통해 변화량/추이 분석에 유리
ü CPU, Request Count, Error Count, Network Usage 등
Gauges, Counter, Histogram](https://image.slidesharecdn.com/kuberneteswithprometheusmonitoring-181005042628/75/kubernetes-Prometheus-Monitoring-16-2048.jpg)
![Prometheus Type of Metrics
• Histogram
ü 구간 별 데이터의 분포도 파악(Cumulative)
ü 데이터를 버킷으로 그룹화 - suffix : [xxx]_bucket
ü histogram_quantile() 함수를 통해 백분위 별 평균 집계에 용이
Gauges, Counter, Histogram](https://image.slidesharecdn.com/kuberneteswithprometheusmonitoring-181005042628/75/kubernetes-Prometheus-Monitoring-17-2048.jpg)
![Core Metrics: kubernetes node
• Physical machines (or VMs)
• Node-Exporter + DaemonSet 조합
ü prefix : node_[xxx]
Kubernetes All Node Level Metric 노출
구분 Metric Type Description
CPU node_cpu_seconds_total Count CPU Mode 별 점유 시간(per processor)
Load node_load1 / node_load5 /node_load15 Gauge System Load Average 1/5/15
Memory
node_memory_MemTotal
node_memory_MemeAvailable
node_memory_MemFree
node_memory_Buffers
node_memory_Cached
Gauge System Memory Information
Disk
node_filesystem_size
node_filesystem_avail
Gauge File System Info
node_disk_read_time_ms
node_disk_write_time_ms
node_disk_reads_completed
node_disk_writes_completed
Count Disk Latency & R/W Available
Network
node_network_receive_bytes
node_network_transmit_bytes
Gauge Network Information
System
node_time
node_boot_time
Gauge System Time
node_filefd_allocated
node_filed_maximum
Gauge File discriptor](https://image.slidesharecdn.com/kuberneteswithprometheusmonitoring-181005042628/75/kubernetes-Prometheus-Monitoring-18-2048.jpg)
![Core Metrics: kubernetes Container
• Container Resource Usage 중심 (CPU,Mem, Network, Disk..)
• Pod, Deployment, StatefulSet, DaemonSet 등 Replica controller 기준으로 조합 활용
ü prefix : container_[xxx]
cAdvisor : Docker Daemon 내 Running Container Metric 노출
구분 Metric Type Description
CPU
container_cpu_usage_seconds_total Counter Container CPU Usage (per processer)
container_cpu_cfs_throttled_seconds_total Counter Container CPU throttled Time
Memory
container_memory_usage_bytes Gauge
Current memory usage in bytes(all memory
regardless of when it was accessed)
container_memory_working_set_bytes Gauge Current working set in bytes
Network
container_network_receive_bytes_total Counter Cumulative count of bytes received.
container_network_transmit_bytes_total Counter Cumulative count of bytes transmitted.
System container_start_time_seconds Gauge Container start time](https://image.slidesharecdn.com/kuberneteswithprometheusmonitoring-181005042628/75/kubernetes-Prometheus-Monitoring-20-2048.jpg)
![Core Metrics: kubernetes metric
Kube-state-metric : Generate metrics about k8s API
• Exporter로 Container 구동되어 Kubernetes Metric 수집
• kubectl get ~ : node, service, deployment, replicasets, pods, pv, pvc, configmap, quotas,
secret, etc…
ü prefix : kube_[xxx]
ü https://github.com/kubernetes/kube-state-metrics/tree/master/Documentation#exposed-
metrics
Node Metric
Pod Metric
Deployment
Metric
- Node Info IP (Name, IP, Version)
- Node Condition
- Node Capacity
- Pod / Container Info (Pod IP,
Namespace, Node IP)
- Pod / Container status
- Container Resource (Requests,limit)
Service Metric
- Service Info (Cluster IP, Name)
- Service Type
- Deployment Replica Count
- Replica Availables
Quota Metric
- Resource Quota 할당 정보](https://image.slidesharecdn.com/kuberneteswithprometheusmonitoring-181005042628/75/kubernetes-Prometheus-Monitoring-21-2048.jpg)


![[OpenInfra Days Korea 2018] (Track 4) - Grafana를 이용한 OpenStack 클라우드 성능 모니터링](https://cdn.slidesharecdn.com/ss_thumbnails/42openinfraday201820180626grafana-180704055533-thumbnail.jpg?width=640&height=640&fit=bounds)


![[115]쿠팡 서비스 클라우드 마이그레이션 통해 배운것들](https://cdn.slidesharecdn.com/ss_thumbnails/115coupang-181011031522-thumbnail.jpg?width=640&height=640&fit=bounds)


![[오픈소스컨설팅] 프로메테우스 모니터링 살펴보고 구성하기](https://cdn.slidesharecdn.com/ss_thumbnails/oscprometheus-190422050231-thumbnail.jpg?width=640&height=640&fit=bounds)
![[OpenInfra Days Korea 2018] Day 2 - E6 - OpenInfra monitoring with Prometheus](https://cdn.slidesharecdn.com/ss_thumbnails/e61520monitoringopeninfrawithprometheusv1-180704062709-thumbnail.jpg?width=640&height=640&fit=bounds)